R E S E A R C H
Open Access
Mathematical modeling of septic shock
based on clinical data
Yukihiro Yamanaka
1, Kenko Uchida
1, Momoka Akashi
1, Yuta Watanabe
1, Arino Yaguchi
2, Shuji Shimamoto
2,
Shingo Shimoda
3, Hitoshi Yamada
4, Masashi Yamashita
4and Hidenori Kimura
1*Abstract
Background:Mathematical models of diseases may provide a unified approach for establishing effective treatment strategies based on fundamental pathophysiology. However, models that are useful for clinical practice must overcome the massive complexity of human physiology and the diversity of patients’environmental conditions. With the aim of modeling a complex disease, we choose sepsis, which is highly complex, life-threatening systemic disease with high mortality. In particular, we focused on septic shock, a subset of sepsis in which underlying circulatory and cellular/metabolic abnormalities are profound enough to substantially increase mortality. Our model includes cardiovascular, immune, nervous system models and a pharmacological model as submodels and integrates them to create a sepsis model based on pathological facts.
Results: Model validation was done in two steps. First, we established a model for a standard patient in order to confirm the validity of our approach in general aspects. For this, we checked the correspondence between the severity of infection defined in terms of pathogen growth rate and the ease of recovery defined in terms of the intensity of treatment required for recovery. The simulations for a standard patient showed good correspondence. We then applied the same simulations to a patient with heart failure as an underlying disease. The model showed that spontaneous recovery would not occur without treatment, even for a very mild infection. This is consistent with clinical experience.
We next validated the model using clinical data of three sepsis patients. The model parameters were tuned for these patients based on the model for the standard patient used in the first part of the validation. In these cases, the simulations agreed well with clinical data. In fact, only a handful parameters need to be tuned for the simulations to match with the data.
Conclusions: We have constructed a model of septic shock and have shown that it can reproduce well the time courses of treatment and disease progression. Tuning of model parameters for each patient could be easily done. This study demonstrates the feasibility of disease models, suggesting the possibility of clinical use in the prediction of disease progression, decisions on the timing of drug dosages, and the estimation of time of infection.
Keywords: Septic shock, Model-based therapy, Blood pressure, Immune system, Inflammation
* Correspondence:[email protected]
1Waseda University, 3-4-1 Ohkubo, Shinjuku-ku, Tokyo, Japan Full list of author information is available at the end of the article
Background
Sepsis is a highly complex, life-threatening systemic dis-ease caused by infection and has a high mortality rate. The number of sepsis patients is estimated to be around 27 million per year globally, of whom approximately 8 million people die, and the number of sepsis patients is increasing [1]. The disease is sometimes referred to as
the most common but least recognized disease[2]. In the most severe form of sepsis, called septic shock, under-lying circulatory and cellular/metabolic abnormalities are profound enough to substantially increase mortality [3] and the effects of inflammation produced by the im-mune system spread systemically and induce an acute systemic disorder [4]. Patients with septic shock must be treated urgently in an intensive care unit. Because of its complexity, the progression of septic shock varies from patient to patient, depending on age, sex, physical charac-teristics, physiological activity, underlying disease, and other factors. Therefore, treatment is largely based on doctors’skill obtained through practical experience, as is usually the case in the treatment of other diseases. Al-though several standard guidelines are available [5, 6], more effective, versatile, and reliable therapeutic strategies for emergency medicine are currently being sought.
The art of medicine, which emphasizes the individual-ity of patients, must be supported by a solid scientific understanding of disease based on human physiology. The art and science of medicine should be integrated in clinical practice at a much higher level than at present.
In the physical sciences and engineering, most of the knowledge accumulated to date about devices, components, and systems has been represented by models, most of which are presented quantitatively (mathematically). These models are available in vari-ous forms, such as scientific papers, patents, and soft-ware packages, and are used extensively as a concise representation of accumulated scientific knowledge in the research and development of new devices, compo-nents, and systems.
Accurate models of disease based on physiology and pharmacology could contribute to improving the treat-ment of diseases. Doctors could use such models to esti-mate the physiological state of their patients, predict the disease progression, and decide on treatment strategies, including the administration of drugs. Models could therefore provide a unified scientific background to clin-ical practice. Rami et al. extensively discussed and pre-sented persuasive reasoning along these lines based on a historical review of treatment for sepsis [7]. They aimed to demonstrate the potential of disease models in ther-apy and open the door to model-based therther-apy.
One problem with models is to incorporate the individuality of patients. We anticipate that individual differences can be accommodated by choosing model
parameters carefully based on the patients’age, weight, sex, physiological status, underlying diseases, and other factors. Modern hospitals are well equipped with ad-vanced diagnostic systems that would allow the easy customization of a disease model for each patient. In addition, mathematical models could help to promote a deeper understanding of diseases and establish a hypoth-esis of pathogenhypoth-esis, improving our understanding of treatment methods.
Due to the complexity of disease physiology, it is difficult to model human diseases, and most mathem-atical models of disease physiology have so far fo-cused on experimental animals, except models of diabetes and Parkinson’s disease. Treatment strategies have been developed for diabetes based on mathemat-ical models [8]. The model developed by Kovatchev et al. [9] was approved by the US Federal Drug Ad-ministration as an alternative to animal research for the approval of diabetes medications. Recently, we have constructed a diabetes model that includes brain-centered glucose metabolism and suggested an alternative therapeutic strategy for diabetes [10]. A mathematical model based on brain metabolism has been constructed for Parkinson’s disease and is recog-nized as a useful tool for investigating its pathogen-esis [11, 12]. The importance of mathematical models in understanding the basic physiology in the progres-sion of sepsis has been highlighted in previous work [13]. In addition, Kendrick et al. published a clear de-scription of the immune response to sepsis [14], and Shi et al. discussed a bifurcation analysis of sepsis based on an immune system model [15].
In this study, we aimed to construct a new math-ematical model of septic shock based on clinical data. Among the diverse symptoms of sepsis patients, we focused on the damage caused to the cardiovascular system because septic shock most frequently damages the cardiovascular system. Our model combines the cardiovascular system, immune system, and pharma-cological models, and we used existing models of these systems as our guiding tools [16, 17]. We fo-cused on how inflammation resulting from immune activity affected the cardiovascular system and caused septic shock. Among the many possible effects of in-flammation on the cardiovascular system, we selected increased vessel permeability, vasodilation, and re-duced stroke volume [18, 19]. We incorporated these three factors into the combined model of the cardio-vascular and immune systems, making the resulting model highly nonlinear. Through simulations, we showed that these three factors are sufficient to re-produce septic shock.
be incorporated because they are crucial to the disease model. We could not measure the activity of the nervous system, but we incorporated qualitative physiological and empirical data to achieve a quantitative description in our model to reflect realistic physiological effects. The activity of the nervous system is weaker in pa-tients with sepsis than in healthy people; thus, we in-troduced fatigue as a parameter of the sympathetic nervous system [20, 21]. In addition, the effects of drugs are reduced in sepsis patients compared with healthy people. Therefore, we used experimental data showing the reduced effects of an antihypertensive medicine in sepsis patients.
Method
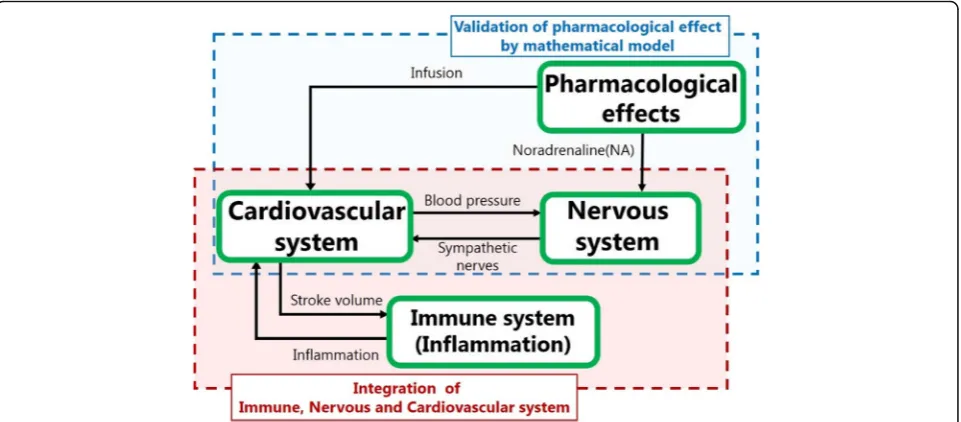
We constructed a mathematical model that represents the physiological dynamics of septic shock after infec-tion and comprises cardiovascular system, immune system, nervous system, and pharmacological submo-dels. An overview of our model is shown in Fig. 1. There are various cardiovascular, nervous, and im-mune system models for different uses in the litera-ture. Most of these models are closed in the single-target domain, although they must be con-nected to represent the disease. In this study, we fo-cused on integrating these models, based on choosing appropriate existing models for the sepsis model. We used the cardiovascular system model proposed by Ursino and Innocenti [17], which is comprehensive and includes the solute kinetics of each constituent in blood, as well as the sympathetic nervous system. Be-cause the increase in vascular permeability is an
important effect of inflammation on the cardiovascu-lar system, the solute kinetics of the systemic capilcardiovascu-lar- capillar-ies in the model are essential in our sepsis model.
The immune system is complex, and quantitative models are still incomplete [22, 23]. We based our sepsis model on the model reported by Reynolds et al. [16] because it is simple but captures the essen-tial features of the immune system that are relevant to our sepsis model. We incorporated the effect of antibiotics into this model, following the proposal of Kitamura [24].
The core of our sepsis model is in the link between the cardiovascular and immune systems. In other words, we model how inflammatory responses damage the cardiovascular system. As stated in the Back-ground section, we considered the three effects of in-flammation on the cardiovascular system—increased vessel permeability, vasodilation, and reduced stroke volume—all of which contribute to reducing blood pressure. To quantify these effects, we represented the three parameters as functions of inflammation. Because inflammation manifests in diverse ways, it is hard to represent as a simple physical quantity; it is more an abstract and collective quantity. In contrast, permeability, vasodilation, and stroke volume are tan-gible physical parameters with clear units of measure-ment. The model connected these physical parameters with an abstract representation of the severity of in-flammation. This was an unavoidable difficulty and an intriguing aspect of sepsis modeling.
Next, we briefly describe each model.
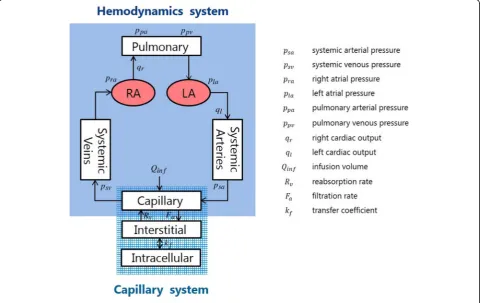
The cardiovascular system model is composed of five compartments, namely, the pulmonary atrium (pa), right
atrium (ra), left atrium (la), systemic arteries (sa), and the systemic veins (sv) (Fig.2).
Each compartment is described by its volumeV, pres-sure P, incoming flow rate qin, outgoing flow rate qout, and compliance C representing the compartment cap-acity, subject to the conservation of mass
dV
dt ¼qin−qout; ð1Þ
V¼CP ð2Þ
The right cardiac output qr and left cardiac outputql are represented by.
qr¼Srf; ql¼Slf; ð3Þ
whereSrandSlare the right and left stroke volumes,
re-spectively, andfis the heart rate.
The solute kinetics of the capillary system that trans-ports the blood components to the tissues are important in our model. We focus on the material exchange be-tween vessels and the interstitial fluid. The total blood volumeVis subject to the following transport law:
dV
dt ¼−FaþRvþQinf ð4Þ
whereQinfdenotes the external infusion rate. OutflowFa
from the vessel to the interstitial space and inflow Rvin
the opposite direction in eq. (4) are determined by blood pressure and oncotic pressure as
Fa¼La ðPac−PisÞ− πpl−πis
ð5Þ
Rv¼Lv ðPis−PvcÞ− πis−πpl
ð6Þ
wherePacis the capillary arterial pressure,Pisthe
inter-stitial fluid pressure, Pvc the venous capillary pressure, πpl the plasma oncotic pressure, and πis the interstitial oncotic pressure. Coefficient La in equation (5) denotes
vessel permeability, which is important in our model, whereas coefficient Lv in equation (6) denotes another
permeability characterizing the opposite blood flow, which is considered to be irrelevant to damage. In real-ity, there are more inputs and outputs that affect the total blood volume, such as the blood carried to the kid-neys. However, we neglected these other factors because their contributions are relatively small. The more de-tailed solute dynamics associated with equations (5) and (6) are described by Ursino and Innocenti [17].
Total blood volume V consists of six components, namely,
V¼VuþVf; Vf ¼VρaþVraþVlaþVsaþVsv
ð7Þ where Vu is the unloaded volume and Vf is the filling
volume which consists of the volume in each compart-ment. The unloaded volume is the part of blood reser-voir in the heart that does not circulate.
The baroreflex is governed by the sympathetic nervous system, which elevates the blood pressure when the baroreceptors detect a decrease in blood pressure. The increase in blood pressure is achieved via elevation of the heart rate, increased vascular resistance, and in-creased venous blood volume unloading [25].
Letabe the action of the sympathetic nervous system. The mechanisms of nervous system action are different for each component of the baroreflex; thus, a for heart rate elevation is denoted byaf,a for increasing vascular resistance is denoted by ar, and a for increasing unloaded blood volume is denoted by aυ. The elevation in heart rate mediated by sympathetic action is described as
f ¼ f0 1−a0f þaf
ð8Þ where f0is the normal heart rate and a0f is the normal
level of sympathetic nervous system activity.
According to Poiseuille’s law, vessel resistanceRis in-versely proportional to the fourth power of the vessel ra-diusr, that is,
RQ
r4¼r0Kr;cr; ð9Þ
wherer0is the normal vessel radius,Q=r4o is the normal
vessel resistance, andKr, crrepresents the change in the
vessel radius due to sympathetic nerve activity ar. We
assume that sympathetic nerve activity decreases the vessel radius as
Kr;cr¼ 1
1−a0rþar¼
1
Ar ð10Þ
If ar increases above a0r, then Kr, cr and resistance R decrease.
Finally, the unloaded blood volumeVuin equation (7) is assumed to be reduced by the sympathetic nervous system in the same way as in equation (10),
Vu¼Vu0Kv;cr; KV;cr¼ 1
1−a0vþav¼
1
AV; ð11Þ
where Vu0 is the normal unloaded blood volume Vu
given in equation (7) [17]. The reduction of the unloaded volume implies an increase in circulating vol-umeVfdue to equation (5), assuming that total volume
Vis fixed.
Now we quantify the baroreflex and its fatigue. Let
X be the average output of the baroreceptors that de-tect the right arterial blood pressure, Pra, and the sys-temic arterial blood pressure, Psa, which is assumed to be
X¼qrPraþqsPsa ð12Þ
where qr and qs are averaging factors. The sympathetic
nervous system responds to the decreasing pressure sig-nal represented by
ΔX¼X0−X ð13Þ
whereX0is the normal baroreceptor signal given by.
X0¼qrPra0þqsPsa0 ð14Þ
The normal arterial blood pressure,Pra0, and systemic blood pressure,Psa0, depend on individual patients.
Since the nerve activities af, ar and aυ have the same mathematical representations, we omit their subscripts f, r, andυ in the following description. We assume that a
changes between its minimum, amin, and maximum,
amax, due to a change in X. Thus, a is assumed to be represented by a sigmoid function ofΔX:
a¼ amax−amin
1þ expð−ΔX=X0Þþ
amin ð15Þ
The normal level of sympathetic nerve activity a0 cor-responds to the activity level whenΔX= 0. Hence, equa-tion (15) implies
a0¼
amaxþamin
2 ð16Þ
that is, the average ofamaxandamin.
If sympathetic nerve activity is sustained above its nor-mal level for a long time, then the action gradually de-creases due to fatigue (e.g., [20]). To represent this effect, we introduce fatigue factorγas
_ γ¼τ1
γða−a0Þ ð17Þ
andγdecreases the nervous activity as
a¼ amax−amin
1þ expð−ΔX=X0þγÞþ
amin ð18Þ
Ifa0<afor an extended time,γ increases andais re-duced according to equation (18). Equations (17) and (16) are nonlinear differential equations.
although there have been several attempts to quantify the dynamics [23, 25]. We base our sepsis model on the model proposed by Reynolds et al. [16] because their model is simple but captures some essential fea-tures of the immune system that are relevant to sepsis.
The dynamic model is composed of the four state vari-ables, pathogen population P, inflammation N∗, damage
D, and anti-inflammatory mediatorCA(Fig.3) [16]. The interactions among these variables are described as follows.
The dynamics ofPare described by.
dP
dt¼kpgP 1− P P∞
− kpmSmP μmþkmpP−
kpng Nð Þ P−ε
Cγf Cγf þECγ50
;P
ð19Þ
g xð Þ ¼ x
1þðCA=C∞Þ2
ð20Þ
The first term represents the logistic growth of patho-genP, wherekpgis the growth rate andP∞is the carrying
capacity of P. The second term represents the non-specific local immune response towardP character-ized by the Michaelis–Menten equation [16]. The third term represents the removal of the pathogen by phago-cytic immune cells, which is proportional to inflamma-tion N∗, restricted by the anti-inflammatory mediator
CA, as shown in equation (20). The forth term repre-sents the effect of antibiotic dosage proposed by Kita-mura [24]. Here, Cf denotes the free concentration of antibiotic, which is subject to the following dynamics.
dX1
dt ¼−kaX1 ð21Þ
dX2
dt ¼kaX1−keX2 ð22Þ
Cf ¼ fpX2=Vd ð23Þ
Here, X1 denotes antibiotic dosage, X2 its blood con-centration,ka the absorption coefficient andkethe deg-radation coefficient.
The inflammation dynamics are represented by
dN
dt ¼
SnrR
μnrþR
−μnN ð24Þ
R¼g knnN þknpPþkndD ð25Þ
The first term of equation (24) is a simplified repre-sentation of the initiation of inflammation caused by P,
D, and N∗ represented by their linear combination in equation (25), andsnrandμnrare Michaelis–Menten pa-rameters for the inflammatory reactions. Function g in-troduced in equation (20), which represents the saturating factor due to the presence of anti-inflammatory mediatorCA, is also used to represent the initiation of inflammation. The second term represents the degradation.
CAis subject to the dynamics
dCA dt ¼Scþ
kcng Nð þkcndDÞ
1þg Nð þkcndDÞ−μCCA ð26Þ Here, Sc denotes a source of CA and the second term represents the production ofCAfrom damage Dand in-flammation N∗ by a Michaelis–Menten term with inhib-ition mediated by CA itself. The third term represents the degradation. More detailed descriptions are found in Reynolds et al. [16].
Damage D is an abstract quantity in the paper by Reynolds et al. [16], but here we give it a physical mean-ing to represent cardiovascular system damage. There are several ways to identify cardiovascular damage, and we take reduced stroke volume Sl, introduced in equa-tion (3), because it affects the whole system substantially. We describe the damage as
dD
dt ¼kDSd−μdD ð27Þ
Sd¼
1
1þeðkSl=S0−k0Þ; Sl≤S0
0 Sl>S0
(
ð28Þ
where S0 is the normal stroke volume and Sd is a
de-creasing sigmoid function that takes the value 1/(1 +
e−k0) (i.e., approximately 1) when Sl = 0, and 1=ð1 þeðk−k0ÞÞ (i.e., approximately 0) when S
l=S0, provided
that appropriate values ofkandk0are used.
Next, we quantify how inflammation lowers blood pressure. The most important factor is the increase in the permeability of the capillaries due to inflammation [16, 18]. In our model, capillary permeability is repre-sented by coefficientLain equation (5). We assume that the inflammation populationN∗increasesLafollowing a sigmoid function given by
La ¼ La;max−La;min
1þ EC50;La=N
slopeLaþLa;min ð29Þ
where La, max and La, min are the maximum and
mini-mum levels of permeability, respectively. Equation (29) is in the same form as equation (18). If N∗ is large, La
goes to La, max, whereas if N∗is negligibly small, La
be-comes equal toLa,min.
The vessel radiusris given by equation (9), and we as-sume Ar in (10), which represents the dilation factor,Kr, cr, is now reduced byN∗as
Ar→Ar−EX; EX¼ kEX
1þEC50;EX=NslopeEX
ð30Þ
to represent the effect of inflammation.EXtends to zero asN∗approaches zero.
Finally, we assume that inflammation damages the function of the heart substantially [13, 23]. We assume that inflammation decreases the left stroke volumeSl de-fined by equation (3) as
Sl¼ S0
1þksg Nð Þ ð
31Þ where S0 denotes the normal stroke volume and g is
given by equation (20).
Lowered blood pressure in septic shock is treated by infusion and drugs. Infusion is represented by the term
Qinf in equation (4). An infusion may contain many blood components and varies according to the condition of the patient. However, we omitted a detailed descrip-tion of the components and assume the infusion to be 0.9% saline.
There are several drugs used to treat severe hypotension in sepsis patients, of which noradrenaline and dopamine are the most commonly used in clin-ical practice. Antibiotics are also used to dispose the pathogen and are represented by the fourth term of equation (19).
The dose-response curve of noradrenaline (NAeff) is normally represented by a sigmoid function
NAeff ¼ NAeff:max
1þNAc=EC50;NA−slopeNA
ð32Þ
where NAc denotes the concentration of
noradren-aline in the vessels. Although the noradrennoradren-aline dose-response curve is available for healthy individuals [25], it cannot be applied for patients with sepsis be-cause the effect of noradrenaline is weaker in these patients than in healthy people [26–28]. The effect of noradrenaline in the treatment of hypotension in pa-tients with sepsis compared with healthy controls is shown in Fig. 4, which was reproduced from the paper by Annane D. et.al. [27]. The reduction in the effect is significant and should be considered in models of sepsis treatment. We tuned parameters
EC50, NA and slopeNA in equation (32) to fit the
clin-ical data of noradrenaline administration to the con-trols of Fig. 4. We noticed that the clinical data in Fig. 4 for sepsis patients could be reproduced by sim-ply increasing EC50, NA by a factor of approximately
102 (Fig. 5).
Noradrenaline acts in various ways to elevate blood pressure. Here, we simply assumed that noradrenaline increases the effect of sympathetic nerve activity a. Thus, after the dosage NAin, sympathetic nerve activity is assumed to be increased by a factor proportional to
NAeff, that is,
a→aþkNAeff ð33Þ
where k is a coefficient representing the reinforcing effect of noradrenaline. In the computation, a is changed to a+kNAeff after the dosage of NA
wher-ever a appears.
Another major drug for sepsis therapy is dopamine, the main effects of which are increasing the heart rate and stroke volume [26]. These effects are described as
f0¼ f1þGD;f∙DO ð34Þ
Fig. 4Experimental results of the effects of noradrenaline on mean arterial pressure. [27]
wherefandSlare heart rate and stroke volume,
respect-ively, DO is the dopamine concentration, andGD, fand
GD, sare the coefficients of the effects of dopamine onf
andSl, respectively. Here, we assume thatfandSlare
in-creased to f′ and S0l, respectively, due to the dopamine dosage. We assume that dopamine becomes effective through the first-order transfer process,
TDdD
dt ¼DOin−DO ð36Þ
whereDOindenotes the actual dosage of dopamine.
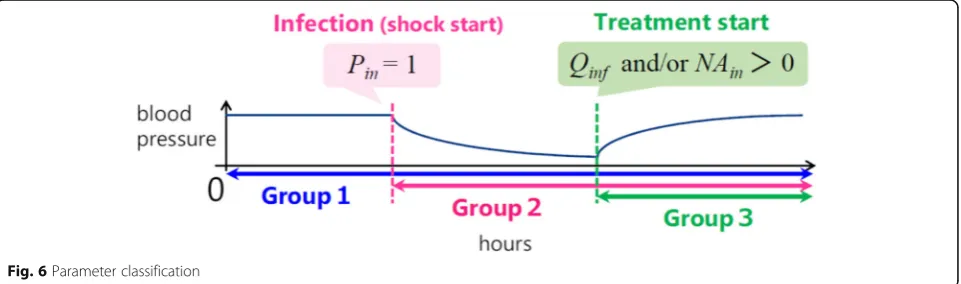
Parameters
Our model contained a number of parameters that must be quantified to perform simulations. We classified them into three groups according to the time periods in which they were used (Fig.6).
The parameters in group 1 are used throughout the whole simulation, even before infection. They represent the physical characteristics of the patient, such as weight, sex, and underlying diseases. All parameters in the cardiovascular system are taken from the paper by Ursino and Innocenti [17]. Their numerical values are shown in Table A1 of the Appendix.
The parameters related to the nervous system used in equations (9)–(18) are shown in Table A2 in the Appen-dix. Some of them are taken from Ursino and Innocenti’s paper [17], and others are estimated mainly based on the literature. Some parameters are fitted based on MATLAB tools to minimize the gap between data and simulation. .
The initial value of the total blood volumeVdepends on sex and weight. We assume that the total blood vol-ume is 8% of body weight for men and 7% for women [29]. We also consider the possibility of heart failure as an underlying disease. The quantitative description of heart failure is presented in the Results section.
The parameters in group 2 are used after the initi-ation of infection and include the immune system
parameters. We take these parameters from the paper by Reynolds et al. [16] (Table A3). This group also contains parameters that represent the effects of in-fection on the cardiovascular system. The most im-portant parameters in this group are those that represent the increase in blood permeability La de-noted by equation (5). There are several papers that report attempts to measure blood permeability. It was reported that the maximum value of La during infec-tion is almost 6 times greater than normal La [30– 32], and we used this observation in our model. The other parameters in equation (29) are chosen by tun-ing and are listed in Table A4 in the Appendix.
The growth rate of the pathogen, given by parameter
kpg, is used to represent the severity of the infection. Other parameters are taken from the model reported by Reynolds et al. [16].
The parameters in group 3 are pharmacological pa-rameters that represent drug efficacy [24]. The dose-response curve of noradrenaline is represented by sigmoid function in equation (32) and the numer-ical values of the associated parameters have been experimentally obtained for healthy subjects [25]. The dose-response curve for sepsis patients may dif-fer from that for healthy people. The numerical values of the parameters in equation (30) are listed in Table A5.
Results
We validated the model in two steps. In the first step, we establisheda standard patient modelcapturing some essential features of sepsis progression and treatment ef-fect, at least qualitatively. For this purpose, the relation-ship between the severity of the infection and the difficulty of recovery was important in the disease model. We represented the severity of infection through the value of parameter kpg in equation (19), which de-scribes the growth rate of the pathogen.
We took heart failure as a representative example of an underlying disease in patients due to the
strong link between sepsis and cardiac insufficiency [33, 34]. A typical consequence of heart failure is a reduction in stroke volume. According to the Euro-pean Society of Cardiology guidelines published in 2016 [34], heart failure is defined as a circulatory condition in which the ejection fraction (EF) is below 40%, where EF is defined as the ratio of the left heart cardiac stroke volume to the left heart blood volume. Normal EF is between 50 and 60%. We noticed that if the left cardiac stroke volume Sl in equation (3) was reduced by 22%, we obtained a 40% drop in EF, which is consistent with the defin-ition of heart failure with reduced EF. Therefore, we used this reduction in Sl to represent heart failure as the underlying disease.
We classified the severity of infection as mild, mod-erate, and severe, based on the range of parameter
kpg. Sepsis progression was represented in the time courses of mean arterial pressure (MAP) and heart rate. The recovery can be judged when the time course of MAP and heart rate returned to the normal or original level.
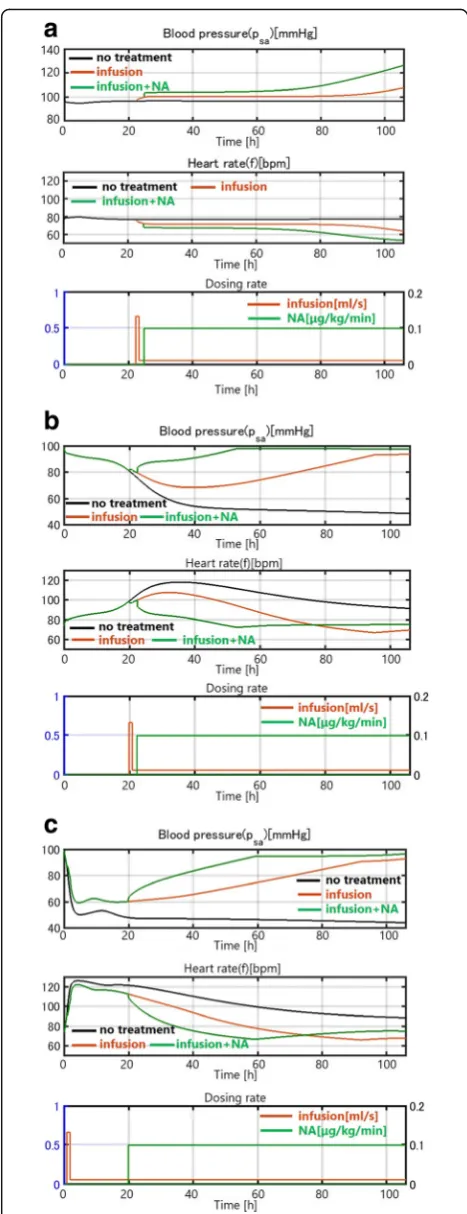
For mild infection, where kpg is small (kpg= 0.2), the disease spontaneously resolves without treatment (black curve). The internal immune system works ef-fectively, although the blood pressure decreases slightly and temporarily (Fig. 7(a)). Thus, natural
healing due to the innate immune system is
achieved. An additional simulation shows that saline infusion (red curve) and noradrenaline (green curve) improve the recovery process in the mild infection case (Fig. 7(a)).
For moderate infection (kpg= 0.45), the internal im-mune system alone cannot control the effect of inflam-mation and the blood pressure continues to decrease (Fig. 7(b)). However, infusion can prevent the decrease in blood pressure. Blood pressure does not decrease even after the infusion rate is reduced to the minimum level after 1 h of intensive infusion, which is consistent with clinical data.
For severe infection with a high kpg (kpg= 1.50), infu-sion alone is not enough to raise the blood pressure and noradrenaline is needed (Fig.7(c)).
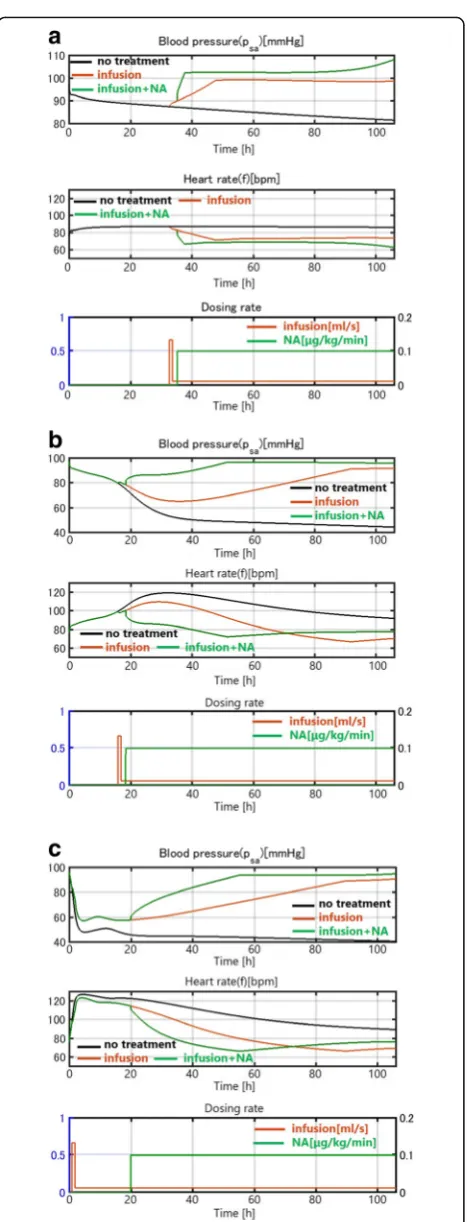
We conducted the same simulations for a case with heart failure as an underlying disease. In this patient, no spontaneous healing occurred. Even in the case of mild infection, the blood pressure con-tinued to drop without treatment, as shown in Fig. 8(a) (black curve). This is consistent with clin-ical observations that heart failure often seriously af-fects sepsis progression. An infusion can resolve the drop in0020blood pressure, as in patients without heart failure. The time courses in Figs. 7(b)(c) and 8(b)(c) are similar, indicating that in cases of
Fig. 7(a) Patient with a mild infection (kpg= 0.2). (b) Patient with a
moderate infection (kpg= 0.45). (c) Patient with a severe infection
moderate and severe infection, the sepsis damage domi-nates the effect of heart failure as an underlying disease, which is also consistent with some clinical observations.
The two in silico experiments show that our model reproduced the progression of septic shock and the out-come of the treatment, at least qualitatively.
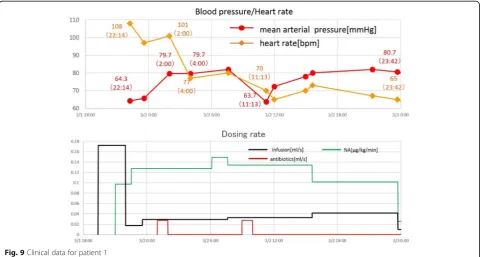
Now, we validated our model quantitatively using real clinical data from three patients with septic shock who were treated in Tokyo Women’s Medical University Hospital. Basic information about the patients is given in Table1.
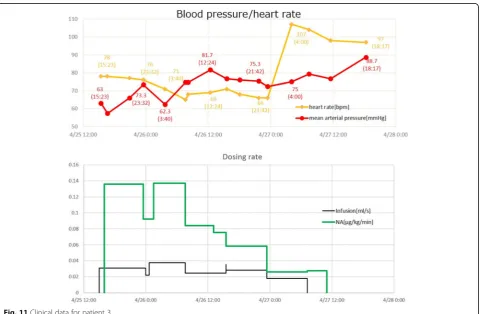
For model validation, we used blood pressure and heart rate time courses, which were fundamental state variables for tracking disease progression and therapy. In Figs. 9, 10, 11, the time courses of blood pressure and heart rate records are shown with the infusion and drug administration records of each patient. The time according to the records is shown on the hori-zontal axis. The severity of infection was set as mod-erate for all cases.
We observed marked different time courses of sepsis progression among the three patients. We must adjust the parameters of the model to reproduce the data for each patient. We performed simulations to check whether the model parameters could be adjusted to fit the computa-tional results to the clinical data. Parameters were ad-justed starting with the model constructed for astandard patient in the first step of validation. Figure12compares the simulation results and clinical data for patient 1. The blood pressure (MAP) and heart rate computed by our model fit the clinical data well.
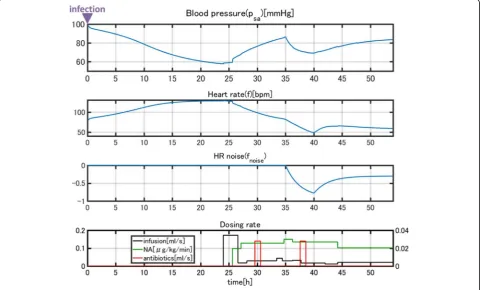
A sudden drop in blood pressure occurred 17 h after treatment began, which the model did not reproduce.
Normally, a drop in blood pressure is associated with an elevated heart rate according to the baroreflex response. However, in this case, the patient’s heart rate also dropped. Because this patient was a heavy habitual alcohol drinker (ca. 150 g/day), we thought a heart dysfunction was in-duced during septic shock. Thus, we imposed external noisefnoiseon heart ratefgiven in equation (3) as
f→f þfnoise ð37Þ
fnoiseis shown in Fig.13. We also assumed that a sud-den reduction of arterial baroreceptor gain qr in equa-tion (3) occurred. The simulaequa-tion results incorporating these events are shown in Fig.13. The results reproduce the sudden drop in heart rate and the effect on blood pressure, as well as the recovery process (Fig. 14). Usu-ally, disease progression is affected by many unexpected factors that cannot be represented in a model. However, a model can explain unexpected events when reasonable assumptions are made. In this case, our simulation was validated due to the close link between cardiac dysfunc-tion and sepsis [35].
Figure15compares the simulation results and clinical data for patient 2.
This patient was stable with low blood pressure and high heart rate when given infusion therapy. The admin-istration of dopamine contributed to the elevation of the heart rate, which was reproduced in the simulation.
Figure16compares the simulation results and clinical data for patient 3.
The gradual recovery of the blood pressure and the as-sociated normalization of the heart rate due to infusion and noradrenaline administration are closely reproduced by the simulation.
The parameter tuning for fitting data was done by up-dating several parameters of the basic model used in the first step of the qualitative validation. Table 2 lists the parameters changed for accommodating the individual patients. Among 12 parameters, five are related to the vessel resistance. Remarkably, only a handful of parame-ters need to be adjusted for accommodating differences
among patients, and also the differences among the par-ameter values are not large.
An important parameter that is not listed in Table2 is the time interval between the time of infection and the start of treatment. At the start of the simulation, the initial value of pathogen P is set to be positive. This implies that the starting time of the simulation is the time of infection. We must decide when treatment is started (when the initial data was obtained) based on the goodness of fit between data and simulations. This tuning is one-dimensional and was not difficult. It conveys, however, valuable information about when the patient was infected before hospitalization.
Discussion
The first part of the simulation showed that our model captures the fundamental dynamics of sepsis progression and the effects of therapy. The severity of infection could be represented by the growth ratekpg of the pathogen in
Table 1Basic Information about Patients
Patient’s Data Treatment
Sex Age Weight[kg] Underlying
Disease
Infusion NA DOA Antibiotics
Patient1 male 51 66 Heart failure* ○ ○ × ○
Patient2 female 99 45 Alzheimer ○ × ○ ×
Patient3 male 79 65 Diabetes
Atrial fibrillation ○ ○
× ×
*assumed
Fig. 12Comparison of the simulation results and clinical data for patient 1
Fig. 14Comparison of the simulated and clinical data afterfnoisewas introduced
the immune model in equation (19). We considered mild, moderate, and severe infections, and treatment with noth-ing, saline infusion, and saline infusion plus medicine to identify the level of difficulty of recovery. The results are shown in Fig.7and summarized in Table3.
The results show that the severity of the infection matched the intensity of treatment required for recovery.
Many sepsis patients have underlying diseases; thus, we used heart failure as an example of an underlying disease that can be modeled by changing some parameters. We showed that the patient with heart failure does not recover from even a mild infection without treatment, which is
consistent with clinical experience. These simulations show that our model captures the essential features of sep-sis and that the interactions quantified in our model among the immune, cardiovascular, and nervous system submodels are justified, at least qualitatively.
In the second part of the simulation, we validated our model to fit clinical data of three sepsis patients (Figs. 9–11). As stated in the Background section, the progres-sion of sepsis differs among patients, and the symptoms are also different. Although it is necessary to customize the models for each patient by choosing appropriate model parameters, there are a large number of parameters Fig. 16Comparison of the simulation results and clinical data for patient 3
Table 2Patients parameter information
Parameter Standard Patient Patient1 Patient2 Patient3
Normal value of heart ratef(f0) 1.2beat/s 1.2beat/s 1.25beat/s 0.9beat/s
Normal value of arteriovascular radiusr(r0) 3.0μm 3.0μm 2.85μm 2.9μm
Initial total blood Volume(V0) 3150ml 5300ml 3150ml 5200ml
Severity(kpg) - 0.55 /h 0.7 /h 0.6 /h
Rate of vessel radiusr dilation(kEX) 40 50 35 44
Compliance of sa(Csa) 4ml/mmHg 4ml/mmHg 2.8ml/mmHg 2.8ml/mmHg
Resistance of the systemic circulation upstream of arteriolar capillaries(Rs2) 0.2247mmHg∙s/ml 0.2247mmHg∙s/ml 0.2247mmHg∙s/ml 0.2472mmHg∙s/ml
Resistance of the systemic circulation downstream of arteriolar capillaries(Rs3) 0.1124mmHg∙s/ml 0.1124mmHg∙s/ml 0.1124mmHg∙s/ml 0.1236mmHg∙s/ml
Resistance of sv(Rsv) 0.011mmHg∙s/ml 0.011mmHg∙s/ml 0.011mmHg∙s/ml 0.012mmHg∙s/ml
Resistance of pa(Rpa) 0.1124mmHg∙s/ml 0.1124mmHg∙s/ml 0.1124mmHg∙s/ml 0.1236mmHg∙s/ml
Resistance of pv(Rpv) 0.0056mmHg∙s/ml 0.0056mmHg∙s/ml 0.0056mmHg∙s/ml 0.0062mmHg∙s/ml
Rate at which activated phagocytes(N*) consume pathogen(kpn) 1.8 /N*-units/h 1.8 /N*-units/h 1.8 /N*-units/h 1.26/N*-units/h
making customization appear difficult. However, as was shown in Table3, the number of parameters tuned for fit-ting was not very many and most parameters were un-changed from the general model of a standard patient used for the first part of simulations (Figs.7 and 8). The most obvious differences were body weight and sex, which affect the total blood volume. Age differences were taken into account by choosing the vessel flexibility and radius, and the strength of the sympathetic nerve activity was tuned slightly to accommodate the data. They are natural, easy, and reasonable customizations for individuality.
Heart failure is included as an underlying disease in patient 1. The sudden drop in blood pressure is accom-modated by a sudden drop in heart rate, which is usually a symptom of heart failure. This suggests the possibility that the model can explain sudden events occuring dur-ing the course of treatment. For patient 3, we ignored diabetes as an underlying disease, but still obtained a good fit between the model and data.
The most finely balanced and important parameter for fitting the model to real data is the time of infection or the starting time of the simulation. Typically, a patient has already been infected when admitted to the hospital and does not know when they were infected. As discussed in the Method sections, we could estimate the time of infec-tion through a one-dimensional search. Estimating the time of infection with the model by finding the most ap-propriate initial time of simulation gives valuable informa-tion for determining the treatment strategy for a patient. This is an important benefit of disease modeling.
Because sepsis is a serious disease that affects almost all parts of the body, it may lead to other subsequent diseases, which we have not incorporated in the model. However, even when an unexpected physical event oc-curred, the model could identify the cause. Patient 1 had a sudden drop in blood pressure during treatment (Fig.12), which was explained by a heart attack (Fig.14). Although this was an estimate, it could provide valuable information for medical staff.
Conclusion
We have constructed a simple mathematical model of septic shock to represent and predict disease progression and the effects of treatments. The model combined the cardiovascular and immune systems through the effects of inflammation, which are represented by increases in
vessel permeability, vasodilation, and stroke volume re-duction. We assumed the following three effects of sym-pathetic nerve activity responding to severe hypotension caused by infection: elevated heart rate, increase in ves-sel resistance, and decrease in blood volume unloading. We also introduced the fatigue effect of the sympathetic nervous system. The weaker effects of drugs in sepsis patients were also considered.
We demonstrate that our model is a reasonable model of septic shock and represents the therapeutic effects of treatment through in silico experiments. We also show the reduced therapeutic effects in patients with sepsis who have underlying heart failure.
We validated our model based on the clinical data of three sepsis patients and showed that the model duced the treatment course. Moreover, the model repro-duced sudden physiological events in patients.
Although our model represents specific aspects of septic shock, which is complex and involves almost every organ in diverse ways, we show that we can construct a model that captures the essential features of this disease. We discuss the potential of the model to help with clinical decision making and promoting a deeper understanding of sepsis.
Because the model contained a number of parameters that must be set for simulations, the difficulty in determin-ing appropriate numerical values has been identified as one of the main barriers to using mathematical models in medi-cine. The customization of models for individual patients is an additional difficulty. However, we found that a standard patient model can be constructed based on the existing physiological, medical, and pharmacological knowledge, as described in the first part of the Results section, although some parameters had to be taken from experimental data on animals. We were able to customize the standard patient model for three patients based on their age, sex, weight, and underlying disease, by tuning only several parameters of the standard patient model. The simulations well repro-duced the data.
Our results suggest that disease modeling could help medical staff predict the patient’s condition and establish a clinical strategy for recovery. The possibility of esti-mating the infection time before treatments start is an-other benefit of the disease model.
The disease model extracts knowledge about human physiology relevant to the target disease, and the model can be customized by selecting relatively small number of parameters. We consider that the general and individual data are accommodated well in the model and that their integration can bring great benefits to clinical practice. We hope that our model will play a role in guiding practi-tioners toward model-based therapies. To achieve this goal, our model must be more reliable and versatile, and must be validated using a larger amount of clinical data, which we intend to tackle in the next step of our research.
Table 3Severity and intensity of treatment
Mild Moderate Severe
No treatment ○ × ×
Infusion ○ ○ ×
Infusion and medicine ○ ○ ○
Appendix
Table 4Cardio vascular system model (Ursino model) parameters
Parameter Value Description Source
Csa 4ml/mmHg Compliance of sa [16]
Csv 111.11ml/mmHg Compliance of sv [16]
Cra 31.25ml/mmHg Compliance of ra [16]
Cpa 6.56ml/mmHg Compliance of pa [16]
Cpv 25.37ml/mmHg Compliance of pv [16]
Cla 19.23ml/mmmHg Compliance of la [16]
Rs2 0.2247mmHg∙s/ml Hydraulic resistance of the systemic circulation upstream of arteriolar capillaries [16]
Rs3 0.1124mmHg∙s/ml Hydraulic resistance of the systemic circulation downstream of arteriolar capillaries [16]
Rsv 0.011mmHg∙s/ml Hydraulic resistance of sv [16]
Rpa 0.1124mmHg∙s/ml Hydraulic resistance of pa [16]
Rpv 0.0056mmHg∙s/ml Hydraulic resistance of pv [16]
La 0.01ml/mmHg/s Permeability coefficient of arterial capillaries [16]
Lv 0.062ml/mmHg/s Permeability coefficient of venular capillaries [16]
Vusa 611.3ml Unstressed volume of sa [16]
Vura 25ml Unstressed volume of ra [16]
Vupa 124ml Unstressed volume of pa [16]
Vupv 120ml Unstressed volume of pv [16]
Vula 25ml Unstressed volume of la [16]
kl 20ml/mmHg Slope of the stroke volume versus the atrial pressure relationship for the left heart [16]
kr 34.028ml/mmHg Slope of the stroke volume versus the atrial pressure relationship for the right heart [16]
pla0 2.8mmHg x -axis intercept of the stroke volume versus atrial pressure relationship for the left heart [16]
pra0 1.82mmHg x -axis intercept of the stroke volume versus atrial pressure relationship for the right heart [16]
Vn 5300ml Total blood volume in the basal condition [16]
Vrc 1300ml Red blood cell volume [16]
psan 100mmHg Intravascular pressure in the sa in the basal condition [16]
psvn 5mmHg Intravascular pressure in the sv in the basal condition [16]
pran 4mmHg Intravascular pressure in the ra in the basal condition [16]
ppan 17mmHg Intravascular pressure in the pa in the basal condition [16]
ppvn 7mmHg Intravascular pressure in the pv in the basal condition [16]
plan 6.5mmHg Intravascular pressure in the la in the basal condition [16]
kNa 25ml/s Mass transfer coefficient of the cellular membrane for sodium [16]
βNa 0.0704 Mass transfer coefficient of the cellular membrane for sodium [16]
kK 6.67∙10−2ml/s Mass transfer coefficient of the cellular membrane for potassium [16]
βK 28.2 Mass transfer coefficient of the cellular membrane for potassium [16]
kU 13ml/s Mass transfer coefficient of the cellular membrane for urea [16]
βU 1 Mass transfer coefficient of the cellular membrane for urea [16]
kf 4∙10−3L2/s/mmol Water exchange coefficient of the cellular membrane [16]
Meq,ic 150mmol Amount of other osmotically efficient solutes in the intracellular compartment [16]
Meq,ex 150mmol Amount of other osmotically efficient solutes in the extracellular compartment [16]
Eis 24.5mmHg/L Interstitial space elastance [16]
Visn 11L Basal volume of the interstitial fluid [16]
Vicn 25L Basal volume of the intracellular fluid [16]
Table 4Cardio vascular system model (Ursino model) parameters(Continued)
Parameter Value Description Source
cp,isn 1.37g/dl Basal protein concentration in the interstitial fluid [16]
Mk,ic(0) 3535mEq Initial amount of potassium in the intracellular fluid [16]
Mk,ex(0) 75mEq Initial amount of potassium in the extracellular fluid [16]
MNa,ic(0) 250mEq Initial amount of sodium in the intracellular fluid [16]
MNa,ex(0) 2130mEq Initial amount of sodium in the intracellular fluid [16]
MU,ic(0) 2130mEq Initial amount of urea in the intracellular fluid [16]
MU,ex(0) 375mmol Initial amount of urea in the extracellular fluid [16]
QF 0.2083ml/s Ultrafiltration rate of the replacement fluid [16]
Qinf 0ml/s Ultrafiltration rate of the replacement fluid [16]
cNa,d 142mEq/L Ultrafiltration rate of the replacement fluid [16]
cKd 62mEq/L Ultrafiltration rate of the replacement fluid [16]
cUd 0 Concentration of urea in the dialysate [16]
Fp 0.94 Plasma fractions [16]
FR 0.72 Red blood cell water fractions [16]
γU 1 Fraction of red blood cell water that participates in the transfer through the dialyzer [16]
RDU 1 Donnan ratio for urea in red cells [16]
γNa 0 Fraction of red blood cell water that participates in the transfer through the dialyzer [16]
γK 0 Fraction of red blood cell water that participates in the transfer through the dialyzer [16]
QB 3ml/s Bulk blood flow through the dialyzer [16]
DNa 2.67ml/s Dialysance (or clearance) of sodium [16]
DK 2.67ml/s Dialysance (or clearance) of potassium [16]
DU 2.67ml/s Dialysance (or clearance) of urea [16]
σRn 0.7303mmHg∙s/ml Basal value of the sigmodideal static characteristic for the mechanism of systemic resistance control [16]
ΔσR 1.4mmHg∙s/ml Amplitude of the sigmodideal static characteristic for the mechanism of systemic resistance control [16]
τR 6s Time constant of the mechanism of systemic resistance control [16]
GaR 0.02/mmHg Central gain of the arterial controls for the mechanism of systemic resistance control [16]
GcR 0.7/mmHg Central gain of the cardiopulmonary controls for the mechanism of systemic resistance control [16]
σV n 2900ml Basal value of the sigmodideal static characteristic for the mechanism of venous unstressed volume control [16]
ΔσV 500ml Amplitude of the sigmodideal static characteristic for the mechanism of venous unstressed volume control [16]
τV 20s Time constant of the mechanism of venous unstressed volume control [16]
GaV 10.8/mmHg Central gain of the arterial controls for the mechanism of venous unstressed volume control [16]
GcV 417/mmHg Central gain of the cardiopulmonary controls for the mechanism of venous unstressed volume control [16]
σTn 0.833s Basal value of the sigmodideal static characteristic for the mechanism of heart period control [16]
ΔσT 0.75s Amplitude of the sigmodideal static characteristic for the mechanism of heart period control [16]
τT 2s Time constant of the mechanism of heart period control [16]
GaT 0.015/mmHg Central gain of the arterial controls for the mechanism of heart period control [16]
GcT 0/mmHg Central gain of the cardiopulmonary controls for the mechanism of heart period control [16]
plat 4.5mmHg Threshold value of left atrial pressure for activation of the sympathoinhibitory mechanism [16]
Gσ 4.5mmHg Gain constant of the sympathoinhibitory mechanism [16]
τσ 120s Time constant of the sympathoinhibitory mechanism [16]
Table 5Nervous system model parameters
Parameter Value Description Sources
af,max 1.3175 Maximum value of sympathetic nerve activityaf Estimated
ar,max 8.6993 Maximum value of sympathetic nerve activityar Estimated
aV,max 0.9443 Maximum value of sympathetic nerve activityaV Estimated
af,min 0.1896 Minimum value of sympathetic nerve activityaf Estimated
ar,min 2.6996 Minimum value of sympathetic nerve activityar Estimated
aV,min 0.8206 Minimum value of sympathetic nerve activityaV Estimated
kγ 3.0 × 10⁻⁵ Sympathetic nerve effect coefficient forγ Estimated
af0 0.680 Sympathetic nervous activity forf0 Estimated
ar0 0.549 Sympathetic nervous activity forr0 Estimated
aV0 0.0935 Sympathetic nervous activity forV0 Estimated
f0 1.2beat/s Normal value of heart ratef Estimated by [16]
Rs1,0 0.0113mmHg·s/ml Normal value of arteriolar vascular resistanceRs1 Estimated by [16]
Vusv,0 2.9 × 10−
3
ml Normal value of venous unstressed blood bolumeVusv Estimated by [16]
r0 3.0μm Normal value of arteriovascular radiusr Estimated by [17]
kf 1.01 Sympathetic nerve effect coefficient forf Estimated
kr 8.2 Sympathetic nerve effect coefficient forr Estimated
kV
Table 6Immune system model and antibiotics pharmacological effect model parameters
Parameter Value Description Sources
kpm 0.6/M-units/h Rate at which the non-specific local response(M) eliminates pathogen [15]
kmp 0.01/P-units/h Rate at which the non-specific local response is exhauseted by pathogen [15]
kpn 1.8/N*-units/h Rate at which activated phagocytes(N*) consume pathogen [15]
p∞ 20·106/cc Maximum pathogen population [15]
sm 0.005/M-units/h Source of non-specific local response [15]
μm 0.002/h Decay rate for the non-specific local response [15]
snr 0.08NR-units/h Source of resting phagocytes [15]
μnr 0.12/h Decay rate of resting phagocytes [15]
μn 0.05/h Decay rate of activated phagocytes [15]
kdn 0.35D-units/h Maximum rate of damage produced by activated phagocytes [15]
μd 0.02/h Decay rate of damage [15]
kcn 0.04/CA-units/h Maximum production rate of the anti-inflammatory mediator [15]
kcnd 48N*-units/D-units Relative effectiveness of activated phagocytes and damaged tissue in inducing production of the anti-inflammatory mediator [15]
sc 0.0125CA-units/h Source of the anti-inflammatory mediator [15]
μc 0.1/h Decay rate of the anti-inflammatory meditor [15]
knn 0.01/N*-units/h Activation of resting phagocytes by previously activated phagocytes and their cytokines [15]
knp 0.1/P-units/h Activation of resting phagocytes(NR)by pathogen [15]
knd 0.02/D-units/h Activation of resting phagocytes by damage(D) [15]
c∞ 0.28CA-units Controls the strength of the anti-inflammatory mediator(CA) [15]
xdn 0.06N*-units Determines level of activated phagocytes needed to bring damage production up to half its maximum [15]
k 25 Coefficient forSrate Estimated
k0 18 Coefficient forSd Estimated
kD 0.35/h Coefficient ofSdforD Estimated
S0 73.8ml Normal value of stroke volumeS Estimated by[32]
ka 1/h Absorption rate constant from the gut compartment to the central compartment [23]
ke 1/h Elimination rate constant from the central compartment [23]
fp 1 Free fraction in plasma [23]
Vd 1l/kg Distribution volume [23]
ε 0.01/h Maximum kill rate constant [13]
Acknowledgements
This research is a part of a joint project between Toyota Motor Co., Waseda University, and Tokyo Women’s Medical University, titled Disease Modeling for Clinical Use.
Funding
This work was supported by the Toyota Corporation.
Availability of data and materials
Clinical data can be supplied on demand. All other data are available as indicated in the references.
Authors’contributions
YY: Simulations and modeling. KU: Regular and continuous inspection and discussion. MA: Modeling, simulation and literature research. YW: Simulations and modeling. AY: Medical data acquisition and overall advice. SS: Medical data acquisition. SS: Modeling. HY: Modeling. MY: Modeling. HK: Initiation of the project and overall supervision. All authors read and approved the final manuscript.
Ethics approval and consent to participate
The study protocol in this paper was approved by the Waseda University Ethics Review Committee on research with human subjects (No. 2016–086) and the Tokyo Women’s Medical University Institutional Review Board (No. 4276), and the need for patient consent was waived.
Consent for publication Not applicable.
Competing interests None.
Publisher’s Note
Springer Nature remains neutral with regard to jurisdictional claims in published maps and institutional affiliations.
Author details
1
Waseda University, 3-4-1 Ohkubo, Shinjuku-ku, Tokyo, Japan.2Tokyo Women’s Medical University, Kawada-cho, Shinjuku-ku, Tokyo, Japan. 3Institute of Physical and Chemical Research, Moriyama-ku, Nagoya, Japan. 4Toyota Motor Corporation, 1, Toyota-cho, Toyoda, Japan.
Received: 4 October 2018 Accepted: 11 February 2019
References
1. Kumar G, Kumar N, Taneja A, Kaleekal T, Tarima S, McGinley E, Jimenez E, Mohan A, Khan RA, Whittle J, Jacobs E, Nanchal R. Nationwide trends of severe sepsis in the 21stcentury (2000-2007). Chest. 2011;140(5):1223–31.
2. The World Sepsis Day Fact Sheet. 2013.https://www.uclahealth.org/sepsis/ workfiles/Pediatrics/2017_WSD_Declaration_English.pdf.
3. Singer, M., Deutschman, C. Et.al. The third international consensus definitions for sepsis and septic shock (sepsis-3). J of American Medical Association 2016;315(8), 801–810.
4. Cheng SC, et al. broad defects in the energy metabolism of leukocytes underlie immunoparalysis in sepsis. Nat Immunol. 2016;17:406–13. 5. Dellinger RP, Schorr AS, Levy MM. A users’guide to the 2016 surviving
Sepsis guidelines. Intensive Care Med. 2017;43:299–303.
6. Sepsis Management, National Clinical Guideline No.6,https://www.hse.ie/ eng/services/publications/clinical-strategy-and-programmes/
sepsismanagement.pdf.
7. Rami Namas, Ruben Zamora, Rajaie Namas, Gary An, et al. Sepsis: something old, something new, and a systems view. J Crit Care 2012;27(3), 314.e1–314.e11. 8. Magni L, Raimondo DM, Bossi L, Dalla Man C, Nicolao GD, Kovatchev B,
Cobelli C. Model predictive control of type I diabetes: an in silico trial. J Diabetes Sci Technol. 2007;1(6):809–12.
9. Kovatchev BP, Breton M, Dalla Man C, Cobelli C. In silico preclinical trials: a proof of concept in closed-loop control of type 1 diabetes. J Diabetes Sci Technol. 2009;3(1):44–55.
10. Kadota R, Sugita K, Uchida K, Yamada H, Yamashita M, Kimura H. A mathematical model of type 1 diabetes involving leptin effects on glucose metabolism. J Theor Biol. 2018;456:213–23.
11. Cloutier M, Wellstead P. Dynamics modeling of protein and oxidative metabolisms simulates the pathogenesis of Parkinson’s disease. IET Syst Biol. 2012:65–72. 12. Wellstead, P. A New Look at Disease,; Parkinson’s as seen through the eyes
of an Engineer Control Systems Principle, Stockport UK. 2012.
13. Zuev, S.M., Kingsmore, S.F., Gessler, D.DG. Sepsis Progression and Outcome: a dynamical model. Theoretical Biology and Medical Model. 2006;3 (8). 14. Kendrick, Stuart. F.W., Jones, David E.J. Mechanisms of innate immunity in
Sepsis. Chap.2 of Sepsis, Baudouin, S.V.(Ed.) Springer. 2008.
15. Shi Z, Wu C-HJ, Ben-Arieh D, Simpson SQ. Mathematical model of innate and adaptive immunity of Sepsis: a modelling and simulation study of infectious disease. BioMed Research Int. 2015;2015.
Table 8Noradrenaline pharmacologival effect model parameters
Parameter Value Description Source
N Aeff,max 1.05 Maximum effect of noradrenaline Estimated by [36]
EC50,N A 0.53kg/μg Half maximal effective NA value Estimated by [36]
slopeN A 1.09 Maximum gradient value of NA Estimated
GN A,r 5.0 Interaction strength of noradrenaline to artery Estimated by [25]
GN A,V 0.18 Interaction strength of noradrenaline to vein Estimated by [25]
Table 7Blood pressure reduction model parameters
Parameter Value Description Sources
La,min 0.01ml/mmHg/s Normal vascular permeability [16]
La,max 0.06ml/mmHg/s Maximum vascular permeability Estimated by[29][31]
EC50,La 0.22 Half maximal effectiveN* value Estimated
slopeLa 1.0 Maximum gradient value ofLa Estimated
kEX 50 Rate of vessel radiusr dilation Estimated
EC50,EX 0.5 Half maximal effective EX value Estimated
slopeEX 3.0 Maximum gradient value of EX Estimated
16. Reynolds A, Rubin J, Clermont G, Day J, Vodovotz Y, Ermentrout GB. A reduced mathematical model of the acute inflammatory response: 1. Derivation of model and analysis of anti-inflammation. J Theor Biol. 2006;242:220–36. 17. Ursino M, Innocenti M. Modeling arterial hypertension during hemodialysis.
Artif Organs. 1997;21(8):873–90.
18. Ursino M, Antonucci M, Belardinelli E. Role of active changes in venous capacity by the carotid baroreflex; analysis with a mathematical model. Heart and Circulatory Physiology. 1994;267:H253146.
19. Chen XH, Yin YJ, Zhang JX. Sepsis and immune response. World J Emerg Med. 2011;2(2):88–92.
20. Appenzellar O. The automatic nervous system and fatigue. Funct Neurol. 1987;2(4):473–85.
21. Yoshida J, Yoshino K, Okada M, Nakahara H, Sano M, Matsunaga T. Sympathetic nervous function during the vertiginous attack in a patient of meniere’s disease. Practica Otologica. 1982;75(1):161–6.
22. Su B, Xhou W, Dorman KS, Jones DE. Mathematical modeling of immune responses in tissues. Computational and Mathematical Methods in Medicine. 2009;10(1):9–38.
23. Kumar R, Clermont G, Vodovotz Y, Chow CC. The dynamics of acute inflammation. J Theor Biol. 2004;230:145–55.
24. Kitamura Y. Considerations regarding PK/PD theory for antibiotics treatment from a pharmacokinetic perspective. Drug Delivery System. 2018;33(1):10–7. 25. Hunter J. Cardiovascular systems: clinical concepts and physiology, Foster
academics; 2015.
26. Maas JJ, Pinsky MR, de Wilde RB, de Jonge E, Jansen JR. Cardiac output response to norepinephrine in postoperative cardiac surgery patients: interpretation with venous return and cardiac function curves. Crit Care Med. 2013;41(1):143–50.
27. Annane D, Bellissant E, Sebille V, Lesieur O, Mathieu B, Raphael JC, Gajdos P. Impaired pressure sensitivity to noradrenaline in septic shock patients with and without impaired adrenal function reserve. Br J Clin Pharmacol. 1998;46:589–97. 28. Sato Y, Matsuzawa H, Eguchi S. Comparative study of effects of
adrenaline, Dobutamine and dopamine on systemic hemodynamics and renal blood flow in patients following open heart surgery. Jpn Circ J. 1982;46(10):1059–72.
29. Ohshima Y. Biochemical dictionary. Tokyo, Japan: Iwanami; 1985. 30. Bethell DB, et al. Noninvasive measurement of microvascular leakage in
patients with dengue hemorrhagic fever. Clin Infect Dis. 2001;32(2):243–53. 31. Gamble J, Christ F, Gartside IB. The effect of passive tilting on microvascular
parameters in the human calf:a strain gauge plethysmography study. J Physiol. 1997;498(2):541–52.
32. Gamble J, Gartside IB, Christ F. A reassessment of mercury in silastic strain gauge plethysmography for microvascular permeability assessment in man. J Physiol. 1993;464:407–22.
33. Suzuki T, Serita R, Morisaki H. Myocardial dysfunction in sepsis:
cardioprotective strategy andβ-blockers. Journal of the Japanese Society of Intensive Care Medicine. 2011;18(2):193–200 (In Japanese).
34. Ponikowski P. 2016 ESC guidelines for the diagnosis and treatment of acute and chronic heart failure. European Heart Journal, ehw. 2015;128. 35. Weissler AM, Peeler RG, Roehll WH Jr. Relationships between left ventricular
ejection time, stroke volume, and heart rate in normal individuals and patients with cardiovascular disease. Am Heart J. 1961;62(3):367–78. 36. Grahame-Smith D. Aronson, J. Oxford textbook of clinical pharmacology
![Fig. 3 Overview of the immune system model [16]](https://thumb-us.123doks.com/thumbv2/123dok_us/299535.1522434/6.595.58.541.504.715/fig-overview-immune-model.webp)