Medium Term
Debt Management Strategy
2012/13 – 2014/15
June 2012
Information in this publication may be reproduced without restriction provided that due acknowledgement of the source is made.
Enquiries covering the publication should be addressed to:
Director
Debt Management Department
First Floor, Treasury Building, Harambee Avenue P.O. Box 30007-00100, Nairobi, Kenya
Tel: (254) 20 2252299 Fax: (254) 20 315294
Email: [email protected] or [email protected]
This publication is available at the Treasury Website at:
Table of Contents
Page
FOREWORD... VACKNOWLEDGEMENT ... VII
LIST OF ABBREVIATIONS ...IX
EXECUTIVE SUMMARY ...XI
I. GENERAL OBJECTIVE OF DEBT MANAGEMENT IN
KENYA... 1
II. OVERVIEW OF 2011 MTDS... 2
III. KEY DEVELOPMENTS SINCE THE 2011 MTDS... 3
IV. CHARACTERISTICS OF THE EXISTING DEBT PORTFOLIO... 8
V. 2012 MTDS: KEY ASSUMPTIONS... 14
VI. OUTCOMES OF ANALYSIS OF STRATEGIES ... 25
VII. DEBT SUSTAINABILITY ... 31
VIII. IMPLEMENTING THE 2012 MTDS ... 34
IX. CONCLUSION... 35
APPENDIX I: ANALYSIS OF THE COST – RISK TRADE OFF UNDER AN ALTERNATIVE SCENARIO ... 36
FOREWORD
The Government borrowing requirement and the level of public
debt has been consistent with the overall fiscal framework
supporting macro-economic stability for sustainable growth over
the medium term. It is anchored on the
Medium Term Debt Strategy
(MTDS) revised annually and tabled in Parliament as part of the
documents supporting Budget Estimates.
The Government debt management objective remains two-fold: to
raise resources through borrowing to meet central government
budgetary requirements at minimum cost and prudent level of risk;
and to promote the development of domestic debt markets.
The purpose of the
2012 MTDS
is to guide central government
borrowing in the financial year 2012/13 while providing a path for
sustainable level of debt over the medium term. The MTDS
evaluates both costs and risks of various scenarios and recommends
an optimal debt management strategy for implementation during the
financial year. In FY 2012/13, the Treasury will implement
measures to simplify and disseminate information in the
2012
MTDS
through easily accessible channels to ensure wider outreach
and understanding by the general public.
The institutional arrangement for public debt management will be
reviewed to enable the Treasury execute its mandate effectively and
efficiently under the Constitution of Kenya, 2010. The
implementation of the Constitution requires enormous amount of
resources, part of which will be sourced through borrowing. It is
therefore important to closely monitor the burden of public debt
both at the National and at County Government level so as not to
undermine economic growth.
As we implement the Constitution of Kenya, 2010, it is important
that both the burden of and benefit from public borrowing is
equitably shared between the present and future generations.
Indeed, it is one of the key principles of public finance under
Article 201 of the Constitution of Kenya, 2010. Going forward, it is
therefore expected that County Governments’ fiscal strategies will
be geared towards maintaining a sustainable level of debt.
HON. ROBINSON NJERU GITHAE, EGH, MP MINISTER FOR FINANCE
A
CKNOWLEDGEMENTThe preferred borrowing and debt strategy in the FY2012/13 is
outlined in the
2012 MTDS.
The strategy is informed by a fiscal
policy supportive of macro-economic stability and growth.
The
existing public debt portfolio and alternative borrowing mix are
carefully evaluated and taking into account the need to develop a
vibrant domestic debt market, an optimal strategy is presented.
Government’s domestic borrowing program performed dismally in
the first half of 2011/12 but significantly recovered in the third
quarter. The Government therefore sought alternative source of
funding by way of a 2 year syndicated loan of up to Ksh. 52 billion,
equivalent to USD600 million. Apart from providing funding for
the budget the loan will ease pressure on domestic interest rates,
boost foreign exchange reserves and hence pressure on the Kenya
shilling. Consistent with positive economic outlook, the
2012
MTDS
seeks to slow down the uptake of domestic borrowing not to
‘crowd-out’ the private sector, the engine of growth for
Kenya
Vision 2030
. Treasury Bonds issuance will be biased towards the
medium term tenors to create liquidity around benchmark bonds
and lower the cost of borrowing.
On the external borrowing, the Government continued to prefer
loans extended on concessional terms, that is, those with minimum
grant element of more than 35 percent to be consistent with the debt
borrowing policy. Borrowing on commercial terms will be on
exceptional circumstances. A cautious approach will be adopted in
the issuance of Government loan guarantees to minimize the level
of contingent liabilities and maintaining the level of public debt
within sustainable levels.
Let me take this opportunity to acknowledge the staff of the Debt
Management Department, Ministry of Finance who were involved
in the preparation of the
2012 MTDS.
Specifically, the core team for
the MTDS led by Mr. Charles Kairu comprising of Racheal
Njoroge, Bernard Gibet and Denis Okungu under the guidance of
Mr. John Murugu - Director, Debt Management Department.
JOSEPH K. KINYUA, CBS
PERMANENT SECRETARY/ TREASURY June 2012
L
IST OFA
BBREVIATIONS ADB African Development BankADF African Development Fund ATM Average Time to Maturity BoP Balance of Payments BPS Budget Policy Statement CBK Central Bank of Kenya CBR Central Bank Rate CPI Consumer Price Index
CPIA Country Policy and Institutional Assessment
CS-DRMS Commonwealth Secretariat Debt Recording and Management System
DGIPE Department of Government Investment and Public Enterprises
DMD Debt Management Department DSA Debt Sustainability Analysis
DX Domestic currency denominated debt EAC East African Community
ECF Extended Credit Facility
EEC European Economic Community EIB European Investment Bank EMBI Emerging Markets Bond Index
ePROMIS Electronic Projects Monitoring Information System ESF Exogenous Shock Facility
ERD External Resources Department FDI Foreign Direct Investment
FLSTAP Financial and Legal Sector Technical Assistance Project
FY Financial Year
GDP Gross Domestic Product
IDA International Development Association IFB Infrastructure Bond
IFC International Finance Corporation IMF International Monetary Fund IPO Initial Public Offer
ISB International Sovereign Bond Ksh Kenya Shilling
LIC Low Income Country
MEFMI Macroeconomic and Financial Management Institute of Eastern and Southern Africa
MoF Ministry of Finance
MTDS Medium Term Debt Strategy PV Net Present Value
PV Present Value
NSE Nairobi Securities Exchange NSSF National Social Security Fund PFM Public Financial Management
PFMR Public Financial Management Reforms PPP Public Private Partnerships
SDR Special Drawing Rights SOE State Owned Enterprise US United States
EXECUTIVE SUMMARY
The key drivers for the 2011 MTDS were a desire to minimize overall cost by issuing medium term debt to reduce cost associated with longer dated securities and to further develop and deepen the domestic debt market. Consequently, 2012 MTDS envisages a less uptake of domestic debt than in previous years to meet the Central Government budget-financing requirement.
The Government also highlighted the need to minimize the degree of foreign exchange rate risk exposure associated with the external debt portfolio by borrowing more concessional debt, while maintaining a limited window for borrowing on commercial terms to minimize costs and refinancing risks. The 2012 MTDS emphasizes that financing on non-concessional terms will be highly restricted to projects with high expected risk-adjusted rates of return including critical infrastructure that would otherwise not be undertaken due to lack of concessional financing.
The 2011 MTDS reaffirmed Government’s commitment in realizing its objectives in the domestic debt market. In the first half of 2011/12, the domestic debt market was characterized by high interest rates, under-subscription of government securities offered at the auctions and near absence of secondary trading of Treasury Bonds. As at December 2011, out of the targeted domestic borrowing of Ksh. 87 billion, only Ksh. 12 billion (14 percent) had been realized.
Despite the slight deviation in the level of domestic borrowing, the thrust of the 2011 MTDS remained unchanged and significant improvement in the level of refinancing risk was observed in the domestic debt portfolio. The average time to maturity increased from 5.9 years to 6.0 years and the proportion of domestic debt to be refinanced within 12 months fell from 18 percent as of end June 2011 to 17 percent as of end June 2012.
Although 2011 MTDS successfully achieved a reduction in refinancing risk, managing this risk remains a priority for the 2012 MTDS. Active debt management operations to smooth the refinancing profile, along
with efforts to maintain a wider investor base have been instrumental in mitigating potential fiscal shocks, such as, impact of drought on food security, realization of contingent liabilities, or shortfall in revenues, the country continues to face.
The rapid growth of domestic debt and sharp rise in interest rates on government securities poses major risk on debt sustainability. To mitigate these risks. There is need to explore the possibility of a switch from domestic to external debt. However, there is also a concern that a sudden and aggressive shift from domestic debt could risk reversing some of the gains that previous debt strategies have achieved in terms of market deepening. In addition, while increasing the exposure to exchange rate risk would have a relatively limited budgetary impact in the short-term; it would aggravate the risk that the main fiscal anchor, the PV of Debt/GDP would exceed the ceiling of 40 percent in the event of shocks. This risk is real given the steep depreciation of the shilling witnessed in 2011 when the Shilling weakened to exchange at a historic low of Ksh 107 per USD in mid-October 2011.
With regard to external borrowing, the Government prefers concessional external financing while maintaining a limited window for borrowing on commercial terms to minimize costs and refinancing risks. Financing on non-concessional terms will be on exceptional basis and will be biased towards projects with high-expected risk-adjusted rates of return including critical infrastructure that would otherwise not be undertaken due to lack of concessional financing. However, the US$ 600 million syndicated facility was accommodated within the ECF window to substitute for domestic borrowing. A cautious approach will be adopted in the issuance of Government loan guarantees to minimize the level of contingent liabilities.
Given those issues, the Government evaluated the performance of four alternative strategies relative to 2011 MTDS (“S1”). These included a strategy envisaging an aggressive switch to external official sector borrowing, accompanied by lengthening of maturities in the domestic market (“S2”). Apriori, this strategy was expected to have very attractive cost and risk characteristics. However, given the potential challenges in achieving the target level of external borrowing, 3 alternative strategies
were also considered - two envisaging relatively more domestic debt (“S3” with a continued bias toward medium-term debt and “S4” with a bias away from short term debt to longer term debt) and a strategy that proposes access to the international capital markets to substitute for any shortfall in official sector borrowing (“S5”).
In selecting the optimal strategy, the Government considered two key indicators – ratio of interest payments to GDP (Interest/GDP) and ratio of PV of Debt to GDP (PV of Debt/GDP). As anticipated, “S2” outperforms all other strategies, while “S1” outperforms “S3”, “S4” and “S5”. The refinancing risk was higher under “S4”. The strategy could not accommodate significant amounts of long-term domestic debt, thus the potential risk of losing the retail investor base. In terms of Interest/GDP, “S5” entails a higher cost but lower risk than “S3”. This reflects the relatively longer-tenor of debt involved. However, once PV of Debt/GDP is considered, “S5” becomes less attractive, and aggravates the risk of breaching the 40 percent ceiling. This strategy exposes the portfolio to relatively high exchange rate and refinancing risks. Whereas these risks could be mitigated by use of a sinking fund, this approach has cost implications.
The 2012 MTDS presents “S2” as the optimal strategy after taking into account both cost and risk considerations, the need to develop the domestic debt markets and the feasibility of implementing the strategy over the medium term. The strategy comprises of the following actions:
65% net domestic borrowing and 35% net external borrowing to finance the central government budget;
Domestic borrowing will be on medium term. Indeed, the 2012 MTDS considered the macro-economic and domestic market environment and recommends a shift in the composition of debt towards medium term domestic debt over the medium term.
External borrowing will comprise of 26% on concessional terms,4% on semi concessional terms while 5% will be contracted on commercial terms;
Issuance of the Euro Bond remains an option during the yeardepending on developments in the international markets. Proceeds may be used to retire the 2-year syndicated external commercial loan contracted during the financial year 2011/12.
The Government is committed to maintain debt within sustainable levels. Under the current three-year Extended Credit Facility (ECF) arrangement with the International Monetary Fund (IMF), the Government intends to raise real GDP to 7 percent, lower the public debt to GDP ratio to below 45 percent and maintain inflation at 5 percent over the medium term.
Consistent with the principles of public finance in the Constitution of Kenya, 2010, the Government will seek to widen outreach of the 2012 MTDS. A domestic borrowing plan anchored on government cash flow requirements will be developed for implementation, monitoring and evaluation. The Government will also actively monitor the key macroeconomic indicators and interest rates against those assumed in the analysis. Any significant and sustained change will trigger the need for revision of the strategy. The underlying cost-risk analysis also identifies a range of risk indicators consistent with the adopted strategy. These provide a set of strategic targets against which the portfolio will be assessed on a regular basis to ensure the strategy remains on track.
Availability of comprehensive and accurate information on a regular basis is critical in managing investors’ sovereign risk assessment and the cost of debt. The Government will seek to publish public debt information on a regular basis to enhance transparency on debt management in accordance with best international practice.
The Government will continue to strengthen capacity in public debt management. The debt recording system will be upgraded, additional skilled staff posted to DMD while training in debt management techniques scaled up.
I. GENERAL OBJECTIVE OF DEBT MANAGEMENT IN KENYA
1. The principal objective of Government debt management is to meet the Central Government financing requirements at the least cost with a prudent degree of risk. The secondary objective is to facilitate Government’s access to financial markets and support development of a well functioning vibrant domestic debt market.
2. In June 2011, Ministry of Finance (MoF) through the Debt Management Department (DMD) prepared and published a formal debt management strategy, the 2011 MTDS which outlined the Government Medium Term Debt Strategy for the period FY2011/12-FY2013/14. The 2011 MTDS was the Government’s third formal and explicit strategy and was an important step towards enhancing transparency of the Government’s debt management decisions. The MTDS is updated annually and presented to Parliament as part of the Budget Documents by the Minister for Finance. 3. The 2011 MTDS guided the Government debt management operations in the FY2011/12. The strategy sought to balance cost and risk of public debt while taking into account Central Government financing needs. In addition, the strategy incorporated initiatives to develop the domestic debt market, seek new funding sources, support macroeconomic stability and achieve debt sustainability.
4. To institutionalize the production of the debt strategy, the publication of the MTDS has been provided for under the Public Financial Management Bill, 2011.
II. OVERVIEW OF 2011 MTDS
a) Rationale for 2011 MTDS
5. The 2011 MTDS recommended a gradual shift in the composition of debt towards more external debt and less uptake of domestic debt over the medium term to minimize both cost and risk in the debt portfolio. The relevant considerations that influenced the 2011 MTDS were based on the need to reduce refinancing risk exposure in the domestic debt, while containing the cost of debt.
b) Description of Strategy
6. The strategy presented in the 2011 MTDS recommended to finance the budget deficit of 7.5 percent of GDP was as follows: 30 percent by way of net external borrowing, mainly concessional while allowing for a limited window for non-concessional borrowing, and 70 percent net domestic borrowing.
7. In the strategy, concessional external borrowing was limited to loans with a minimum grant element of 35 percent. Proceeds from non-concessional loans would be limited to critical projects with high expected risk-adjusted rates of return, preferably infrastructure projects that otherwise would not be undertaken due to lack of concessional financing.
8. Domestic borrowing strategy sought to lengthen the maturity profile of domestic debt portfolio to reflect a ratio of 30:70 in the form of Treasury Bills to Treasury Bonds. While Treasury Bond issues were limited to Benchmark Bonds with maturities of 2, 5, 10, 15 and 20 years in order to build liquidity around them to accelerate domestic debt market deepening and achieve stability, issuance was to concentrate more on the 5 and 10 year maturities to reduce cost associated with longer dated securities.
9. The 2011 MTDS also envisaged no issuance of euro-bond during the financial year 2011/12.
10. In summary, the budget deficit was to be financed through both net external financing amounting of 3.7 percent of GDP and net domestic financing of 3.8 percent of GDP.
III. KEY DEVELOPMENTS SINCE THE 2011 MTDS
a) Development in the Domestic Debt Market
11. The government has continued to pursue the twin objectives of developing a deep and liquid domestic market since the development of the first MTDS in June 2009. The development of the 2011 MTDS, reaffirmed the government’s commitment in realizing its objective of deepening the domestic debt market. In the first half of 2011/12, the domestic market was characterized by rising inflation and high interest rates that led to revenue shortfalls and constrained domestic borrowing. As at December 2011, out of the targeted domestic borrowing of Ksh. 87 billion, only Ksh. 12 billion (14 percent of the total) had been realized. The volatility in the domestic debt market was characterized by under-subscription of Treasury bills and Treasury Bonds and sharp rises in interest rates. In addition, the Shilling weakened to exchange at a historic low of Ksh 107 per USD in mid-October 2011 compared to an average of Ksh. 80 per USD in October 2010 while inflationary pressures were evident.
12. Arising from these challenges, issuance of Government securities was concentrated on the short end, mainly Treasury Bills and 1 and 2 year Treasury Bonds. The poor performance for longer dated maturities was demonstrated by the dismal performance of the Infrastructure Bond which, despite having a Diaspora component, remained on tap for five months, October, 2011 to February, 2012.
13. In response to these challenges, the government revised downward its net domestic borrowing requirement from Kshs 119.5 billion (3.8 percent of GDP) to Kshs 92.7 billion (2.8 percent of GDP) and considered externalizing the balance through the proposed $600 million syndicated loan facility.
14. The Government enhanced its outreach in the dissemination of a formal debt management strategy. For instance, the 2011 MTDS was posted at the Ministry of Finance website and circulated to the various key institutions in the public and private sectors. Issues ranging from the amount to be borrowed, preferred terms of new borrowing and the effects on the country’s debt sustainability status are clearly brought out as a way of ensuring transparency and credibility of the information presented.
b) External Financing
15. The Government policy on external borrowing is to be analyzed in light of the ever-changing domestic and international macroeconomic conditions. In the 2011 MTDS, the Government’s preference for the concessional external financing and
provision of a limited window for borrowing on commercial terms to minimize costs and refinancing risks was informed by rising inflation in the domestic market, which led to the sharp depreciation of the local currency resulting to high external debt servicing. Financing on non-concessional terms continues to be restricted to projects with high-expected risk-adjusted rates of return including critical infrastructure that would otherwise not be undertaken due to lack of concessional financing.
16. To support Government’s economic and financial reforms, Kenya entered into a three-year Extended Credit Facility (ECF) arrangement with the International Monetary Fund (IMF). The program aims at boosting the level of official foreign exchange reserves while supporting efforts for a gradual fiscal adjustment over a three-year horizon. The government intention under this ECF program is: i) to raise real GDP to 7 percent; ii) bring the public debt to GDP ratio to below 45 percent over the medium term; and iii) keep inflation at 5 percent while maintaining a floating rate regime.
17. Performance of external financing, on a net basis, has been below target. The Government has seen new external commitments entered on relatively harder terms, that is, closer to the 35 percent Grant Element threshold for ‘soft’ loans. However, the Government position to negotiate better terms with external financiers improved following the ECF arrangement with the IMF.
18. The Government had also been considering the possibility of accessing the international capital markets. In this context, the 2011 MTDS proved useful in providing a very clear basis for engagement. The potential for a Euro Bond to act as a benchmark for the corporate sector for such access is a major consideration, in addition to the domestic market, which has proven that it is an effective source for providing longer-dated funds for investment through corporate IFBs.
19. A 2 year commercial banks syndicated loan facility of up to Ksh 52 billion (about USD 600 million equivalent) was negotiated as an alternative source of financing the budget following the low uptake of Government securities by investors. It is expected that the foreign currency inflows associated with the proposed borrowing will ease pressure on domestic interest rates, add to the official foreign exchange reserves position and reduce pressure on the Kenya shilling exchange rate. The Government plans to issue a Euro Bond to retire the loan.
c) Guarantees
20. The energy sector has been the primary driver for the rise in contingent liabilities in form of government guarantees. The government, in collaboration with its development partners has increased its efforts towards promotion of Public Private Partnership arrangements (PPP) in the energy sector and encouraged use of non-state guarantees from multilateral agencies like MIGA to minimize the level of explicit guarantees to maintain public debt within sustainable levels.
21. The demand for explicit guarantees is likely to increase in the medium term as the country embarks on implementing devolved system of governance under the Constitution of Kenya, 2010. However, it is expected that county governments will exercise fiscal restraint in the management of county budgets.
22. The Public Financial Management Bill, 2012 proposes to establish the National Debt Management Office at the National Treasury with the primary responsibility of managing public debt operations. It is envisaged that this department will be adequately staffed, equipped and supported with new IT systems to efficiently execute its mandate. In the meantime, notable progress has been achieved in public debt reform area over the past year. Specifically, the implementation of the electronic Project Monitoring Information System (ePROMIS) by the External Resources Department (ERD) of the Ministry of Finance, the continued upgrade of the Commonwealth Secretariat Debt Recording Management System (CS-DRMS) will greatly assist in enhancing the quality and timeliness of information flow on public debt. A process to establish the level of contingent liabilities, as well as a World Bank funded management mechanism under the Public Private Partnership framework is ongoing under the Department of Government Investment and Public Enterprises (DGIPE).
d) Implementation and Impact of 2011 MTDS
23. The Government implemented the 2011 MTDS domestic borrowing plan by issuing Treasury Bills and Treasury Bonds. Due to the low uptake of government securities, domestic debt financing of the budget deficit was revised to 1.9 percent of GDP from the planned 3.8 percent of GDP as shown in Table 1(a).
24. By end June 2012, the provisional share of foreign to domestic debt is projected at 48 percent, compared to 51 percent the previous year. In addition, the refinancing risk associated with short-term domestic debt has fallen with the average time to maturity at 6.0years from 5.9 years in June 2011 as indicated in Table 1(b).
25. Government’s decision to substitute domestic borrowing by way of a USD 600 million (Ksh 52 billion) syndicated external loan, combined with austerity measures resulted in net external financing falling to 3.0 percent of GDP from the planned 3.7 percent of GDP as shown in Table 1(a).
26. Whereas, there was low uptake of domestic borrowing, it is projected that interest payments on domestic debt will increase on account of sharp rise in interest rates in the domestic debt market particularly in the first half of the financial year 2011/12. In addition, the shift in the portfolio mix in favour of external debt increased the overall debt portfolio exposure to exchange rate risk (risk-cost trade off).
27. Tables 1(a) and 1(b) summarize the outcome and impact of implementing the 2011 MTDS.
Table 1(a): Impact of implementing the 2011 MTDS
Source: Ministry of Finance and IMF/WB estimates
Table 1(b): Characteristics of the Debt Portfolio
Source: Ministry of Finance and IMF/WB estimates
MTDS 2011
Target Projected outturn Target Projected outturn
Total net borrowing (Ksh bns)* 237 160 7.5% 4.9%
Domestic (net) 120 62 3.8% 1.9%
External (net) 117 98 3.7% 3.0%
* Note these targets are equivalent to a gross borrowing target of 70% for domestic and 30% for external debt. Net borrowing (Kshbn) FY 2010/11 Net borrowing (% of GDP)FY 2010/11 FY10/11 FY11/12* Portfolio composition Domestic 51% 48% External 49% 52% Refinancing risk
Average time to maturity total debt (years) 8.4 8.3
Average time to maturity domestic debt (years) 5.9 6.0
% of domestic debt falling due within 12 months 18% 17%
Cost
Average interest rate** 5.2% 5.8%
* Projected portfolio as of end-June 2012 ** Provisional
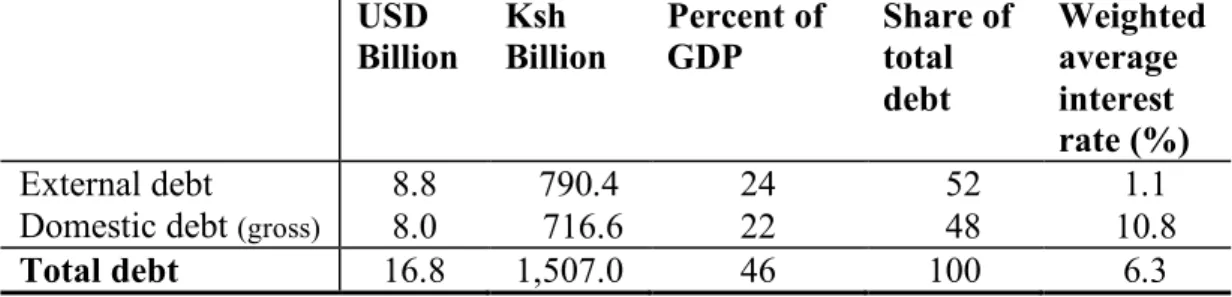
IV. CHARACTERISTICS OF THE EXISTING DEBT PORTFOLIO 28. The stock of public debt is projected at Ksh 1,507 billion or 46 percent of GDP in nominal terms as at end June 2012. In addition, the structure of the debt portfolio is projected to change to 52 percent external debt and 48 percent domestic debt from 49 and 51 percent, respectively (Table 2(a), 2(b) and Figure 1, Chart 1). The change in the debt portfolio is consistent with the 2011 MTDS. Overall, while the short-term budgetary impact of any exchange rate shock may be minimal given the nature of external debt (mainly concessional and amortizing), the main fiscal anchor - the PV of Debt/GDP - remains vulnerable to exchange rate movements.
Table 2(a): External and Domestic Debt, End June 2011
USD Billion Ksh Billion Percent of GDP Share of total debt Weighted average interest rate (%) External debt 8.0 722.9 26 49 1.0 Domestic debt (gross) 8.5 764.2 28 51 9.2
Total debt 16.5 1,487.1 54 100 5.2
Source: Ministry of Finance and IMF/WB estimates
Table 2(b): Projected External and Domestic Debt, June 2012 USD Billion Ksh Billion Percent of GDP Share of total debt Weighted average interest rate (%) External debt 8.8 790.4 24 52 1.1
Domestic debt (gross) 8.0 716.6 22 48 10.8
Total debt 16.8 1,507.0 46 100 6.3
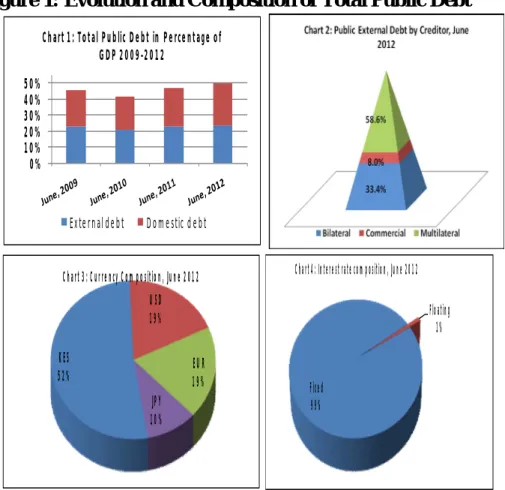
Figure 1: Evolution and Composition of Total Public Debt 0% 10% 20% 30% 40% 50%
Chart 1: Total Public Debt in Percentage of GDP 2009-2012
External debt Domestic debt
KES 52% USD 19% EUR 19% JPY 10% Chart 3: Currency Composition, June 2012
Fixed 99%
Floating 1% Chart 4: Interest rate composition, June 2012
Source: Ministry of Finance and Central Bank of Kenya
Figure 2: Total Debt Repayment Profile, End-June 2012 (Ksh billion)
29. The main external sources of financing are multilateral and bilateral creditors. Multilateral concessional debt amounts to 59 percent of total external debt while bilateral creditors account for 33 percent. Commercial debt, which includes a medium term syndicated loan, represents 8 percent of total public external debt (Figure 1, Chart 2). 30. The currency composition of external debt is also relatively unchanged. The largest share of foreign debt remains denominated in Euro and USD (19 percent of total debt each), with the Japanese Yen accounting for 10 percent (Figure 1, Chart 3). Kenya Shilling denominated debt accounts for 52 percent of total debt.
31. The interest rate composition of total debt also remains relatively unchanged with 99 percent of the debt being on fixed interest rates (Figure 1, Chart 4).
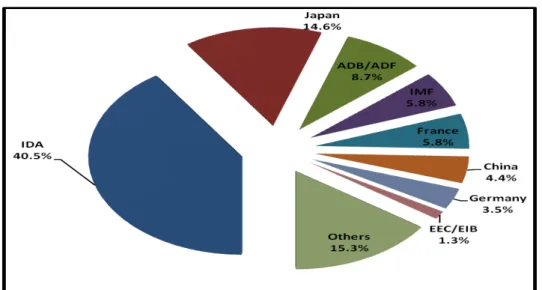
32. IDA, ADB/ADF and EEC/EIB are the main multilateral creditors as shown in Figure 3, accounting for 86 percent of outstanding multilateral debt as at end June 2012. IDA is the single biggest source of external resources, accounting for 69 percent of outstanding multilateral debt. In terms of bilateral creditors, Japan, France, China and Germany are the main creditors accounting for 79 percent of bilateral debt. Japan is the largest bilateral donor, accounting for 44 percent of bilateral debt.
Figure 3: External Debt by Major Creditors, End June 2012
Source: Ministry of Finance
33. Table 3 highlights the average cost characteristics of new external commitments. The guidelines on external borrowing require that new
loans should have a Grant Element of at least 35 percent. Table 3 demonstrates the hardening of terms for new external commitments in 2012, occasioned by borrowing on terms very close to the 35 percent minimum concessionality particularly for the energy sector, as well as the market determined terms on the USD 600 million, 2 year syndicated commercial loan (LIBOR + 4.75 percent p.a., plus an arrangement fee of 2.8 percent).
Table 3: Average Terms for New External Loans
Terms June 2011 June 2012*
Interest rate (%) 0.8 1.8
Maturity (Years) 26.6 23.1
Grace period (Years) 8.1 7.1
Grant Element (%) 69.8 60.6
*Provisional
Source: Ministry of Finance
34. Refinancing risk in the debt portfolio remains significant but within tolerable limits. The Average Time to Maturity (ATM) of the total debt portfolio is 8.3 years down from 8.4 years at end June 2011, with that of the domestic debt portfolio at 6.0 years up from 5.9 years (Table 4). The average maturity profile for external debt has declined to 11.3 years from 11.7 years, consistent with the hardening of terms on new external commitments. A close examination of the repayment profile indicate significant level of both refinancing and rollover risk with 17 percent of the domestic debt stock maturing in the next 12 months.
Table 4: Cost and Risk Considerations of Debt Portfolio, End June 2012
Characteristics of Existing Portfolio Ex ante Risks Ex ante
Cost Currency composition
(FX = 48%; DX=52%)
External, mostly concessional Exchange rate risk Low
Domestic No exchange rate risk High
Maturity profile (ATM = 8.3 years)
External, mostly concessional
(ATM =11.3 years) Low refinancing risk Low
Domestic (ATM = 6.0 years)
Interest rate composition
(Fix=99%; Float=1%)
Medium refinancing risk Low interest rate risk
High
Source: Ministry of Finance and Central Bank of Kenya
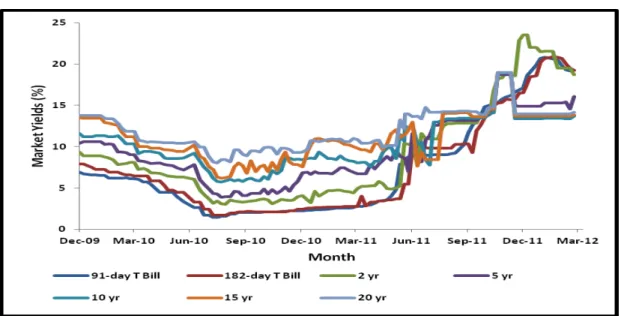
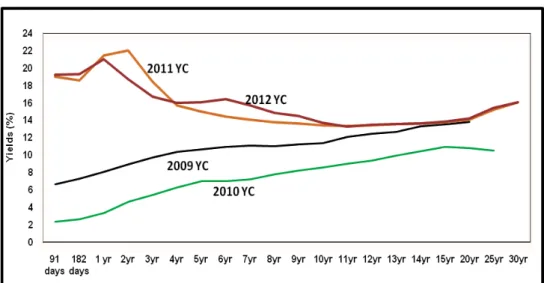
35. The average interest rates on Government securities (91, 182 and 364 day Treasury Bills and Benchmark Treasury Bonds) increased significantly in the first half of the financial year (Figure 4) leading to a shift in the yield curve (Figure 5), but the trend reversed during the second half of the year.
Figure 4: Trend in Domestic Interest Rates in 2011/12
Figure 5: Evolution of the Yield Curve
Source: Central Bank of Kenya
36. Going forward, the composition of the debt portfolio suggests
that reducing refinancing risk should remain a priority for the
MTDS. In addition, although the extent of exchange rate risk is partially
mitigated by the currency composition of external debt, given the sensitivity of the PV of Debt/GDP to exchange rate shocks, this suggests that the overall proportion of external debt should be carefully monitored. In particular, the assessment of the likely impact, and consequently, the relative importance of reducing exchange rate exposure, would change if the nature of external borrowing were to change (for example, if new debt was contracted on a bullet basis with shorter maturities, as is the case with the USD 600 million, 2-year bullet payment syndicated commercial external loan).
V. 2012 MTDS: KEY ASSUMPTIONS
a) Objectives and Scope
37. In the 2012 MTDS, the Government will continue pursuing the same broad objectives of funding the Central Government Budget while maintaing a prudent level of risk taking account of costs. This will be achieved through the diversification of external sources of financing and further lengthening the average time to maturity of the domestic debt portfolio.
38. The scope of the analysis of 2012 MTDS is based on the combined Central Government debt and publicly guaranteed debt serviced by the Government. Guaranteed debt currently serviced by the Government amounts to USD 100.1 million or 1.1 percent of total public and publicly guaranteed (PPG) external debt.1
b) Macroeconomic Environment and Risks
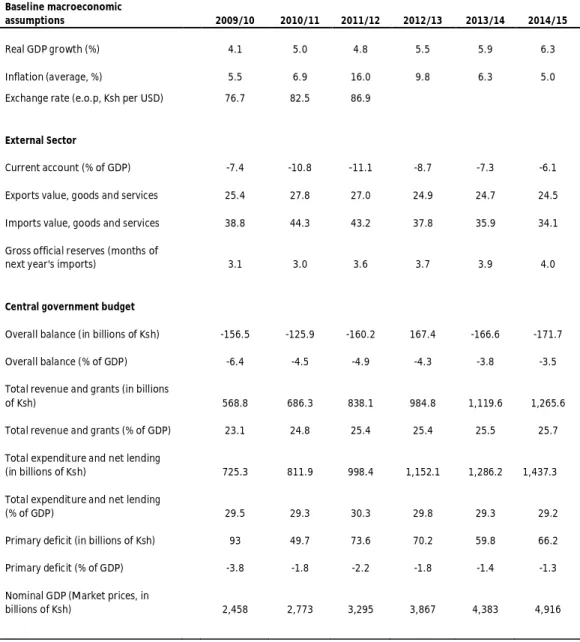
39. The macroeconomic framework underpinning the MTDS is consistent with projections included in the 2012/13 Budget Policy Statement (2012 BPS). The medium term outlook for FY2012/13-FY2014/15 assumes a real GDP growth to increase from 4.8 percent in FY2011/12 to 6.3 percent in FY2014/15 and the overall budget deficit to decline from 4.9 percent of GDP in FY2011/12 to 3.5 percent of GDP in FY2014/15. Inflation is expected to to decline from 16.0 percent in FY2011/12 to 5.0 percent in FY2014/15, and the exchange rates to remain stable. The current account deficit is expected to decline gradually from about 11.1 percent of GDP in 2011/12 to 6.1 percent of GDP in 2014/15. The relatively higher interest rates and investor confidence with expected successful General Elections will support both the capital and financial account. Gross international reserves are assumed to reach the East African Community (EAC) target of 4 months of imports by FY2014/15 (Table 5). The risk to the medium-term outlook include further weakening in global economic growth, unfavorable weather conditions and rise in international oil prices.
Table 5: Baseline Macroeconomic Assumptions Baseline macroeconomic
assumptions 2009/10 2010/11 2011/12 2012/13 2013/14 2014/15
Real GDP growth (%) 4.1 5.0 4.8 5.5 5.9 6.3
Inflation (average, %) 5.5 6.9 16.0 9.8 6.3 5.0
Exchange rate (e.o.p, Ksh per USD) 76.7 82.5 86.9
External Sector
Current account (% of GDP) -7.4 -10.8 -11.1 -8.7 -7.3 -6.1 Exports value, goods and services 25.4 27.8 27.0 24.9 24.7 24.5 Imports value, goods and services 38.8 44.3 43.2 37.8 35.9 34.1 Gross official reserves (months of
next year's imports) 3.1 3.0 3.6 3.7 3.9 4.0
Central government budget
Overall balance (in billions of Ksh) -156.5 -125.9 -160.2 167.4 -166.6 -171.7 Overall balance (% of GDP) -6.4 -4.5 -4.9 -4.3 -3.8 -3.5 Total revenue and grants (in billions
of Ksh) 568.8 686.3 838.1 984.8 1,119.6 1,265.6
Total revenue and grants (% of GDP) 23.1 24.8 25.4 25.4 25.5 25.7 Total expenditure and net lending
(in billions of Ksh) 725.3 811.9 998.4 1,152.1 1,286.2 1,437.3 Total expenditure and net lending
(% of GDP) 29.5 29.3 30.3 29.8 29.3 29.2
Primary deficit (in billions of Ksh) 93 49.7 73.6 70.2 59.8 66.2 Primary deficit (% of GDP) -3.8 -1.8 -2.2 -1.8 -1.4 -1.3 Nominal GDP (Market prices, in
billions of Ksh) 2,458 2,773 3,295 3,867 4,383 4,916
Source: Ministry of Finance
40. Debt financing needs are determined by the primary deficit,
interest costs and principal payments/redemptions. Under the baseline macroeconomic assumptions, the primary deficit is expected to drop from Ksh 73.6 billion in FY2011/12 to Ksh 70.2 billion in FY2012/13
and decrease further to Ksh 66.2 billion by FY2014/15. The 2012 MTDS
guides on the optimal borrowing mix to close the resource gap in the budget.
41. The macroeconomic outlook carries substantial uncertainty. In
Sustainbility Analyis (DSA) highlights the sensitivity of Kenya’s debt sustainability to shocks in economic growth. Lower growth will negatively affect the primary deficit through both lower revenue collection and increased outlays to protect the most vulnerable. Overall, growth will depend on the pace of global economic growth, drought and international fuel prices that impact negatively on revenues and hike expenditure demands.
42. Increased investment in infrastructure might require an increase in the level of guarantees while the implementation of the new Constitution may need the Government to take over liabilities of counties. This increase in contingent liabilities would represent a significant increase in risk to the current debt burden.2 The expected approval of a Bill to regulate PPPs as well as the envisaged implementation of a superannuation pension scheme for the civil service from July 2012 will also have implications for Government’s contingent liabilities in the future.
43. Overall, the risk profile on the existing debt portfolio has not changed since June 2011. Thus, the thrust of the 2012 MTDS is similar to 2011 MTDS: - to maintain a diversified source of financiers, prudently manage the debt amortization profile to absorbed fiscal shocks (for example, the impact of drought on the budget), and manage the external exposure of the portfolio taking into account the vulnerability to balance of payments shocks.
44. The principal risks to the baseline are summarised below in Table 6.
2 A survey of contingent liabilities in SOEs was started in 2008 but has not yet been completed.
Additionally, a Taskforce is expected to be set up to establish the extent of contingent liabilities under a devolved government system, while payments under the Public Service Superannuation Scheme (PSSS) are treated as contingent liabilities. GOK indemnity (USD 45 million or Ksh 3.7 billion) to IDA for guarantee to Kenya Railways has also been recorded as a contingent liability.
Table 6: Macro-Risks and Implications for Debt Management Strategy
Implications for Debt Strategy Preferences Macroeconomic Factors Impact
Target
source Currency Other comments Balance of Payment Risks
Terms of trade shock Exchange rate Domestic DX Improve market capacity
FDI/Private capital flow volatility Exchange rate Domestic DX Improve market capacity
Remittance dependence Exchange rate Domestic DX Improve market capacity
Tourism receipts dependence Exchange rate Domestic DX Improve market capacity
Low foreign exchange reserves Exchange rate FX Diversify trading partners
Fiscal Risks
Potential volatility (revenues) Expenditure volatility Market DX/FX Create fiscal space, prioritize expenditure and improve efficiency
Capital spending aid dependent Growth volatility DX/FX Improve relationship with donors,
improve absorptive capacity and implementation efficiency
Contingent liabilities Debt level increase Market DX/FX Create fiscal space and strengthen
overall PFM framework
Monetary Risks
High inflation Impede market
development, higher interest costs
Negative real interest rate Impact real money investors and deposit growth
Increase credibility of monetary policy, improve monetary operational framework and monetary transmission mechanism to reduce inflation premium
Natural Disasters
Natural Disasters Growth volatility Market DX/FX Diversify economy and explore the
possibility of commodity hedge
c) Potential Financing Sources
45. Official sources remain the preferred option for the Government to source external financing on concessional terms. It has been observed that borrowing terms have increasingly hardened , with new loans often contracted on terms very close to the 35 percent Grant Element threshold for ‘soft’ loans. Under the current ECF arrangement supported by the IMF, the Government is expected to access better terms from both multi - and bilateral creditors.
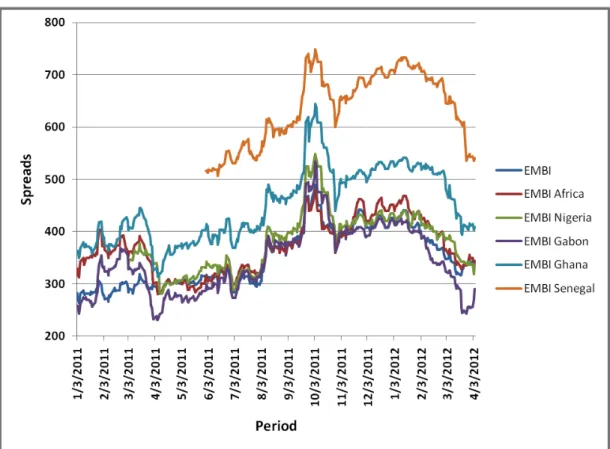
46. The Government may consider issuing a Euro Bond in the medium term given the narrowing of spreads for emerging markets sovereign bonds (see Figure 6)3. The 2012 MTDS takes into account this
3 Senegal, considered Kenya’s peer issued a USD 500 million sovereign bond in May 2011 at 8.75
percent p.a. However, the recent margin of 4.75 percent p.a. above LIBOR for the2 year syndicated loan for Kenya suggests a sovereign bond may be priced lower than the current peer levels.
financing option with timing of Euro Bond placement preferable after the General Elections. The size of non-concessional borrowing including guarantees is set at a maximum USD 1,300 million for the year 2012/13. This amount is consistent with ceiling set under the current IMF supported ECF economic and financial program to safeguard debt sustainability levels.
Figure 6: Performance of Peer Debut Sovereign Bond Issues
Source: Ministry of Finance and IMF/WB estimates
47. On domestic borrowing, the Government will seek to issue medium to long term debt securities to lengthen the maturity structure of debt, and thus reducing the underlying refinancing risk. The issuance program will be biased towards Benchmark Bonds. The effort to shift towards longer dated instruments supports development of the yield curve for government debt securities and the overall growth of domestic debt market.
48. The uptake of domestic debt will be reduced to cut-back on rises in interest costs and the rapid growth of the debt stock. This action is consistent with the strategy to shift the portfolio towards external debt
dominance and also to safeguard debt sustainability over the medium term.
d) Future Financing and Pricing Assumptions
External sources
49. The following pricing assumptions underlie the 2012 MTDS.
Concessional external loans are priced at a fixed rate of 0.75percent, with a 40-year tenor and a 10-year grace period. These loans are assumed to be denominated in SDR.
Semi-concessional loans are assumed to be contracted from official creditors or export credit agencies. These loans have a fixed interest rate of 2.5 percent, a maturity of 20 years including a 5-year grace period.4 These loans are denominated in Euros and USD.5
In the absence of concessional financing, the Government will maintain non-concessional financing including guarantees at USD 1,300 million for the year 2012/13 for investment projects that demonstrate revenue streams and high social returns in accordance with the ECF arrangement. These loans have market-based terms and are denominated in Euros and USD.6
Accessing the international capital market is priced-off the assumed effective yield curve, which is based on the underlying forward US Treasury curves plus an assumed credit spread. The analysis assumes that international capital markets could be accessed to retire the syndicated commercial loan, or if concessional resources fall below target. Alternatively, domestic borrowing could increase. The international sovereign bond
4 These terms are consistent with loans that have been contracted in the last two years from bilateral
sources.
5 A review of instruments indicated that it would be useful to include a semi-concessional fixed rate
loan - with terms consistent with those secured on recent bilateral external debt - to the choices available in the analysis. There have been no new floating rate loans contracted since 2003 and overall, these instruments represent a marginal share of the portfolio. Consequently, losing this instrument should not significantly affect the analysis.
would have a maturity of 10 years, with a bullet repayment. The credit spread is set at 400 basis points. A 5-year bond is expected to have a spread of 350 basis points 7.
50. The net external borrowing for financial year 2012/13 is 1.6 percent of GDP and expected to rise to 2.0 percent of GDP in the financial year 2014/15.
Domestic market sources
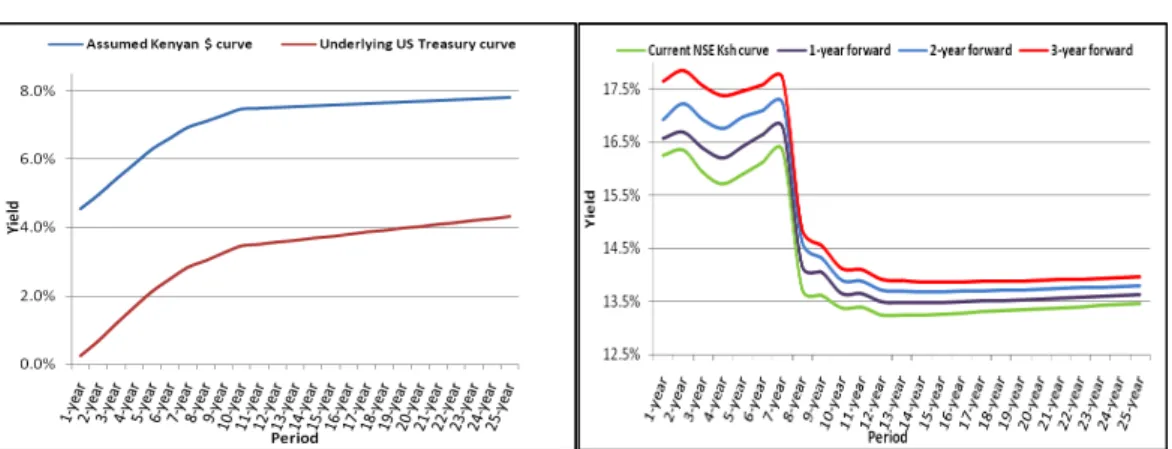
51. The pricing of new domestic borrowing is based on the underlying forward US Treasury curves. The assumed credit premium is taken into account, and the anticipated inflation differential is used to adjust for exchange rate differentials. This is then adjusted for an additional risk premium, which can be assumed to capture liquidity, inflation risk, and other risk effects. This premium is identified by determining the necessary premium required to fit today’s observed yield curve.8 The applicable Ksh curves are shown in Figure 7.
Figure 7: Assumed USD and Ksh Yield Curves
Source: Ministry of Finance and IMF/WB estimates
52. Domestic borrowing will be through issuance of Treasury Bills and Treasury Bonds at the ratio of 30:70. This will ensure that the maturity structure of the existing portfolio is lengthened to minimize refinancing risk.
7 These spreads compare with the current peer issuers’ secondary market trading spreads and spreads
on recent first issuance for bonds of 10- and 5-years maturity.
53. In addition, Treasury Bonds will be issued around Benchmark Bonds of 2, 5, 10, 15 and 20-year tenors to build liquidity.
54. Net domestic borrowing for financial year 2012/13 is 2.8 percent
of GDP and is expected to fall to 1.5 percent of GDP in the financial year 2014/15.
e) Description of Stress Scenarios
55. The robustness of each alternative strategy is assessed on the basis of the baseline scenario for interest and exchange rates. While a number of standard shocks are generally applied in the context of the DSA, it is important to also consider what might constitute a typical shock in the Kenya-specific context. To determine the appropriate size of these shocks, the historical performance of the relevant exchange and short-term interest rates in the relevant markets was considered. In particular, the size of the interest rate shock to be applied to the Kenya shilling interest rates was determined on the basis of the past 10 years, which includes periods when interest rates declined (and increased) sharply. Consequently, the implied annual deviation of interest rates is quite large at over 2 percent9. For the purposes of the analysis, it is assumed that
shocks materialize in FY2012/13, and are sustained through the remainder of the simulation horizon10:
Scenario 1: Upward shift of the Ksh yield curve. The cost of borrowing at all tenors increases by two standard deviations (equivalent to a 4.5 percent interest rate increase) calculated on the basis of the historical change in the interest rates on Treasury Bills.
Scenario 2: Flattening of the Ksh yield curve. This scenario corresponds to the impact of a switch in the monetary policy stance, which would increase short-term rates, but where the
9 However, it appears that there were no particular structural factors that would argue for excluding
that particular period from the analysis.
10 Basically, this presumes that the baseline macroeconomic outlook and financing assumptions are
highly uncertain. A more specific risk scenario could be considered on the basis of known future events, such as an election. The quantification of the shocks reflects the historical standard deviation over the last 10 years, except for Scenario 3 where an extreme shock to the nominal exchange rate is simulated.
market’s longer-term expectations remain unchanged (that is, inflation expectations remains anchored to the 5 percent target). In this scenario, the interest rate of the 364-day Treasury Bill increases by two standard deviations, as in Scenario 1, but interest rates on long-term bonds increase proportionally less, with the interest rate of the bond with the longest maturity (30 years) unchanged from the baseline scenario.
Scenario 3: Extreme depreciation of the Ksh. The Ksh depreciates by 30 percent vis-à-vis the other currencies in FY 2012/13.
Scenario 4: Country-specific depreciation of the Ksh. The Ksh depreciates by two standard deviations of the percentage change of the historical nominal exchange rate vis-à-vis other currencies.11
Scenario 5: A combination of previous Scenarios 1 and 4. In this scenario, the Ksh depreciates by one standard deviation vis-à-vis the other three currencies, while all interest rates increase by one standard deviation at all maturities. This reflects the likelihood that interest rates would likely react to an external shock that affects the exchange rate.f) Description of Alternative Financing Strategies
56. The analysis compares a number of alternative strategies with 2011 MTDS. In particular, this analysis assesses the relative performance of a strategy aiming to maximize external concessional financing (corresponding to Strategy 2 below). However, in light of the possibility of significant shortfall in external disbursements, as experienced in the recent past, the analysis also evaluates the costs and risks associated with alternative strategies that assume relatively higher domestic borrowing (Strategy 3 and 4) or the issuance of an international sovereign bond (Strategy 5) to meet the expected Government gross financing needs.
11 This shock corresponds to a 10 percent depreciation vis-à-vis the Euro and the USD and a 15
57. The candidate strategies are described below and in Table 7.
a) Strategy 1 (S1. 2011 MTDS). This is the preferred strategy in
2011 MTDS, which has been implemented in the past year. It assumes that 30 percent of the gross financing needs would be met by external borrowing, mainly from concessional creditors, and 70 percent from the domestic market, mainly through Treasury Bonds. The concentration of issuance with 5- and 10-year maturities assumes a significant initiative to reduce cost of domestic debt associated with longer dated securities.
b) Strategy 2 (S2. More external borrowing). External and domestic borrowing would amount to 35 percent and 65 percent of gross financing needs respectively. There is concentration of issuance of more concessional debt to reduce the refinancing risk associated with external debt.
c) Strategy 3 (S3. Medium term domestic debt). This strategy maximizes domestic borrowing, assuming 70 percent of gross financing needs are met through these sources. External financing would decrease to 30 percent of Government gross financing needs. The concentration of issuance with 5- and 10-year maturities assumes the initiative to reduce cost of domestic debt associated with longer dated securities is maintained.
d) Strategy 4 (S4. More domestic borrowing). It assumes domestic borrowing would amount to 75 percent while 25 percent of the gross financing needs would be met by external borrowing, from concessional and semi-concessional creditors.
e) Strategy 5 (S5. International Sovereign Bond (ISB)). Under this strategy, the Government would issue an international bond12 as an alternative to increasing domestic borrowing, and to retire the 2-year syndicated commercial loan.
58. Under all strategies, it is assumed that about one third of all official sector external borrowing is on less concessional terms, in line with recent experiences.
12Issued in USD, with 10-year maturity and bullet repayment, carrying a spread of 400 basis points.
Table 7: Alternative Debt Management Strategies 2011 MTDS More external debt Medium term domestic debt More domestic debt ISB New debt S1 S2 S3 S4 S5 Domestic 70% 65% 70% 75% 65%
Treasury bills (change
in stock) 8% 8% 10% 11% 12% 2-year 12% 11% 7% 13% 10% 5-year 16% 17% 23% 18% 12% 10-year 18% 12% 13% 14% 12% 15-year 8% 8% 8% 10% 10% 20-year 8% 8% 9% 9% 10% External 30% 35% 30% 25% 35% Semi-concessional 7% 4% 4% 4% 9% Concessional 20% 26% 22% 16% 11% 2-year syndicate 3% 5% 5% 5% 5% 10-year ISB 0% 0% 0% 0% 10%
VI. OUTCOMES OF ANALYSIS OF STRATEGIES
59. The performance of the five alternative strategies was assessed under the five identified market stress scenarios in terms of their relative cost and risk. Consideration focuses on performance in terms of the cost-risk tradeoff reflected in two key indicators, that is, Interest/GDP and PV of Debt/GDP. The former is relevant as it indicates the amount of resources required to service the debt and which is, consequently, not available for other uses; the latter is relevant as the government has set an overall ceiling of 40 percent of GDP for the PV of Debt. The results of this cost-risk tradeoff are shown in Table 8 and Figure 8.
Table 8: Cost-Risk Tradeoffs
Interest/GDP (%) S1 S2 S3 S4 S5
Baseline scenario 2.74% 2.71% 2.82% 2.96% 2.85%
Parallel shift in yield curve (2 std. deviations) 0.95% 0.93% 1.03% 1.12% 1.00%
Flattening of yield curve 0.28% 0.27% 0.29% 0.33% 0.26%
Extreme devaluation of exchange rate (30%) 0.13% 0.13% 0.14% 0.14% 0.14% Devaluation of exchange rate by 2 std. deviations 0.05% 0.05% 0.05% 0.05% 0.05%
Combination shock (1 std deviation) 0.27% 0.26% 0.28% 0.31% 0.29%
PV of Debt/GDP (%) S1 S2 S3 S4 S5
Baseline scenario 44.19% 43.70% 44.67% 45.51% 46.37%
Parallel shift in yield curve (2 std. deviations) 2.69% 2.51% 3.48% 4.55% 3.72%
Flattening of yield curve 0.94% 0.89% 1.09% 1.17% 0.85%
Extreme devaluation of exchange rate (30%) 5.43% 5.40% 5.45% 5.50% 5.53% Devaluation of exchange rate by 2 std. deviations 2.01% 2.00% 2.02% 2.04% 2.05%
Combination shock (1 std deviation) 2.83% 2.78% 2.98% 3.16% 3.22%
60. As anticipated, the strategy assuming the largest amount of official sector external borrowing (S2) has the most beneficial cost and risk attributes. This suggests that the government should target an increase in the amount of external official sector borrowing relative to S1 (2011 MTDS). However, given the potential challenges in achieving this strategy in practice, it is prudent to consider what the appropriate contingency should be in the event that there is a shortfall in disbursements. In that context, the choice is between relatively more domestic borrowing (as represented by S3 and S4) or accessing the international capital markets (S5).
61. However, there is a clear trade-off between S3, S4 and S5 in terms of Interest/GDP. Given the relatively greater weight of medium term domestic debt in S3, this strategy is less costly but more risky. On the other hand, S4 is more costly and risky due to the increased uptake of medium to long-term domestic debt. However, when PV of Debt/GDP is considered, S3 is also less risky given that a significant element of external borrowing is now exposed to interest rate risk. It is also important to recognize that the introduction of a bullet bond changes the nature of exchange rate risk of the portfolio relative to official sector financing, which also argues against choosing S5.
62. The relative ranking of strategies was also considered in the context of one alternative macroeconomic scenario. The scenario reflected the potential scale of direct government financing needed to support the development of county infrastructure. It is assumed that USD 884.2 million (Ksh 75 billion)13 will be required to finance additional expenditures over the next three years. Consequently, an adjustment was made for this presumed pipeline of debt (that is, the strategies described in Table 7 were applied to the total financing requirement net of this expenditure). Overall, this increases the proportion of external financing in each strategy by around 2 percent, but does not change the relative performance of the strategies (Appendix I). Consequently, S2 would remain the preferred strategy, with the tradeoff between S3, S4 and S5 as above.
13 This is derived by maintaining the level of Debt to GDP at 43 percent of GDP over the medium
63. Overall, there is relatively little difference between how each strategy performs. This is due to the fact that net new borrowing over this period is quite limited relative to the size of the existing debt portfolio. As a result, the characteristics of the existing portfolio continue to dominate. This suggests that other factors should have a more significant bearing on the ultimate decision.
64. A range of other key indicators (Table 9) were also closely analyzed. The results consider S2 as the most optimal strategy that effectively mitigates refinancing risk. This risk has become increasingly relevant for debt managers in light of the continued turmoil in the recent global debt crisis. In addition, S2 will likely have a higher success rate of execution given the bias towards issuance of medium-term domestic securities - a highly preferred term structure by local investors (Table 10, S1).
Table 9: Other Key Indicators
Simulation Horizon (2012/13-2014/2015)
S1 S2 S3 S4 S5
Cost indicators (average over simulation)
Average interest rate 6.6% 6.5% 6.7% 6.9% 6.7%
Interest / revenues 10.0% 9.9% 10.2% 10.4% 10.2%
Risk indicators (end simulation horizon)
% DX in debt portfolio 45% 45% 47% 50% 45%
ATM (years) 11.4 11.6 11.2 10.7 10.8
% of debt refixing within 12 months 10.8% 10.8% 10.5% 11.9% 11.4% % of DX debt refinancing within 12 months 10.8% 10.8% 10.5% 11.9% 7.9% Short-term external debt / reserves 14.2% 14.2% 14.2% 14.2% 14.2%
Implied net borrowing (% of GDP) (average over
simulation)
Net domestic borrowing 2.47% 2.37% 2.86% 3.38% 2.8%
Net external borrowing 1.59% 1.68% 1.24% 0.81% 1.4%
65. Other factors may also be relevant if the government were to consider tapping the international capital markets. In Kenya’s case, the investors’ risk appetite may be affected by any residual political uncertainty, which suggests that the optimal time for an issue might be following the 2013 General Elections. In addition, investors’ continued focus on issues relating to fiscal transparency, quality of statistics and effectiveness of public financial management and expenditure controls
requires the Kenyan Government to strengthen public financial management and expenditure frameworks coupled with continued improvements in data quality and transparency if the country is to secure best pricing on any issue.
66. Finally, it is prudent to consider the implied quantities to be borrowed in each instrument type to assess the feasibility of any of the strategies. As designed, S2 requires the greatest amount of net official sector borrowing at an average of around USD 685 million a year; while under S1, this borrowing target is scaled down by USD 36 million (Table 10).
Table 10: Borrowing Quantities by Instrument
Implied gross borrowing (annual
average) S1 S2 S3 S4 S5
Foreign borrowing (US$ mn) 1,061 1,098 921 742 1,078
Official sector borrowing (US$ mn) 1,061 1,098 921 742 743 International capital market
securities (US$ mn) - - - - 335
Domestic borrowing (Ksh mn) 270,367 265,861 285,146 321,036 281,341
Money market instruments 29,871 32,301 37,509 45,005 46,329 Short-term bonds (2-year) 63,762 59,632 44,016 72,008 58,010 Medium-term bonds (5 - 10 years) 119,482 109,326 136,640 129,015 99,786
Long-term bonds 57,252 64,602 66,981 75,008 77,215
Implied net borrowing (annual average)
Foreign borrowing (US$ mn) 648 684 508 329 665
Official sector borrowing (US$ mn) 648 684 508 329 330
International capital market
securities (US$ mn) - - - - 335.2
Domestic borrowing (Ksh mn) 110,329 105,698 127,409 149,471 113,519
Money market instruments (38,268) (37,535) (36,401) (32,639) (32,589) Short-term bonds (2-year) (13,981) (16,538) (26,015) (7,756) (16,737) Medium-term bonds (5 - 10 years) 105,326 95,170 122,484 114,858 85,629
Long-term bonds 57,252 64,602 66,981 75,008 77,215
67. In conclusion, taking into account both risk and cost trade-offs,
the implied quantity of gross borrowing, the need to develop the domestic debt market and ability to implement the strategy, the
2012 MTDS proposes Strategy 2 (S2) as the most optimal strategy.
Indeed, the results of the cost and risk analysis (Tables 11 and 12; Figures 9 and 10) reveal that the 2011 MTDS is less favorable going forward compared to the 2012 MTDS.