Abstract—Cross wavelet transform (XWT) which is used for the analysis and classification of electrocardiogram (ECG) signals is being described in this paper. A measure of similarity between two waveforms can be obtained by the cross-correlation between two time-domain signals. Localized similarities in time and frequency is revealed by the application of the continuous wavelet transform into two time series and the cross examination of these two decompositions. Wavelet cross spectrum (WCS) and wavelet coherence (WCOH) are yielded as a result of application of the XWT to a pair of data. A heuristically determined mathematical equation gives the parameters from the WCS and WCOH and these parameters are important for classifying signals as normal and abnormal cardiac patterns.
Index Terms— Cross wavelet transform (XWT), myocardial infarction, wavelet coherence (WCOH), wavelet cross spectrum, KNN.
I. INTRODUCTION
A heartbeat in the cardiac cycle of the inscribed electrocardiogram (ECG) waveform of each individual shows the time evolution of the heart‟s electrical activity. These are made of distinct electrical depolarization repolarization patterns of the heart.Changes in heart rate or rhythm, or change in the morphological pattern, is an indication of some abnormality which can be detected by the analysis of the recorded ECG patterns [1]. Heart diseases are now increasing day by day and lots of people are suffering from heart based diseases. It has now become one of the dominant health concerned issue all over the world. The analysis of ECG beat‟s characteristic shape, morphological features, and spectral properties can give significantly information for automatic detection of the ECG pattern. But the classification of ECG beats is a challenging problem because the characteristics of ECG signals show convincing variation for different patients under various physical conditions. Better performance of any automatic ECG analyzing system depends upon the sincere and exact detection of the basic characteristic features of the signal under study. Heart rate is being determined by QRS detection and is used as the reference point for beat alignment.
Manuscript received May, 2016.
Namita Thomas, PG Student, Department of ECE, College of Engineering Kidangoor, Kottayam Kerala, India
Deepthy Mathew, Assistant Professor, Department of ECE, College of Engineering Kidangoor, Kottayam Kerala, India
Large number of algorithms has been developed for QRS detection [2]. ECG signals are categorized as nonstationary signals in nature. This makes wavelet transforms an efficient tool for the analysis of ECG signals. In this paper, ECG data has been analyzed using cross wavelet transform (XWT) and explore the resulting spectral differences. The proposed method uses only R-peak detection for beat segmentation. In this proposed paper, only inferior myocardial infarction (IMI) affected patterns and normal class have been taken into consideration. Normal and abnormal ECG patterns are analyzed and identified by subjecting them to XWT. Here a method for ECG pattern classification is presented based on parameters developed from the wavelet cross spectrum (WCS).
Rest of the paper is structured as follows. Section II gives the wavelet transform details. Section III describes the material used. In section IV methodology has been described .Rest of the sections give the performance analysis and results.
II. REVIEW OF WAVELET TRANSFORM
Biomedical signals like ECG are non-stationary in nature. Wavelet Transform was found to be an efficient and effective solution for processing nonstationary signals. Wavelet mean „small wave‟. Wavelet analysis is about analyzing signals with short duration and finite energy functions. Wavelet analysis transforms the signal under study into another perspective which presents the signal in a more useful form. This way of transforming signal is known as wavelet transform.
• Continuous wavelet transform
The technique of decomposing a signal f (t), into a number of translated and dilated wavelets [3] is referred as continuous wavelet transform . The main technique behind this is to take a mother wavelet Ψ(t), translation and dilation , convolve it with the function of interest, and finding out the coefficients in wavelet space, obtained by translation and dilation. The wavelet transform provides temporal locality which is an advantage over Fourier analysis. The Daubechies wavelet is selected as the mother wavelet in this paper (Fig. 1) because it provides an excellent balance between time and frequency localization .Daubechies wavelet family is found to be the most suited choice for wavelet in this work due to the similarity of the wavelet with that of the ECG signal. .
KNN Based ECG Pattern Analysis and
Classification
Fig 1. Daubechies Wavelet
• Cross wavelet transform
A Quasi-periodic signal is periodic in nature with period and amplitude variations. The electro cardiogram (ECG) and several physiological signals can be treated as quasi periodic The continuous wavelet transform is efficient for examining how a time series varies in time and scale, but unfortunately fails to show how it varies over a scale when assigning a period that best characterizes it.The study of interrelation between pairs of time-domain signals can be performed by the XWT application. The XWT of two time series X and Y is defined as W xy = Wx Wy* Where „*‟ denotes complex conjugation. We can again define the cross wavelet power as |W xy |. The complex argument arg(W xy) can be interpreted as an analogous phase between xn and yn in the time-frequency space. Given two time series X and Y, with wavelet transforms, Wnx(s) and Wny(s) one can define the cross-wavelet spectrum as Wnxy(s)= Wnx(s)Wny (s)* where Wny (s)* is the complex conjugate of Wny(s).
III. MATERIAL USED
In the proposed technique wavelet transform is the base for the pattern analysis and a KNN classifier is used for the classification work. Lots of ECG data‟s are needed for the completion of this work that is ECG pattern analysis and classification. Physikalisch-TechnischeBundesanstalt diagnostic 12-lead ECG database (ptbdb) of Physionet[4] provides all the data's required for this work. We choose this dataset because it contains 549 records of 290 subjects with 52 healthy controls and 148 MI patients. We are dealing with IMI affected and normal ECG cases in this paper so this database satisfies us the most. A cardiac beat from a 25 year-old non-smoking male with a heart rate of 72 beats/min is considered as the normal template for analysis. A beat ensemble of patient id: ptbdb/patient150/s0287lre is advised as the normal template. This template is validated using visual inspection by doctors and also by standard textbooks [5] .For this study only Inferior MI class is considered which is detectable from the inferior leads II, III, Avf.
IV.METHODOLOGY
In the proposed method cross wavelet transform based classification is involved. All the data for the project has been
Fig2. Flowchart for the analysis
taken from the Physionet ,12-lead ECG database Physikalisch-TechnischeBundesanstalt diagnostic (ptbdb) . All the data have been denoised, beat segmented and time normalized before analysis. Then the signals are subjected to wavelet analysis and parameters are extracted and are classified as either normal or abnormal signals. The figure above shows the flowchart for analysis.
The main steps those are included in this ECG pattern analysis and classification are listed below
Denoising(Noise Removal) and Time normalization
Feature extraction
classification
A. Noise removal and Time normalization
Denoising of ECG data is an crucial step before any form of analysis because this increases the efficiency of the algorithm[6].This work uses Discrete Wavelet Transform based decomposition and selective reconstructions of wavelet coefficients for denoising and QRS detection[7]. In this technique, noise is excluded by selective decomposition and recognition of the noise affected frequency bands and thereby rejecting the corresponding coefficients. For, identification of the QRS frequency band, the detail coefficients D4 and D5 are selected, because together they contain most of the QRS information. The ECG data is first denoised and then R peaks are registered before subjecting the signal to further signal processing. Following that the heart rate is computed and beats are segmented and are time normalized before analysis, as heart rate varies from subject to subject.
One cardiac cycle gives the details of the condition of the subject, and hence each beat needs to be segmented before giving it to cross wavelet analysis.Since the heart rate varies for each subject, the cardiac cycle duration also varies.Let the heart rate is H beats/min for a sampling rate m,then the number of samples in one beat is given by,
n = (60.m)/H
Where n is a function of H. Main requirement is to get equal number of samples in all beats so that point-to-point correlation study becomes possible. In-order to get an equal number of samples, fast Fourier transform based interpolation technique has been used.All segmented beats have 1000 samples [8] after interpolation.
B. Feature Extraction and Parameter Identification
XWT produces WCS and WCOH, which are matrices containing the WCS and WCOH between two signals [9]. In this paper, normal templates and templates with IMI are examined. There exists a varying QT pattern for normal and abnormal data. The QT zone, which is the pathological region, is selected for parameter extraction and analysis. A span that includes 80 points from the left to 400 points to the right of the registered R peak is the QT zone. This start and end of the time zone are marked as t1 and t2, respectively. To find the actual span of scales that are valuable for the analysis, a timescale relation is established. From the WCS, (1) is developed, where s signifies the scale, which varies from 1 to 512.
...(1) The Sum_WCS(s) carries the summation of the WCS value at each point over the whole ECG signal beat. The values of Sum_WCS(s) of various subjects both normal and abnormal are plotted in Fig. 3. By examining the graph, it is pointed that changes in the XWS for normal and IMI case is most prominent in the region marked with s1, s2 values which ranges from 75 to 300, where the normal is plotted with the solid lines and abnormal are represented with the dotted line. Any parameter extracted from this scale range over the QT zone from WCS and WCOH will give us a unique identification signature which can be used for classification. So this scale ranges is selected by visual inspection. Parameters extracted from the WCS and WCOH matrices from selected scale range which varies from s1 to s2 and over the QT segment from t1 to t2. Equations (2) and (3) are framed for parameter extraction that is used for classification.
Fig 3.Plot for identifying scale ranges . ………..(2) ……….….(3)
Accordingly, a threshold value from (2) and (3) is set for normal and abnormal class identification. Three sets of parameters (pa1, pp1), (pa2, pp2), (pa3, pp3) are obtained from the standard leads II, III, and AVF. Individual threshold values are estimated for each of the leads and hence the dataset is subjected to threshold-based classification.
C.Classification
Here the data classification procedure leads to a case which develops a separation between normal and IMI affected classes. Standard leads II, III, and AVF are used for the identification of IMI ECG patterns. A heuristically determined mathematical formula gives the parameter from the WCS and WCOH. Results of tests establish that the parameter is very crucial for classification of normal and abnormal cardiac patterns. However, there exist many complex classification techniques. In this paper, a new technique is introduced. The aim is to develop a new dimensional feature set of ECG for better analysis of ECG signal. The ECG database is trained, classified using K nearest neighbour method for better accurate and positive results. K-nearest neighbour algorithm (KNN) which is a classification technique based on closest training samples. It is an instance-based learning algorithm that, rather than performing explicit generalization, compare new problem instances with instances presented in training, which have been saved in memory. It is referred as instance-based because it constructs inferences directly from the training instances themselves. This method requires a particular parameter need to be chosen based on which classification will be carried out. All samples present in training set have their own value. Now we can compare the sample to be tested with samples already present in training set.
V. PERFORMANCE MEASUREMENT
The most significant term for determining systems overall performance is accuracy. We define the overall accuracy of the classifier for each file as,
Acc= {(NT− NE)/NT}*100... (4)
Acc is the accuracy, and the variables NE represent the total number of classification errors and NT represents beats in the file, respectively. Sensitivity Se is the ratio of the number of Correctly detected events, to the total count of events, given by Se = {TP/(TP + FN)}× 100... (5)
Where false negatives (FN) is the number of missed events. The specificity, sp is defined as the ratio of the number of
Table 1.Performance table
Sensitivity(in%) 92.3077
Specificity(in%) 76.9231
Accuracy(in %) 84.6154
correctly rejected nonevents, to the total count of nonevents, and is as shown below
Sp = {TN/(TN + FP)}× 100... (6)
Where false positives (FP) is the number of falsely detected events.
VI.RESULTS
The following section shows the results obtained during the different phases of the project work.
Performance Result
Table 1 shows the obtained accuracy, sensitivity and specificity from lead III based on KNN based ECG classification.
Noise Removal Result
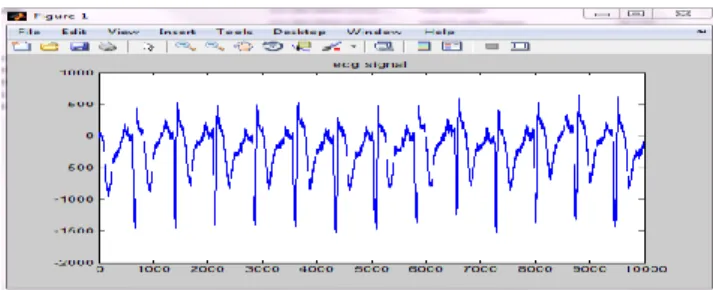
The plot of Normal ECG signal before processing is shown in figure below . High frequency noises are removed by discarding the detail coefficients D1, D2. The baseline variation frequency is 0.15– 0.8 Hz. Approximation coefficient A10 contains this frequency along with the DC component of the ECG. Power line interference component is concentrated in the A5 coefficient. So by removing all these specified coefficients and reconstructing the signal, a denoised ECG signal can be obtained, which is shown below.
The QRS region is obtained from the detail coefficients D3,D4 and D5.Figure 5 shows the signal after noise removal.
Figure4. ECG signal before noise removal
Figure5. ECG signal after noise removal Classification Result
Figures 5-6 shows the WCS plot for the normal and abnormal ECG patterns.
Figure6. WCS plot for normal template
Figure7. WCS plot for abnormal template VII. CONCLUSION
The ECG Features extracted plays a very pivotal role in the diagnosis of cardiac diseases. Almost all of the classification techniques use explicit time-plane features such as ST segment, R height, T height, etc. As a result, rule mining
techniques are employed for shorter feature a set, which increases the computational complexity Hence, highly accurate extraction techniques are needed. Wavelet transforms can be implemented with Multi Resolution Analysis using a suitable wavelet family to obtain highly detailed features from signals. Daubechies wavelet proves to be the best in analysis of ECG signal due to its similarity. The application of CWT to two time series and the cross examination results in identical time and scale (scale being inverse of frequency).The resultant Wavelet Cross spectrum (WCS) produces the spectral components of interest.
ACKNOWLEDGMENT
Authors are grateful to the TEQIP, College of Engineering Kidangoor for the financial support to complete this paper work.
REFERENCES
[1] L. Schamroth, An Introduction to Electrocardiography, 7th ed. New York, NY, USA: Wiley, 2009.
[2] S. Mitra, M. Mitra, and B. B. Chaudhury, “Pattern defined heuristic rules and directional histogram based online ECG parameter extraction,” Measurement, vol. 42, no. 1, pp. 150–156, 2009.
[3] I. Daubechis, “The wavelet transform time frequency localization and signal analysis,” IEEE Trans. Inf. Theory, vol. 36, no. 5, pp. 961–1004, Sep. 1990.
[4 ](2012). PTB Diagnostic ECG Database Directory,
Physiobank Archive Index, PTB Diagnostic ECG Database Available: http://physionet.org/physiobank/database
[5] A. L. Goldberg, Clinical Electrocardiography, 7th ed. Amsterdam, The Netherlands: Elsevier, 2010.
[6] Denoising and feature extraction of ecg using discrete wavelet transform 1arun navaria, 2 dr. Neelu jain
[7] S. Banerjee, R. Gupta, and M. Mitra, “Delineation of ECG characteristic features using multiresolution wavelet analysis method,” Measurement, vol. 45, no. 3, pp. 474–487, Apr. 2012 [8] J. G. Proakis and D. G. Manolakis, Digital Signal Processing, Englewood Cliffs, NJ, USA: Prentice-Hall, Apr. 2006.
[9] Swati Banerjee and Madhuchhanda Mitra, „Application of Cross Wavelet Transform for ECG Pattern Analysis and Classification‟ , IEEE Transactions on Instrumentation AndMeasurement, VOL. 63, NO. 2, February 2014
Ms. Namita Thomas received her BTech Degree in Electronics and Communications engineering From CUSAT, Kerala, India in 2014. She is currently pursuing her MTech Degree in Wireless Technology from CUSAT, Kerala, India.