E-ISSN: 2408-9761/15 © 2015 Cosmos Scholars Publishing House
Systematic Documentation of Fetal Heart Rate (FHR) Patterns and
the Correlation with pH Computed in the Umbilical Artery
V.M. Roemer
*and R. Walden
32756 Detmold, Schützenberg 7, Germany
Abstract: Introduction: A new computer program was written to analyze FHR-tracings of 601 fetuses from the Frauenklinik Detmold in Germany. This program is demonstrated in this paper using data of one fetus only.
Material and methods: During a time period of eleven years 601 FHR-tracings were recorded electronically and further analyzed. To demonstrate the program only one fetal case was further analyzed: 1.) In this case we measured the fetal heart frequency (FHF) and one broad deceleration, 2.) the micro-fluctuation (micro) of this fetus and the micro during the large deceleration, 3.) the oscillation amplitude (OZA) during the whole CTG and the OZA during this broad deceleration. In addition the weighted WAS-score (reference 14) was determined and the actual pH-value was computed (not measured) for umbilical blood. All these parameters are available in each case of these 601 fetuses.
Results: Besides the electronic CTG-analysis it is new to determine the actual pH-values in umbilical blood using only the FHF: Both variables are not identical but belong closely together. The FHR helps to determine fetal well being and it helps to compute the pH-values in umbilical fetal blood. Therefore, micro-blood sampling (MBU) according to E. Saling seems to be no more necessary. These results are preliminary because our number of MBU’s is still small. The new program is able to analyze FHR-tracings thoroughly and to determine the pH-values in umbilical blood continuously.However, FHR-monitoring with a small computer seems to be necessary.
Conclusions: The fetus in utero can be monitored seriously using his FHR together with other parameters. In hypoxic danger, the foetus can be monitored sufficiently without intermittent control of his actual pH-values in peripheral blood. Fetal pH-values can be determined approximately and continuously using only the FHR.
Keywords: Computer analysis of the FHF, FHF, Micro-fluctuation, Oscillation amplitude, WAS – score, Computed
fetal pH-values.
INTRODUCTION
Since the introduction of fetal heart-rate (FHR)
monitoring by E.H. Hon [1], R. Caldeyro-Barcia [2] and
K. Hammacher [3] some 60 years ago the obstetrical
attention was focused on avoidance of fetal hypoxia
and acidosis. The clinical success however was
doubtful [4] and criticism was flourishing [5]: In 1995
our American colleagues stated: ‘… with the exception
of the reduction of the rate of neonatal seizures, the
use of routine electronic fetal monitoring (EFM) has no
measurable impact on morbidity and mortality’. Indeed,
during many years there was no general consensus in
defining a ‘pathological’ or non-reassuring FHR-tracing.
Years later it was J.T. Parer and Ikeda [6] in America
among others who developed in 2007 a framework for
a standardized management of intra-partum FHR
patterns using the baseline FHR, the baseline
variability and the types of decelerations. The two
authors colour-coded the tracings and made it possible
to construct a standardized approach to Intra partum
FHR management which was evidence-based and
received also consensus in the literature [7].
*
Address correspondence to this author: 32756 Detmold, Schützenberg 7, Germany; Tel: + 49 5231 35842; Fax: + 49 5231 34006;
E-mail: [email protected]
Thereafter many other authors [8-11, 15] tried to
ameliorate the efficacy of fetal monitoring using always
still other methods in combination with FHR-monitoring.
Success seemed to be present.
Years ago E. Saling [12, 13] in Berlin was the first
who introduced fetal blood sampling (FBS) to monitor
the fetus sub partu. Many years later we tried to
overcome FBS because the FHR-parameters seemed
to be sufficient for monitoring the fetus. We used a
score [14], the WAS-score, for monitoring the fetus and
the actual pH-value measured always in the umbilical
artery (pH, UA) to assess fetal well being after birth.
Therefore, no micro-blood samplings (MBS) were
analyzed in this paper. In the past our number of MBS
was very small (< 2%).
To compute this score mentioned above three
variables derived from the FHR were computed
electronically for each CTG-minute:
1.) The number of local maxima and minima (ozf)
during each minute of the FHR. We called this
parameter “micro-flucuation” (see Figure 1). The value
in fetuses with normal pH-values amounts to about 60
turns / min. Micro-fluctuation differs from true
beat-to-beat variability but - according to our data - offers the
best correlation with the parameters of the fetal
acid-base balance [19].
2.) The oscillation amplitude of each minute (oza),
covering all decelerations and accelerations (unit:
beats per Minute (bpm)). The dips were not classified
because in our series the uterine activity was never
recorded electronically and
3.) The mean fetal heart rate (FHR) - frequency of
each CTG-minute (fhm, unit: bpm).
In this study we want to show our electronic
management using nearly all our FHR-data and
demonstrate the efficacy of FHR-monitoring without
any FBS.
MATERIAL AND METHODS
The FHF signals (i.e. the R-R intervals of the
F-ECG) of 646 fetuses were recorded also with a
computer. The sampling rate was 4 frequencies per
second using a normal CTG: 8040A (Hewlett-Packard).
During a period of eleven years (2000 - 2010) all
recordings were realized in the Frauenklinik of the
Klinikum Lippe Detmold GmbH, Germany, (Former
head: Prof. Dr. V. M. Roemer).
To enter the study all fetuses must have been
delivered by the vaginal route and each tracing could
last some minutes up to many hours. During forceps-
and/or vacuum-deliveries recordings were always
continued; However in the beginning the FHR-signals
were not always perfect.
Therefore, short-lasting (< 20 Sec.) electronic signal
losses were overcome by electronic signal repair
algorithms developed in our institution [8]. Cases with
long lasting signal losses were excluded. Therefore, in
this study no caesarean sections were included
because fetal monitoring was not possible during the
preparation for the operation. If necessary, a new
scalp-electrode was inserted immediately during bad
monitoring. Recordings of fetuses with
chorio-amnionitis and tracings of severely malformed
neonates were also excluded after birth. During the
eleven years, the 648 fetuses were not randomly
Figure 1: shows the 4
thminute of a CTG measured electronically. Three parameters are explained (at the top). They are used
for further management.
selected in our hospital, because it was not really
possible: We performed no computerized monitoring at
night.
No major doses of maternal drugs were given
during the time of fetal recording. Thus 601 recordings
of overall 648 fetuses were left and analyzed in this
study.
All data in this paper were analyzed electronically
by the authors using MATLAB, the language of
technical computing (USA).
This program was written by Prof. Dr. R. Walden
former senior system engineer and physicist at the
university of Bielefeld. It was translated in English by
VMR. The program summarizes our actual experience
on this field. Each of the 601 cases can be addressed
and analyzed separately. This program is not suitable
for FHR-management and general documentation [16].
In this paper pictures of only one case
(CTG-Number: 36280920ctx) are given in order to explain
and comment the procedure.
Early during our investigation we suggested that
typically different FHR-patterns occur in fetuses being
awake (german: wach), being acidotic (Azidose) and/or
being in sleep (in german: Schlafzustand). Therefore
we called this simple triplet WAS-score:
Wachen-Azidose-Schlafen – score. We used these three fetal
parameters to quantify fetal well-being in utero sub
partu by weighting these variables empirically. After
some years it turned out that this score was good
correlated with the pHUA-values measured soon
(minutes) after delivery [14].
Therefore, electronic optimizing-procedures lead to
the following index:
( )
(
( ))
( )
(
( ))
( )
( )
(
( ))
fhm ozf Index ozafhm t g
fhm t
ozf t g
ozf t
WAS
t
oza t g
oza t
=
where
g
fhm,
g
ozfand
g
ozadenote three mathema-
tical weighting functions comparable approximately to
boundaries in discontinuous scoring-procedures
e.g
. in
the APGAR-score. It turned out that this index was
good correlated with the actual pH-values measured in
the umbilical artery [14].
RESULTS
For a better understanding, Figure
1
shows three
variables which were always analyzed during each
individual CTG-minute. The variable micro-fluctuation
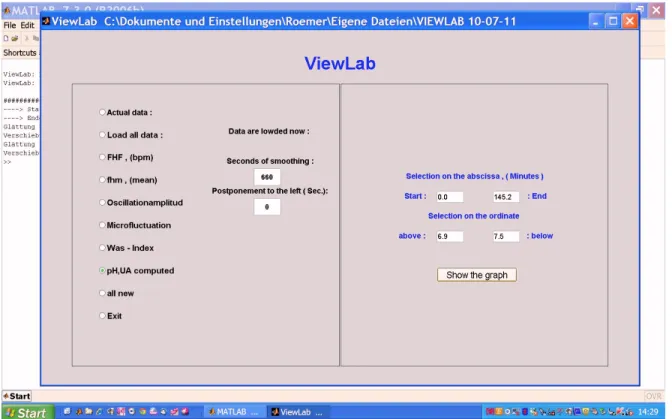
Figure 2:
shows the variables which can be determined electronically. The boundaries for the six parameters are given on the
right hand side.
refers to the number of turning points during always
one CTG-minute.
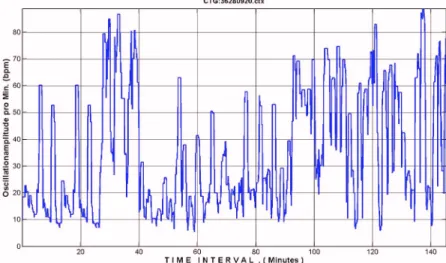
The oscillation amplitude (16.5 bpm in this minute)
was not used numerically in the WAS – score.
Figure
2 shows one of the starting-pictures of the
computer program itself available to analyze the data of
each case of the 601 fetuses.
We decided to evaluate only one case, the fetus
36280920ctx (Year: 2003, month: June, starting-time of
the CTGt: 09:20; alpha-numeric figures are also used).
This baby was born spontaneously at the 40
thweek of
pregnancy, weighting 3610 g and measuring 53 cm.
The acid-base values measured in the umbilical
artery (all parameters in the umbilical vein were
determined also) was 7.160, the pCO
2amounted to
83.0 mm Hg and the pO
2was 13.5 mm Hg. BE
Band
BE
ECFwere not determined and further analyzed [18] in
this paper. The APGAR-scores were 6 / 9 / 10 after 1, 5
and 10 Min.
Figure
3 shows the whole monitor of the last 145.2
min before delivery.
During the 22
thand 42
thmin. occurs a broad
deceleration due probably to a cord complication which
however was not fount at delivery.
All useful possibilities of documentation are possible
using a computer. After considering the whole tracing
lasting 145.2 min. we looked to the FHR pattern
between the 22
thand 42
thmin. and we omitted
frequencies below 50 bpm because the obstetrician is
usually not used to frequencies below 50 bpm. This is
demonstrated in Figure 4.
Figure
4 shows this unusually large deceleration
lasting ca. 9 min.
Figure 3:
shows the FHR-monitor Number 36280920, which lasted 145.2 min. until delivery. The compression of the monitor is
unusual for an untrained obstetrician.
Figure 4:
concentrates to a large deceleration of unknown origin (cord compression ?) which was further analyzed. Note the
The reason might have been a cord-compression
due to fetal movements during this recording. We do
not know the uterine activity during this time interval but
we can realize the deceleration pattern. These
decelerations are shown in Figure 5 and Figure 6: Note
that all the decelerations are turned exactly about 180
degrees measuring only the amplitude of each dip. As
mentioned before the dips are not further classified.
Only the amplitude (ordinate) of the dips are given in
bpm.
Figure 5 shows the fetal deceleration - pattern again
during the whole tracing (145, 2 min.).
Below (Figure 6) only all decelerations during the 25
min of fetal compromise are shown: There are many
variable decelerations. This however was not entirely
clear : The program is not able to discern late dips from
variable dips because the uterine activity is not
included in our study: The reason for this deficit was
that it turned out after many attempts that this would be
too difficult electronically because the uterine signals
are not constant enough.
These 25 min. are given in Figure 6. covering the 9
min. of the deceleration.
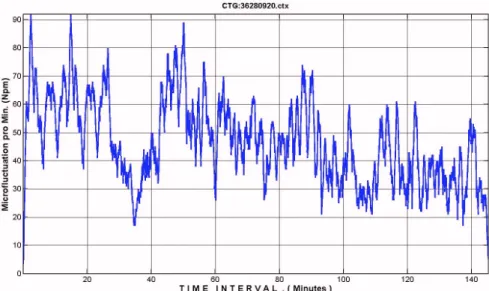
Let us now consider micro-fluctuation, the most
sensible parameter.
Micro-fluctuation is not identical with beat-to-beat
variability (see Figure 1). In healthy and mature fetuses
this parameter amounts to about 60 units pro min. In
our studies [19] we found that it is the most sensible
Figure 5:
shows the amplitude of the oscillation pattern during this unusual deceleration. The type of deceleration is not
analyzed (‘late’ or variable) because the uterine activity is never recorded in our system. The width of the baseline is recorded
also at the bottom.
Figure 6:
shows three large decelerations which were most probably the reason for the FHR alteration(s). The basal tonus was
not constant.
parameter of the FHR when compared with all other
variables. Micro-fluctuation can not be measured
precisely with the naked eye. It can only be measured
electronically. It is therefore a strong argument to
perform FHR-monitoring with a small computer in the
near future.
Figure
8
shows micro-fluctuation again during 25
min. covering the large deceleration of ca 9 min. (see
Figure
4
) and indicating that micro-fluctuation comes
down from ca. 60 (N/min.) to less than 20 during this
event; this indicates fetal hypoxia and acidosis during
this time interval.
Micro-fluctuation is strongly associated with the
FHF-level in non-acidotic fetuses: r = 0.641, P<<0.001,
[19]. However, this reaction-pattern is still complex [14]
and not further discussed in this context.
Afterwards (see Figure
7
) micro-fluctuation was
again steadily decreased down to ca. 25 turns / min.
with a final pH,UA of 7.160.This baby was slightly
depressed (APGAR 6 after 1 min.) . Probably this could
have been avoided. These few pictures show the
sensibility of this parameter.
Figure
9
shows the actual pH-values now
determined exclusively by the FHR and displayed
continuously the first time. These pH-values represent
the actual pH measured in blood of the umbilical artery
not in peripheral blood (head or buttocks). These
values were always computed using the FHR only
without any pH-measurements. It is not astonishing
Figure 7: gives the micro-fluctuation measured during the whole record showing a continues decrease indicating fetal hypoxia
and acidosis probably due to cord entanglements in utero.
Figure 8: demonstrates micro-fluctuation during 25 min covering the large FHR deceleration(s). The frequency comes down
from ca. 60 to below 20 turning points pro min. indicating true hypoxia.
that the curve resembles the curve of micro-fluctuation.
The FHF seems to be not sensitive enough.
There is still a small difference between the
computed actual pH-values and the measured
pH,UA-values determined in umbilical blood. This difference
however is small, [14]. Therefore we believe that fetal
blood-sampling might be no more necessary in the
near future.
Figure 10 shows that electronic smoothing alters the
pH,UA-values numerically: They come down at the end
to nearly a straight line. If we avoid any smoothing the
curve starts at zero min. (abscissa, not at 60 min.) but
gives less information. Each smoothing-interval can be
chosen electronically. This interval should be
determined by the obstetrician: There is a mixture of
blood in the foetus; this mixing - process needs some
time which we have to note and to accept.
Therefore, the computed pH-value in the umbilical
artery is not identical with the measured value but it
seems to be close to it. In this newborn the computed
pH-value was also 7.160. Note: the dynamics shown in
Figure 9 is absent in Figure 10.
DISCUSSION AND CONCLUSIONS
This is the first attempt to combine FHR-monitoring
with fetal acidemia without any measurements of fetal
blood pH. It seems to be useful however, it is still not
perfect. We need a proof. Our own number of FBS in
peripheral blood is still too small. Therefore we must
attack the pH-values in umbilical blood. These values
however are present only when the baby has been
born. Therefore, we should use the CTG to measure
(guess) fetal pH also. This however seems to be
possible only with a small computer.
Figure 9:
shows the actual pH-value computed continuously during the whole recording of 145.2 min. The large dip is mirrored
in the tracing: The actual pH comes down to about 7.05 and after recovery is decreased further on to 7.160.This pH-value was
measured in the umbilical artery at delivery. Measured and computed pH-values are not identical but close together. Therefore
the hypoxic fetal stress might also be monitored continuously.
Figure 10:
shows clearly that heavy smoothing of the computed pH-values (3600 sec = 60 min.) disturbs the sensibility and
alters the computed pH-values. The chosen values in this context are extreme.
We should remember: During increasing asphyxia
(APGAR score, 1 Min.: 0 – 3) the pH in the fetal
centrum (heart and umbilical arteries) is more reliable
then the pH in the peripheral skin (skin of the head,
buttocks and sometimes also extremities) measured by
normal FBS according to E. Saling. Fetal age and fetal
weight play also a certain role. These parameters could
be determined before or during delivery using
ultrasound measurements. These variables however
are numerically not included in our analysis until now.
This should be the next step.
There must be a correlation between the FHR (
i.e
.
CTG) and the fetal acid-base balance which we don’t
know until now and which we should use in the near
future.
The WAS-score is difficult enough but it shows in
our hands already a clear correlation (r = 0.654, P <<
0.001) with pH, UA in 483 newborns examined during
the last 30 min. of delivery [14].
We should remember therefore: FBS is not easy to
perform; it is time- and money-consuming and the
pH-values are never achieved continuesly.
Nevertheless we should trust in FHR-monitoring -
assisted by a small computer - because these
CTG-parameters are reliable, sensitive and easy to manage.
REFERENCES
[1] Hon EH: The electronic evaluation of the fetal heart rate;
Preliminary report. Am J Obstet Gynec 1958; 75: 1215-30.
http://dx.doi.org/10.1097/00006254-195813000-00015
[2] Caldeyro-Barcia R, Mendez-Bauer C, Posero JJ, Escarcena
LA, Pose SV, Bieniarz J, et al. Control of human fetal heart
rate during labor. In:Cassels DE (Hrsg):The heart and circulation in the newborn infant. Grune & Stratton, New York, 1966, p 7.
[3] Hammacher K, Hüter A, Bokelmann J, Werners PH. Fetal
heart frequency and perinatal condition of the foetus and newborn. Gynaecologia. 1968; 166: 349-60.
http://dx.doi.org/10.1159/000302346
[4] Schneider H, Kritische Evaluation des CTG. Gynäkologe.
1996; 293: 5-11.
[5] Thaker SB, Stroup DF, Peterson HB. Efficacy and safety of
intrapartum electronic monitoring: An update; Obstet Gynec 1995; 86: 613-20.
http://dx.doi.org/10.1016/S0029-7844(95)80027-1
[6] Parer JT, Ikeda T. A framework for standardized
management of intrapartum fetal heart rate pattern. Am J
Obstet Gynecol 2007; 197: 1-6.
http://dx.doi.org/10.1016/j.ajog.2007.03.037
[7] Miller DA, Intrapartum FHR monitoring: A standardized
approach to management. Clin Obstet & Gynec 2011; 54 : 22-7.
http://dx.doi.org/10.1097/GRF.0b013e31820a0564
[8] Römer VM, Walden R. Neues Reparaturprogramm für FHF-
Kurven. Frauenarzt 2007; 48: 98-9.
[9] Clark SL, Nageotte MP, Garite TJ, Freemann RK, Miller DA,
Simpson, KR, et al. Intrapartum management of category II
fetal heart rate tracings: towards standardization of care. Am J Obstet Gynecol 2013; 209: 89-97.
http://dx.doi.org/10.1016/j.ajog.2013.04.030
[10] Olofsson P. Current status of intrapartum fetal monitoring:
cardiotocography versus cardiotocography + ST analysis of the fetal ECG. Eur J Obstet Gynecol Reprod Biol 2003; 22: 113-8.
http://dx.doi.org/10.1016/S0301-2115(03)00181-7
[11] Olofsson P, Ayres-de-Campos D, Kessler J, Tendal B, Yli
BM, Devoe L. A critical appraisal of the evidence for using cardiotoco-graphy plus ECG ST interval analysis for fetal surveillance in labor. Part II, the metaanalyses. Acta Obstet Gynecol Scand 2014; 93: 571- 86.
http://dx.doi.org/10.1111/aogs.12412
[12] Saling E. Neues Vorgehen zur Untersuchung des Kindes
unter der Geburt: Einführung, Technik und Grundlagen . Arch für Gynaekol 1962; 97: 108-22.
http://dx.doi.org/10.1007/BF02590014
[13] Saling E. Kardiotokographie mit oder ohne Fetalblutanalyse.
Geburtsh. u. Frauenheilk.1985; 45: 190-3.
http://dx.doi.org/10.1055/s-2008-1036232
[14] Römer VM, Walden R. The factor time in fetal heart rate
monitoring and the detection of acidosis using the WAS-score. Z Geburtsh Neonatol 2014; 218: 80-6.
http://dx.doi.org/10.1055/s-0034-1372596
[15] Amer-Wahlin I, Hellsten C, Noren H, Hagberg H, Herbst A et
al. Cardiotocography only versus cardiotocography plus ST
segment analysis of fetal electrocardiogram for intrapartum fetal monitoring: A Swedish randomized controlled trial. Lancet 2001; 358: 534-8.
http://dx.doi.org/10.1016/S0140-6736(01)05703-8
[16] Syllwasschy N, Noel KG, Hatzmann J, Reinhard J, Schiermeier S. Moderne Anforderungen und derzeitiger Stand in der Geburtsdoku- mentation in Deutschland. Z Geburtsh Neonatol 2014; 218: 106-12.
http://dx.doi.org/10.1055/s-0034-1374634
[17] Römer VM, Walden R. CTG Pathologie: Ist eine kontinuierliche elektronische Diagnostik sub partu möglich. gyn (prakt.Gynäkoklgie) 2010;2:130-8.
[18] Römer VM, The clinical significance of base excess (BEB)
and base excess in the extracellular fluid compartement
(BEECF) with and without correction to real oxygen saturation
of haemoglobin. Z Geburtsh Neonatol 2011; 215: 115-24.
http://dx.doi.org/10.1055/s-0031-1271756
[19] Römer VM, Walden R, Basic principles of the fetal heart rate
during delivery without hypoxia and acidosis. Z Geburtsh Neonatol 2012; 216: 11-21.
http://dx.doi.org/10.1055/s-0031-1291340
Received on 11-03-2015 Accepted on 09-04-2015 Published on 02-07-2015
http://dx.doi.org/10.15379/2408-9761.2015.02.02.03
© 2015 Roemer and Walden; Licensee Cosmos Scholars Publishing House.
This is an open access article licensed under the terms of the Creative Commons Attribution Non-Commercial License
(http://creativecommons.org/licenses/by-nc/3.0/), which permits unrestricted, non-commercial use, distribution and reproduction in any medium, provided the work is properly cited.