Agriculture Division
WORKING PAPER #38
Off-farm Work by Census-farm Operators:
An Overview of Structure and Mobility Patterns
Michael Swidinsky, Wayne Howard and Alfons Weersink University of Guelph
March 1998
Catalogue no. 21-601-MIE98038
The responsibility for the analysis and interpretation of the data is that of the authors and not of Statistics Canada. Minister of Industry, Statistics Canada, 1998. All rights reserved. No part of this paper may be reproduced, stored in a retrieval system or transmitted in any form or by any means, electronic, mechanical, photocopying, recording or otherwise.
Off-farm Work by Census-farm Operators: An Overview of Structure and Mobility Patterns
Michael Swidinsky, Wayne Howard and Alfons Weersink, University of Guelph Executive Summary
The purpose of this paper is to provide descriptive statistics on off-farm labour supply and farm/off-farm labour reallocation for Canadian farmers using cross-sectional data and cross-sectional panel data, respectively, obtained from the Canadian Census of Agriculture. This report is part of a larger study on the off-farm labour supply and labour mobility of farm operators (Swidinsky, 1997). The data indicates that a growing
proportion of operators worked off-farm between 1971 and 1991. As well, operators who work off-farm have allocated greater amounts of time to the off-farm labour market. The share of census-farm operators reporting 97-228 days of off-farm work has risen from 11 percent to 15 percent, while the share working more than 228 days off-farm has
increased from 13 percent to 16 percent of all operators from 1971 to 1991. There is also some mobility between the status of full-time and part-time farming, but a high proportion of both types of operators exit farming over a five-year period. Less than 15 percent of operators farming full-time change to part-time, while approximately 20 percent of
operators farming full-time change to part-time. In contrast, approximately 25 percent of full-time operators exit farming, while 35 percent of part-time operators exit farming over a typical five-year period.
1. Introduction
Policy analysts continuously monitor the distribution of operators across various structural groups to design and evaluate agricultural policy. One classification of interest is the full-time / part-time status of the farm operator. This paper is part of a larger study (Swidinsky, 1997) that analysed the off-farm labour function of farm operators and analysed the mobility between the status of full-time and part-time farmer. This paper presents a descriptive summary. A multivariate analysis is presented in the larger study (Swidinsky, 1997).
Variables used by Swidinsky (1997) to model off-farm labour supply and farm/off-farm labour reallocation decisions of Canadian farm/off-farmers are summarised. The data
captures human capital, farm and family characteristics, other income and labour market conditions. Furthermore, the unique nature of the data allows for operator mobility. The database links files between time periods, allowing for the entry and exit decisions of operators to be captured. The first section provides a description of the data source. Historical statistics to provide some background information is presented in the second
section. The third and fourth sections present summary data used to estimate off-farm labour supply and farm/off-farm labour reallocation, respectively.
The theory of off-farm labour supply is essentially a theory of the allocation of time. A model of off-farm labour supply was developed from home-production theory adapted for the farm household. A farm operator is assumed to maximise utility which depends on consumption goods and leisure subject to a budget constraint constructed from other income, the marginal revenue product from farm production, and the market wage rate. Determinants of off-farm labour supply are identified as the wage rate, prices of farm output, purchased goods and farm inputs, along with human capital, farm and family characteristics, and levels of other income.
Operators can change their working status (i.e. farm/off-farm labour reallocation) by reallocating their labour between farm and off-farm work. Operators working full-time on farm can change to time farming or exit farming. Likewise, operators working part-time on farm can change to full-part-time farming or they can exit farming. A theoretical
framework to explain farm/off-farm labour reallocation was developed from farm-household production theory. Changes in farm/off-farm labour reallocation are
determined by changes in the real wage rate and the real marginal revenue product of farm labour. Since changes in these variables are not observable, human capital, farm and family characteristics, other income and labour market conditions are used as proxy variables.
One way to summarise these relationships is by considering a kinked demand curve for labour (for example, see Bollman (1979a, 1979b)). The operator faces a downward sloping demand for on-farm labour and a horizontal demand for off-farm labour. The intersection of the kinked demand curve with the operator’s supply of labour determines whether the operator participates in off-farm work (if the curves intersect to the right of the kink), or works only on the farm (if the curves intersect to the left of the kink). If the horizontal demand for off-farm labour intersects the vertical axis above the downward sloping demand for on-farm labour curve, the individual is not farming. Shifts in these three curves determine changes in the status of part-time farming, full-time farming and “farming” (where entry and exit are the change in the status of “farming”).
2. Data Source
The data used to analyse off-farm labour supply are from Statistics Canada's Agriculture-Population Linkage Database of census-farm operators, linking files from the Census of Population for 1986 (the long questionnaire, Form 2B, which is a 20 percent sample) to the Census of Agriculture questionnaire. The farm/off-farm labour reallocation model uses the same data source, but for 1991 in addition to 1986. A census-farm
classified as an "exiter". Likewise, a census-farm operator who is not on the file in 1986 census period, but is on the file in 1991 census period is classified as an "entrant". This allows an analysis of operator mobility. The sample consisted of 53,143 census-farm operators.
A census-farm operator is the person responsible for the day-to-day decisions made in running a census-farm. Only one operator is designated for each census-farm. For the 1986 Census of Agriculture, a census-farm was defined as an agricultural holding with sales of agricultural products of $250 or more during the past 12 months. Variables from the 1986 Census of Population (20 percent completed the long questionnaire, Form 2B) are added to this database to form the Agriculture-Population Linkage Database. Variables from the Census of Population provided information which was not available in the Census of Agriculture such as age, education and income by source for the operator and spouse.
The proportion of operators not working off-farm has decreased from 65 percent in 1971 to 62 percent in 1991 (Table 1). Those participating in off-farm work are tending to work more farm. The share of census-farm operators reporting 97-228 days of off-farm work has risen from 12 percent to 15 percent while the share working more than 228 days off-farm has increased from 12 percent to 15 percent of all farms from 1971 to 1986.
7DEOH'LVWULEXWLRQRI&HQVXVIDUP2SHUDWRUVE\'D\VRI2II)DUP:RUN&DQDGD
1XPEHURIGD\VRIRIIIDUP ZRUN
<HDU 1RQH ! 7RWDO
QR SHUFHQW QR SHUFHQW QR SHUFHQW QR SHUFHQW QR SHUFHQW
6RXUFH6WDWLVWLFV&DQDGD&HQVXVHVRI$JULFXOWXUH 1RWH2QO\RSHUDWRUVRISURSULHWRUVKLSSDUWQHUVKLSDQGIDPLO\FRUSRUDWLRQV DUHLQFOXGHG )LUVWOLVWHGRSHUDWRU $OORSHUDWRUV
Operators under the age of 35 have increased as a proportion of all farmers reporting 1-96 and 97-228 days of off-farm work, while remaining relatively constant in other working categories (Table 2). Although operators 35-54 years of age have
generally declined as a percentage of all operators, they still account for almost one half of total farmers in each working category. The proportion of operators aged 55 and over increased for those working full-time, but remained relatively constant for the various categories of those working off-farm. In general, those working off-farm tend to be younger. 7DEOH'LVWULEXWLRQRI&HQVXVIDUP2SHUDWRUVE\$JHZLWKLQHDFKFODVVRI'D\VRI2II)DUP:RUN&DQDGD 1XPEHURIGD\VRIRIIIDUP ZRUN 1RQH ! $JHRI2SHUDWRUV <HDU QXPEHUDQGSHUFHQWRIFHQVXVIDUPRSHUDWRUV 6RXUFH6WDWLVWLFV&DQDGD&HQVXVHVRI$JULFXOWXUH 1RWH2QO\RSHUDWRUVRISURSULHWRUVKLSSDUWQHUVKLSDQGIDPLO\FRUSRUDWLRQVDUH LQFOXGHG )LUVWOLVWHG RSHUDWRU $OORSHUDWRUV
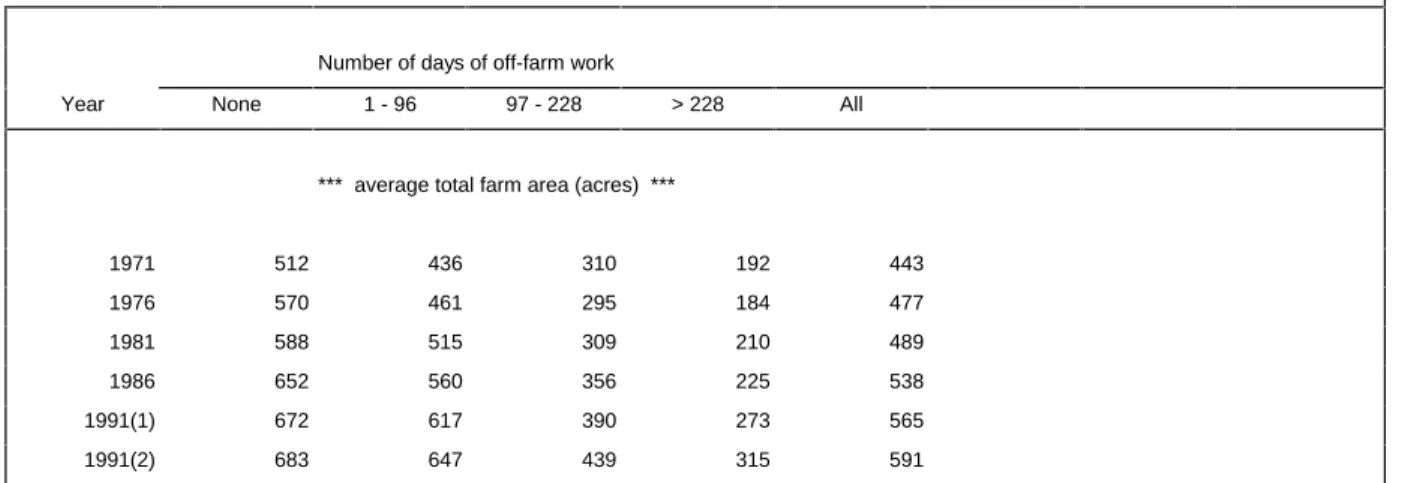
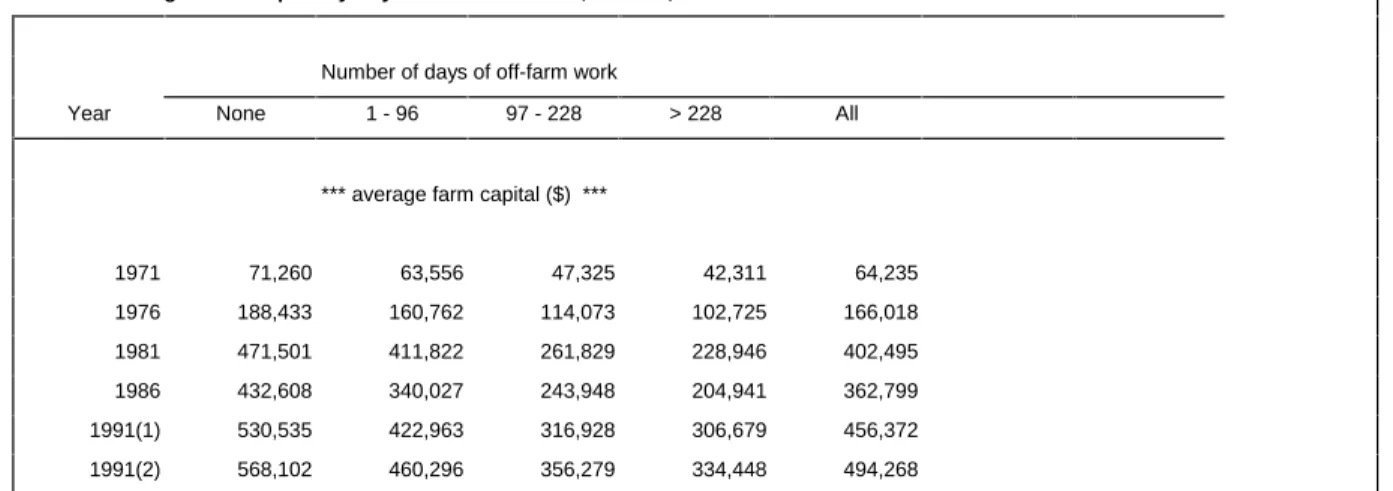
As expected, average sales, land and capital decline with off-farm work, since less of the operators time is allocated to the farm (Tables 3, 4 and 5). Differences between working categories have increased over time, particularly between operators not participating in the off-farm labour market and other working categories.
Table 3. Average Gross Farm Revenue by Days of Off-Farm Work, Canada, 1971-1991
Number of days of off-farm work
Year None 1 - 96 97 - 228 > 228 All
*** average gross farm revenue ($) ***
1971 13,308 10,178 5,526 4,108 10,970
1976 N/A N/A N/A N/A N/A
1981 63,758 44,590 19,688 17,569 49,177 1986 89,738 55,303 29,437 22,747 67,715 1991(1) 107,126 66,956 37,919 36,270 82,945 1991(2) 118,442 76,068 46,905 42,968 93,524 6RXUFH6WDWLVWLFV&DQDGD&HQVXVHVRI $JULFXOWXUH 1RWH2QO\RSHUDWRUVRISURSULHWRUVKLSSDUWQHUVKLSDQGIDPLO\FRUSRUDWLRQVDUH LQFOXGHG )LUVWOLVWHGRSHUDWRU $OORSHUDWRUV
Table 4. Average Total Farm Area by Days of Off-Farm Work, Canada, 1971-1991
Number of days of off-farm work
Year None 1 - 96 97 - 228 > 228 All
*** average total farm area (acres) ***
1971 512 436 310 192 443 1976 570 461 295 184 477 1981 588 515 309 210 489 1986 652 560 356 225 538 1991(1) 672 617 390 273 565 1991(2) 683 647 439 315 591 6RXUFH6WDWLVWLFV&DQDGD&HQVXVHVRI $JULFXOWXUH 1RWH2QO\RSHUDWRUVRISURSULHWRUVKLSSDUWQHUVKLSDQGIDPLO\FRUSRUDWLRQVDUH LQFOXGHG )LUVWOLVWHGRSHUDWRU $OORSHUDWRUV
Table 5. Average Farm Capital by Days of Off-Farm Work, Canada, 1971-1991
Number of days of off-farm work
Year None 1 - 96 97 - 228 > 228 All
*** average farm capital ($) ***
1971 71,260 63,556 47,325 42,311 64,235 1976 188,433 160,762 114,073 102,725 166,018 1981 471,501 411,822 261,829 228,946 402,495 1986 432,608 340,027 243,948 204,941 362,799 1991(1) 530,535 422,963 316,928 306,679 456,372 1991(2) 568,102 460,296 356,279 334,448 494,268 6RXUFH6WDWLVWLFV&DQDGD&HQVXVHVRI $JULFXOWXUH 1RWH2QO\RSHUDWRUVRISURSULHWRUVKLSSDUWQHUVKLSDQGIDPLO\FRUSRUDWLRQV DUHLQFOXGHG )LUVWOLVWHGRSHUDWRU $OORSHUDWRUV
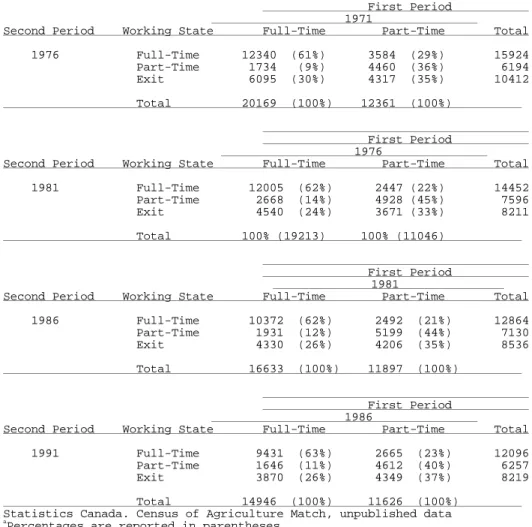
Table 6. Redistribution of Census Farm Operators by Working State, Canada, 1971-1991a
First Period 1971
Second Period Working State Full-Time Part-Time Total 1976 Full-Time 12340 (61%) 3584 (29%) 15924 Part-Time 1734 (9%) 4460 (36%) 6194 Exit 6095 (30%) 4317 (35%) 10412 Total 20169 (100%) 12361 (100%) First Period 1976
Second Period Working State Full-Time Part-Time Total 1981 Full-Time 12005 (62%) 2447 (22%) 14452 Part-Time 2668 (14%) 4928 (45%) 7596 Exit 4540 (24%) 3671 (33%) 8211 Total 100% (19213) 100% (11046) First Period 1981
Second Period Working State Full-Time Part-Time Total 1986 Full-Time 10372 (62%) 2492 (21%) 12864 Part-Time 1931 (12%) 5199 (44%) 7130 Exit 4330 (26%) 4206 (35%) 8536 Total 16633 (100%) 11897 (100%) First Period 1986
Second Period Working State Full-Time Part-Time Total 1991 Full-Time 9431 (63%) 2665 (23%) 12096 Part-Time 1646 (11%) 4612 (40%) 6257 Exit 3870 (26%) 4349 (37%) 8219 Total 14946 (100%) 11626 (100%) Statistics Canada. Census of Agriculture Match, unpublished data
a
Percentages are reported in parentheses. *
10% sample of census farm operators.
Note: Full-time refers to operators with zero days of off-farm work in the previous year. Part-time refers to operators with one or more days of off-farm work in the previous year.
The proportion of operators continuing to farm full-time and part-time have remained relatively stable (Table 6). Approximately 60 percent of full-time operators remained full-time in the next period. Since 1976, approximately 40 percent of part-time farmers remained part-time in the next period. Less than 15 percent of operators farming full-time change to time, while approximately 20 percent of operators farming part-time change to full-part-time farming. An increasing proportion of operators farming full-part-time and part-time has exited farming. Approximately 25 percent of full-time operators exit farming over five years, while 35 percent of part-time operators exit farming over a five-year period. The differences in transition probabilities depend on the working category of the operator. It is important to consider the previous working category when examining the labour reallocation decisions of the operator.
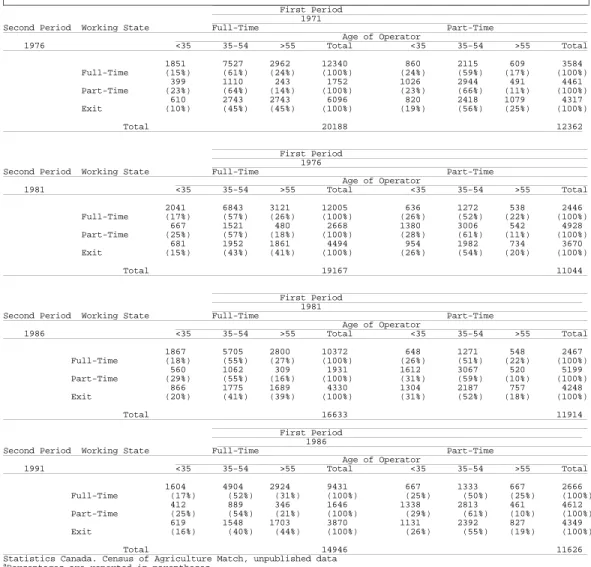
Table 7 Redistribution of Census Farm Operators by Working State Classified by Age, Canada, 1971-1991a First Period 1971 Second Period Working State Full-Time Part-Time Age of Operator 1976 <35 35-54 >55 Total <35 35-54 >55 Total 1851 7527 2962 12340 860 2115 609 3584 Full-Time (15%) (61%) (24%) (100%) (24%) (59%) (17%) (100%) 399 1110 243 1752 1026 2944 491 4461 Part-Time (23%) (64%) (14%) (100%) (23%) (66%) (11%) (100%) 610 2743 2743 6096 820 2418 1079 4317 Exit (10%) (45%) (45%) (100%) (19%) (56%) (25%) (100%) Total 20188 12362 First Period 1976 Second Period Working State Full-Time Part-Time Age of Operator 1981 <35 35-54 >55 Total <35 35-54 >55 Total 2041 6843 3121 12005 636 1272 538 2446 Full-Time (17%) (57%) (26%) (100%) (26%) (52%) (22%) (100%) 667 1521 480 2668 1380 3006 542 4928 Part-Time (25%) (57%) (18%) (100%) (28%) (61%) (11%) (100%) 681 1952 1861 4494 954 1982 734 3670 Exit (15%) (43%) (41%) (100%) (26%) (54%) (20%) (100%) Total 19167 11044 First Period 1981 Second Period Working State Full-Time Part-Time Age of Operator 1986 <35 35-54 >55 Total <35 35-54 >55 Total 1867 5705 2800 10372 648 1271 548 2467 Full-Time (18%) (55%) (27%) (100%) (26%) (51%) (22%) (100%) 560 1062 309 1931 1612 3067 520 5199 Part-Time (29%) (55%) (16%) (100%) (31%) (59%) (10%) (100%) 866 1775 1689 4330 1304 2187 757 4248 Exit (20%) (41%) (39%) (100%) (31%) (52%) (18%) (100%) Total 16633 11914 First Period 1986 Second Period Working State Full-Time Part-Time Age of Operator 1991 <35 35-54 >55 Total <35 35-54 >55 Total 1604 4904 2924 9431 667 1333 667 2666 Full-Time (17%) (52%) (31%) (100%) (25%) (50%) (25%) (100%) 412 889 346 1646 1338 2813 461 4612 Part-Time (25%) (54%) (21%) (100%) (29%) (61%) (10%) (100%) 619 1548 1703 3870 1131 2392 827 4349 Exit (16%) (40%) (44%) (100%) (26%) (55%) (19%) (100%) Total 14946 11626 Statistics Canada. Census of Agriculture Match, unpublished data
aPercentages are reported in parentheses. *10% sample of census farm operators.
Note: Full-time refers to operators with zero days of off-farm work in the previous year. Part-time refers to operators with one or more days of off-farm work in the previous year.
Since operators 35-54 years of age are the largest group it is not surprising that they make up a large proportion of each redistribution between working state (Table 7). A greater proportion of operators age 55 and over continue farming full-time compared to those under the age of 35. However, equal proportions of operators of each age group change from part-time to full-time farming. A greater proportion of operators under the age of 35 change from full-time to part-time farming relative to those age 55 and over. Few operators age 55 and over continue farming part-time compared to those under the age of 35. Exit from farming is positively correlated with age for operators farming full-time, while the proportion of part-time operators age of 35-55, exiting farming is greater relative to those age 55 and over. In general, full-time operators who exit farming are more likely to be older, while part-time operators who exit farming are more likely to be younger.
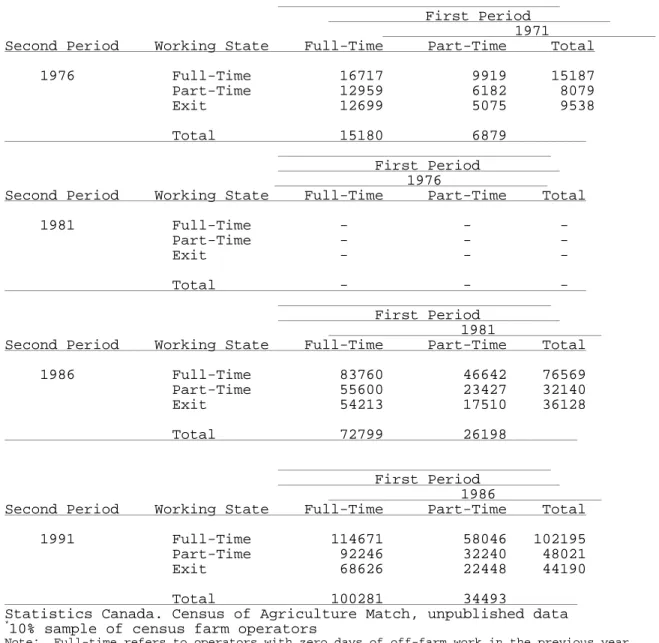
Table 8. Average Gross Farm Sales ($) by Change in Operator Working State, Canada, 1971 to 19911
First Period
1971
Second Period Working State Full-Time Part-Time Total 1976 Full-Time 16717 9919 15187 Part-Time 12959 6182 8079 Exit 12699 5075 9538 Total 15180 6879 First Period 1976
Second Period Working State Full-Time Part-Time Total 1981 FullTime PartTime Exit - - - Total - - - First Period 1981
Second Period Working State Full-Time Part-Time Total 1986 Full-Time 83760 46642 76569 Part-Time 55600 23427 32140 Exit 54213 17510 36128 Total 72799 26198 First Period 1986
Second Period Working State Full-Time Part-Time Total 1991 Full-Time 114671 58046 102195 Part-Time 92246 32240 48021
Exit 68626 22448 44190
Total 100281 34493 Statistics Canada. Census of Agriculture Match, unpublished data
*
10% sample of census farm operators
Note: Full-time refers to operators with zero days of off-farm work in the previous year. Part-time refers to operators with one or more days of off-farm work in the previous year.
.
1
Respondents in the 1976 Census questionnaire were asked to check a box to indicate the size class of their gross farm revenue - thus, a point estimate was not obtained to allow an average to be calculated.
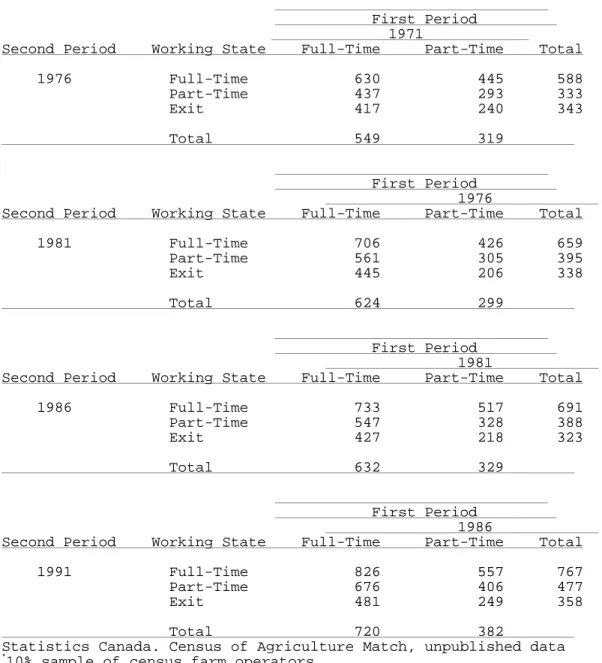
Table 9. Average Farm Land (acres) by Change in Operator Working State, Canada, 1971 to 1991
First Period
1971
Second Period Working State Full-Time Part-Time Total 1976 Full-Time 630 445 588 Part-Time 437 293 333 Exit 417 240 343 Total 549 319 First Period 1976
Second Period Working State Full-Time Part-Time Total 1981 Full-Time 706 426 659 Part-Time 561 305 395 Exit 445 206 338 Total 624 299 First Period 1981
Second Period Working State Full-Time Part-Time Total 1986 Full-Time 733 517 691 Part-Time 547 328 388 Exit 427 218 323 Total 632 329 First Period 1986
Second Period Working State Full-Time Part-Time Total 1991 Full-Time 826 557 767 Part-Time 676 406 477
Exit 481 249 358
Total 720 382 Statistics Canada. Census of Agriculture Match, unpublished data
*
10% sample of census farm operators.
Note: Full-time refers to operators with zero days of off-farm work in the previous year. Part-time refers to operators with one or more days of off-farm work in the previous year.
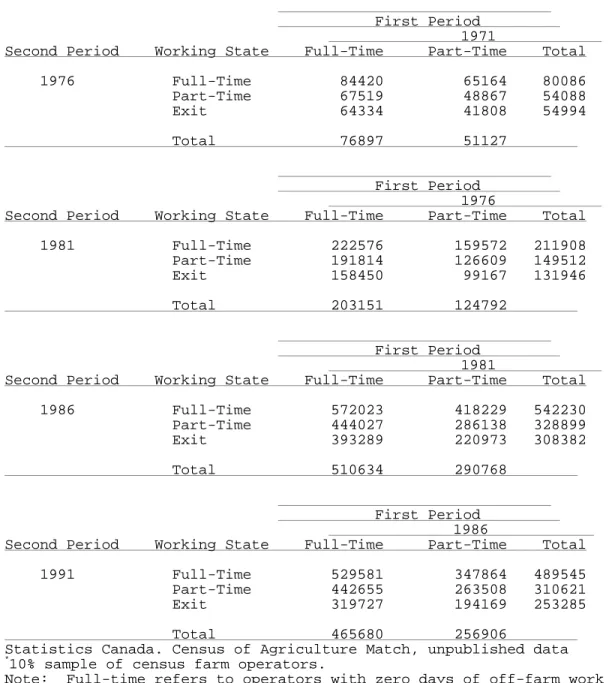
Table 10. Average Farm Capital ($) by Change in Operator Working State, Canada, 1971 to 1991
First Period
1971
Second Period Working State Full-Time Part-Time Total 1976 Full-Time 84420 65164 80086 Part-Time 67519 48867 54088 Exit 64334 41808 54994 Total 76897 51127 First Period 1976
Second Period Working State Full-Time Part-Time Total 1981 Full-Time 222576 159572 211908 Part-Time 191814 126609 149512 Exit 158450 99167 131946 Total 203151 124792 First Period 1981
Second Period Working State Full-Time Part-Time Total 1986 Full-Time 572023 418229 542230 Part-Time 444027 286138 328899 Exit 393289 220973 308382 Total 510634 290768 First Period 1986
Second Period Working State Full-Time Part-Time Total 1991 Full-Time 529581 347864 489545 Part-Time 442655 263508 310621
Exit 319727 194169 253285
Total 465680 256906 Statistics Canada. Census of Agriculture Match, unpublished data
*
10% sample of census farm operators.
Note: Full-time refers to operators with zero days of off-farm work in the previous year.
Part-time refers to operators with one or more days of off-farm work in the previous year.
As anticipated, operators farming full-time have greater average sales, land and capital compared to part-time operators and those exiting farming (Table 8, 9 and 10). Operators who continue to farm full-time have greater sales, land and capital than part-time operators who change to full-part-time farming. Perhaps part-part-time farmers who change to full-time farming acquire assets overtime. Likewise, full-time operators who change to part-time farming have greater sales, land and capital than operators who continue to farm part-time. Perhaps these full-time operators were unable to dispose of their assets after changing to part-time farming. Within each work category, those exiting farming are the smallest operators in terms of average sales, land and capital.
4. Summary statistics of operators who work off-farm
Off-farm labour supply has remained relatively constant over time. Thus, the supply of off-farm labour in 1986 is representative of past periods. Here we present additional information to compare the characteristics of operators who work and who do not work off-farm. In addition, a separate column is included with the value of the test statistic used to test the hypothesis of equal means for each independent variable
between the two types of operators. For most variables there were significant differences between operators without and with off-farm employment. There were 53,143 census farm operators in the sample, of which 23,251 participated in the off-farm labour market.
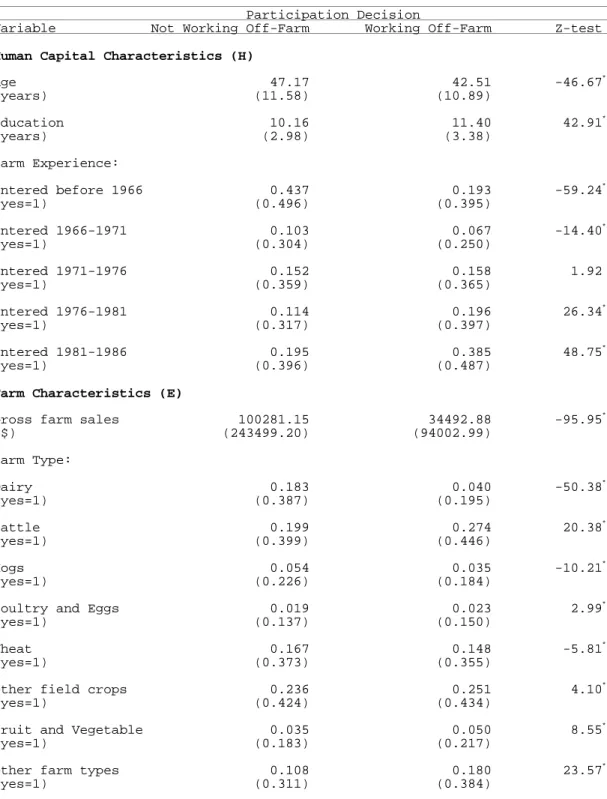
Table 11. Summary Statistics of Characteristics by Labour-Market Participation, Canada, 1986a
Participation Decision Variable Not Working Off-Farm Working Off-Farm Z-test
Human Capital Characteristics (H)
Age 47.17 42.51 -46.67* (years) (11.58) (10.89) Education 10.16 11.40 42.91* (years) (2.98) (3.38) Farm Experience: Entered before 1966 0.437 0.193 -59.24* (yes=1) (0.496) (0.395) Entered 1966-1971 0.103 0.067 -14.40* (yes=1) (0.304) (0.250) Entered 1971-1976 0.152 0.158 1.92 (yes=1) (0.359) (0.365) Entered 1976-1981 0.114 0.196 26.34* (yes=1) (0.317) (0.397) Entered 1981-1986 0.195 0.385 48.75* (yes=1) (0.396) (0.487)
Farm Characteristics (E)
Gross farm sales 100281.15 34492.88 -95.95* ($) (243499.20) (94002.99) Farm Type: Dairy 0.183 0.040 -50.38* (yes=1) (0.387) (0.195) Cattle 0.199 0.274 20.38* (yes=1) (0.399) (0.446) Hogs 0.054 0.035 -10.21* (yes=1) (0.226) (0.184)
Poultry and Eggs 0.019 0.023 2.99* (yes=1) (0.137) (0.150)
Wheat 0.167 0.148 -5.81* (yes=1) (0.373) (0.355)
Other field crops 0.236 0.251 4.10* (yes=1) (0.424) (0.434)
Fruit and Vegetable 0.035 0.050 8.55* (yes=1) (0.183) (0.217)
Other farm types 0.108 0.180 23.57* (yes=1) (0.311) (0.384)
Type of Organisation: Private or Individual 0.792 0.851 17.63* (yes=1) (0.406) (0.356) Partnership 0.132 0.115 -5.71* (yes=1) (0.338) (0.319) Corporation 0.076 0.033 -21.14* (yes=1) (0.265) (0.179) Family Characteristics (F)
Son in agri. occ. 0.143 0.076 -24.30*
(yes=1) (0.350) (0.265)
Working Spouse:
No spouse 0.182 0.139 -13.39* (yes=1) (0.386) (0.346)
Spouse in agri. occ. 0.332 0.171 -41.94*
(yes=1) (0.471) (0.377)
Spouse in non-agri. occ. 0.249 0.425 42.87* (yes=1) (0.432) (0.494)
Other spouse 0.237 0.265 7.62*
(yes=1) (0.425) (0.442)
Other Income (V)
Spouses earned income 3991.96 6012.31 32.12 ($) (8130.06) (10111.43)
Other family income 3102.42 2187.82 -15.23*
($) (11231.92) (26249.07)
Net farm income 11234.49 2168.54 -73.01* ($) (24740.77) (15323.48)
Family and Farm Income 19813.53 13309.65 -41.76*
($) (29096.90) (35071.50)
Government farm support 21854.58 7753.37 -86.37* ($) (43978.63) (26088.26)
Labour Market Conditions (M)
Population density 33.60 35.85 -0.44 (person per km2) (98.14) (92.84) Male unemployment rate 9.60 10.13 14.76* (percentage) (4.46) (4.57) Region: British Columbia 0.055 0.093 16.90* (yes=1) (0.228) (0.290) Prairie provinces 0.529 0.496 -7.62* (yes=1) (0.499) (0.500) Ontario 0.216 0.259 11.47* (yes=1) (0.412) (0.438)
Quebec 0.168 0.111 -18.83* (yes=1) (0.374) (0.314)
Atlantic provinces 0.032 0.042 6.39*
(yes=1) (0.175) (0.200)
Observations 29892 23251 Statistics Canada. Census of Agriculture Match, unpublished data
20% sample of census farm operators.
a
Standard deviations are reported in parentheses.
*
Human capital characteristics are captured by the age of the operator, years of education for the operator and farm experience, using time of farm entry as proxy
variables. Operators not working off-farm are approximately 5 years older than operators who do, while the latter group has one more year of education (Table 11). Labour market participants possess the human capital necessary to earn higher returns working off-farm. Operators not working off-farm tended to have entered farming earlier than operators who participate in the off-farm labour market. For example, 44 percent of non-participants entered farming prior to 1966, while only 19 percent of off-farm participants entered farming during the same period. Likewise, 20 percent of operators not working off-farm entered farming between 1981 and 1986, while 39 percent of off-farm labour participants entered farming during this period.
There were significant differences in the farm characteristics associated with the two types of operators. The average gross farm sales of operators not working off-farm were more than twice as large as for labour-market participants. A greater proportion of non-participants were dairy producers, compared with operators working off-farm, while the latter is true for cattle and other types of enterprises. Approximately 79 percent of operators not working off-farm operated proprietorship farms, compared to 85 percent of operators who worked off-farm. Partnerships and corporations accounted for 13 and 8 percent, respectively of enterprises run by non-participants as compared to 12 and 3 percent for off-farm labour market participants.
Family characteristics are captured through work attributes of the son and spouse. The share of operators having a son working in an agricultural occupation is greater for those working full-time on the farm compared to off-farm work participants. The same is true for operators having no spouse. Approximately 33 percent of operators not working off-farm have a spouse working in an agricultural occupation, compared to 17 percent of participants. The opposite is true for operators having a spouse working in a
non-agricultural occupation. Approximately 25 percent of operators not working off-farm have such a spouse, compared to 43 percent for off-farm participants.
Other income has been broken down into the spousal earnings, other family income, net farm income and government farm support. Average spousal earnings for operators working off-farm are greater than that for spouses of non-participants. Since a large share of participants have spouses working off-farm this result is anticipated. The other income variables are greater for operators not working off-farm compared to operators who do. Operators not working off-farm have on average more than five times the amount of net farm income than operators working off-farm. Average family income, including net farm income, was greater for non-participants, implying that participants needed wage earnings to make up for this shortfall in household income. This suggests income inequities between participants and non-participants. Similarly, non-participants receive on average three times the level of government farm support than participants.
The population density of the census sub-division (municipality or township) was used to measure labour market conditions. There was no significant difference found between the average population density for operators who participated and for operators who did not participate in the off-farm labour market. The male unemployment rate in census divisions was significantly different for the two types of operators, with a higher unemployment rate associated with operators working off-farm. This result is opposite to the anticipated result. The majority of both types of operators resided in the Western provinces. Operators not working off-farm were more likely to be in the Prairie provinces or in Québec. Operators working off-farm were more likely to be in British Columbia or Ontario. These regions have the most developed non-farm sectors and the resulting increased job opportunities may explain the higher off-farm labour participation in these regions.
Of the 23,251 census farm operators in the sample who participated in off-farm work, 17,947 reported wage earnings, which are necessary to compute a wage rate. If the operator does some custom work he may report some days of off-farm work, but no wage earnings. Instead, the operator reports this earned income as net farm income (Bollman, 1979). The average daily wage rate of this latter group was $220.51. Perhaps this
unexpectedly high wage rate is due to the fact that the days worked off-farm came from the Census of Agriculture questionnaire, while the wage earnings came from the
Population Census questionnaire. An alternative explanation is that operators have high salaries, which translate into high wage rates, when assuming a 260 day work year.
5. Summary statistics of operators by type of mobility pattern
The mobility patterns of operators among working state has remained relatively consistent across time periods. Thus, the transition of operators between 1986-1991 should be representative of this redistribution. Here we present additional information on human capital, farm and family characteristics, other income and labour market
conditions to allow further analysis of the transition patterns of operators.
The summary statistics of some 1986 independent variables used in the
estimation of farm/off-farm labour reallocation are reported in Table 12 for operators who farmed full-time in 1991, part-time in 1991 and exited farming in 1991. Since no
information in 1991 is recorded for operators who exited farming, only operator characteristics in 1986 can be used in describing working status in 1991. Empirical
analysis of farm/off-farm labour reallocation assumes that the operator is in disequilibrium with regards to working status in 1986, but in working status equilibrium in 1991. The number of days that the operator worked off-farm in 1991 and whether an operator in 1986 was still farming in 1991 were used to construct these categories. Operators are full-time if they stayed in farming and worked no days off-farm in 1991. Those operators who stayed in farming and worked some days off-farm in 1991 are classified as part-time.
Operators who left farming in 1991 have exited. There were 53,143 census farm operators in the sample, of which 24,192 were full-time, 12,514 were part-time and 16,437 exited farming. The sample is restricted to operators less than 65 years of age since those who exited farming are assumed to enter the nonfarm labour market. The values of the variables for full-time and part-time operators are different from those found in Table 11 since the operator’s working status is determined in 1991, while their
characteristics are defined in 1986.
In addition, three separate columns are included with the values of the test statistic used to test the hypothesis of equal means for each independent variable between the three types of operators. The first column (1), provides the test statistic between full-time and part-time operators (FT-PT). Similarly, the second column (2), gives the test statistic between part-time and exiting farmers (PT-E), while the third column (3), provides the test-statistic between full-time and exiting operators (FT-E). For most variables there were significant differences between operators farming full-time, part-time and exiting farming.
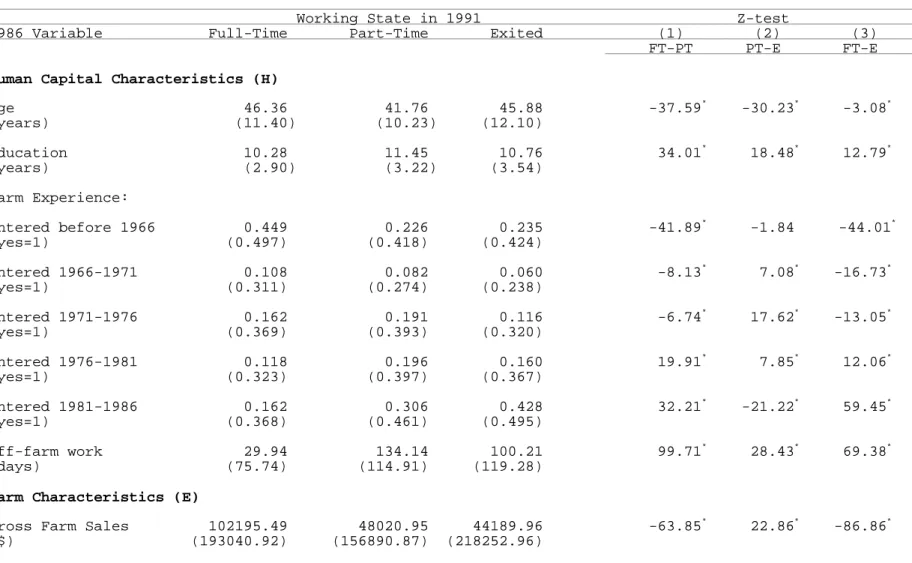
Table 12. Summary Statistics of 1986 Characteristics by Working State in 1991, Canadaa
Working State in 1991 Z-test 1986 Variable Full-Time Part-Time Exited (1) (2) (3) FT-PT PT-E FT-E
Human Capital Characteristics (H)
Age 46.36 41.76 45.88 -37.59* -30.23* -3.08* (years) (11.40) (10.23) (12.10) Education 10.28 11.45 10.76 34.01* 18.48* 12.79* (years) (2.90) (3.22) (3.54) Farm Experience: entered before 1966 0.449 0.226 0.235 -41.89* -1.84 -44.01* (yes=1) (0.497) (0.418) (0.424) entered 1966-1971 0.108 0.082 0.060 -8.13* 7.08* -16.73* (yes=1) (0.311) (0.274) (0.238) entered 1971-1976 0.162 0.191 0.116 -6.74* 17.62* -13.05* (yes=1) (0.369) (0.393) (0.320) entered 1976-1981 0.118 0.196 0.160 19.91* 7.85* 12.06* (yes=1) (0.323) (0.397) (0.367) entered 1981-1986 0.162 0.306 0.428 32.21* -21.22* 59.45* (yes=1) (0.368) (0.461) (0.495) Off-farm work 29.94 134.14 100.21 99.71* 28.43* 69.38* (days) (75.74) (114.91) (119.28)
Farm Characteristics (E)
Gross Farm Sales 102195.49 48020.95 44189.96 -63.85* 22.86* -86.86* ($) (193040.92) (156890.87) (218252.96)
Farm Type: Dairy 0.191 0.047 0.072 -37.55* -8.98* -33.55* (yes=1) (0.393) (0.211) (0.259) Cattle 0.216 0.274 0.221 12.41* 10.53* 1.06 (yes=1) (0.412) (0.446) (0.415) Hogs 0.054 0.038 0.040 -6.72* -0.95 -6.32* (yes=1) (0.225) (0.191) (0.196)
Poultry and Eggs 0.017 0.018 0.029 0.84* -6.14* 8.41* (yes=1) (0.128) (0.133) (0.168)
Wheat 0.165 0.171 0.138 1.41* 7.73* -7.44* (yes=1) (0.372) (0.377) (0.345)
Other field crops 0.239 0.272 0.225 6.91* 9.23* -3.30* (yes=1) (0.427) (0.445) (0.418)
Fruit and Vegetable 0.031 0.045 0.053 7.04* -3.15* 11.38* (yes=1) (0.173) (0.208) (0.225)
Other farm types 0.087 0.135 0.221 14.27* -18.84* 38.17* (yes=1) (0.282) (0.341) (0.415) Type of Organisation: Private or Individual 0.787 0.845 0.843 13.21* 0.40 14.05* (yes=1) (0.409) (0.362) (0.364) Partnership 0.138 0.119 0.109 -5.22* 2.48* -8.57* (yes=1) (0.345) (0.323) (0.312) Corporation 0.075 0.037 0.048 -14.34* -4.59* -10.91* (yes=1) (0.263) (0.188) (0.213) Family Characteristics (F)
Son in agri. occ. 0.154 0.092 0.072 -16.67* 6.20* -24.98* (yes=1) (0.361) (0.288) (0.258)
Working Spouse:
No spouse 0.156 0.122 0.206 -8.82* -18.87* 12.95* (yes=1) (0.363) (0.327) (0.404)
Spouse in agri. occ. 0.352 0.208 0.170 -28.31* 8.39* -40.18* (yes=1) (0.478) (0.406) (0.376)
Spouse in non-agri. occ. 0.263 0.421 0.347 30.86*
12.87* 18.19* (yes=1) (0.440) (0.494) (0.476) Other spouse 0.230 0.249 0.278 4.13* -5.51* 11.02* (yes=1) (0.421) (0.432) (0.448) Other Income (V)
Spouses earned income 4141.67 5900.93 5176.14 22.19* 14.39* 6.57* ($) (7972.60) (9697.53) (10062.36)
Other family income 2988.80 2180.22 2677.98 -13.14* 1.40 -14.83* ($) (10381.28) (32582.80) (15413.22)
Net farm income 11590.17 3428.02 3830.03 -49.37* -4.12* -53.17* ($) (25598.68) (17001.50) (16603.23)
Family and Farm Income 20297.02 14263.69 14127.12 0.34 -30.39*
-34.29*
($) (29741.70) (40296.10) (27298.65)
Government farm support 22585.94 11026.70 9074.85 -55.95* 23.23* -80.65* ($) (36213.06) (34917.46) (40617.20)
Labour Market Conditions (M)
Population density 30.23 30.89 43.80 -2.86* -11.41* 10.71* (person per km2) (83.89) (71.51) (123.84)
Male unemployment rate 9.56 9.72 10.31 4.42* -9.19* 15.26* (percentage) (4.39) (4.28) (4.81)
Region:
British Columbia 0.046 0.078 0.104 12.60* -7.35* 22.38* (yes=1) (0.210) (0.269) (0.305)
Prairie provinces 0.552 0.548 0.433 -0.83* 19.31* -23.55* (yes=1) (0.497) (0.498) (0.496) Ontario 0.205 0.245 0.270 8.74* -4.69* 15.06* (yes=1) (0.404) (0.430) (0.444) Quebec 0.165 0.089 0.153 -20.03* -16.25* -3.39* (yes=1) (0.371) (0.284) (0.360) Atlantic provinces 0.031 0.040 0.041 4.45* -0.44 5.34* (yes=1) (0.173) (0.195) (0.198) Observations 24192 12514 16437 Statistics Canada. Census of Agriculture Match, unpublished data
20% sample of census farm operators.
a
Standard deviations are reported in parentheses.
*
Significant difference between population means at the 5% significance level. (1) Z-test between full-time and part-time operators.
(2) Z-test between part-time and exiting operators. (3) Z-test between full-time and exiting operators.
Note: Full-time refers to operators with zero days of off-farm work in the previous year. Part-time refers to operators with one or more days of off-farm work in the previous year.
Human capital characteristics of the operator are captured using the age, education, farm experience and days worked off-farm. Operators farming full-time are approximately 5 years older than part-time operators, while those exiting farming are generally of the same age. Part-time operators have 11.5 years of schooling, while
operators farming full-time and exiting have approximately a year less of education. Farm experience is captured using time of farm entry as proxy variables. The share of
operators entering farming in earlier periods was higher for full-time operators. In contrast the share of operators entering farming in later periods was higher for part-time operators and those exiting farming. Full-time operators in 1991 worked approximately 30 days off-farm in 1986, while part-time off-farmers worked 134 days, and operators exiting off-farming by 1991 worked 100 days off-farm in 1986.
There were significant differences in the farm characteristics associated with the three types of operators. The average gross farm sales for operators farming full-time was more than twice as large as for part-time and exiting operators. Compared to operators exiting farming, part-time farmers had slightly greater average gross farm sales. The share of farmers operating a dairy enterprise was higher for full-time farmers, while the share of farmers managing cattle enterprises was higher for part-time and exiting farmers. The share of operators of other types of farms was significantly higher for farmers exiting the industry. Approximately 84 percent of part-time and exiting farmers ran their
operations as proprietorships, compared to 79 percent of full-time farmers. A higher proportion of full-time operators ran enterprises organised as partnerships and corporations, compared to the other types of operators.
Family characteristics are captured through the work attributes of the son and spouse. Approximately 15 percent of full-time operators had a son working in an agricultural occupation, compared to 9 and 7 percent of part-time and exiting farmers, respectively. The share of operators having no spouse was higher for exiting farmers, while the share of operators having a spouse working in an agricultural occupation was higher for full-time operators. Approximately 42 percent of part-time operators had a spouse working off the farm, compared to 26 and 35 percent of full-time and exiting operators, respectively.
The operator’s other income is divided into the earnings of the spouse, other family income, net farm income and government farm support. The average earnings of the spouse are greater for part-time farmers, followed by operators exiting farming. Other family income is greater for full-time operators, followed by exiting farmers. As anticipated, full-time operators have more than three times the amount of net farm income compared to the other types of operators. However, operators exiting farming have slightly more net farm income than part-time operators. Average family income, including net farm income, was significantly greater for full-time operators. Operators who farmed part-time or exited farming may have done so to make up for this shortfall in household income. The
amount given to part-time operators, while operators exiting farming are provided with significantly less support.
Labour market conditions are captured by the population density in the census sub-divisions and the male unemployment rate in the census division. The average
population density and unemployment rate is significantly greater for operators who exited farming than for part-time and full-time operators. The share of operators exiting farming is greater in British Columbia and Ontario, while the share of operators in full-time and part-time farming is greater in the Prairie provinces. A lower proportion of operators in part-time farming reside in Quebec, compared to the other types of operators.
6. Conclusion
The purpose of this paper was to provide descriptive statistics on off-farm labour supply and farm/off-farm labour reallocation for Canadian farmers using data obtained from the Canadian Census of Agriculture. The data captures human capital, farm and family characteristics, other income and labour market conditions. Furthermore, the unique nature of the data allows for analysis of operator mobility. The data indicates that an increasing proportion of operators work off-farm, and have allocated greater amounts of time to the labour market. Participants in off-farm work tend to be younger and more educated than non-participants. On average, participants operate smaller, proprietorship farms, compared to non-participants. A large proportion of operators working off-farm have a spouse participating in the labour market. Compared to non-participants, operator’s working off-farm have less unearned income, suggesting income inequities. Furthermore, a greater proportion of off-farm work participants reside in Ontario and Quebec, relative to operator’s not working off-farm.
There is some mobility between the status of full-time and part-time operators. However, an increasing proportion of both types of operators have exited farming. Full-time operators are older, while operators farming part-Full-time are more educated. Part-Full-time operators work more off-farm, followed by operators exiting farming. Operators farming full-time have larger farms, compared to the other types of operators. A large proportion of operators exiting farming have no spouse. Operators having a spouse working in an agricultural occupation was greater for full-time farmers. The share of operators having a spouse working off-farm was greater for part-time operators. On average, unearned income was higher for full-time operators. The population density was greater in census divisions where full-time operators were farming. A large proportion of operators exiting farming reside in British Columbia and Ontario, while a large share of full-time operators live in the Western provinces.
References
Bollman, Ray D. 1979a. Off-Farm Work by Farmers. (Ottawa: Statistics Canada, Census Analytic Study, Cat. No. 99-756).
Bollman, Ray D. 1979b. "Off-farm Work by Farmers: An Application of the Kinked Demand Curve for Labour", Canadian Journal of Agricultural Economics, Vol. 27, No. 1 (December), pp. 37-60.
Swidinsky, Michael. 1997. The Off-Farm Labour supply and Farm/Off-Farm Labour Reallocation of Farm Operators: A Conceptual Framework and Empirical Study. Unpublished PhD thesis, University of Guelph.
7
he Agriculture Division publishes working papers on research, analytical results, statistical techniques, methods and concepts. Contact the Agriculture Division by calling toll-free 1-800-465-1991 to order your copy. (Some of the Working Papers are available on the Statistics Canada Internet site).No. 1 (21-601-MPE80001) A Description of Theil’s RMPSE Method in
Agricultural Statistical Forecasts (1980)
Stuart Pursey
No. 3 (21-601-MPE81003) A Review of the Livestock Estimating Project
with Recommendations for the Future (1981)
Bernard Rosien and Elizabeth Leckie
No. 4 (21-601-MPE84004) An Overview of the Canadian Oilseed Industry
(1984)
Glenn Lennox
No. 5 (21-601-MPE84005) Preliminary Analysis of the Contribution of
Direct Government Payments to Realized Net Farm Income (1984)
Lambert Gauthier
No. 6 (21-601-MPE84006) Characteristics of Farm Entrants and their
Enterprises in Southern Ontario for the Years 1966 to 1976 (1984)
Jean B. Down
No. 7 (21-601-MPE84007) A Summary of Commodity Programs in the
United States (1984)
Allister Hickson
No. 8 (21-601-MPE84008) Prairie Summerfallow Intensity: An Analysis
of 1981 Census Data (1984)
Les Macartney
No. 9 (21-601-MPE85009) The Changing Profile of the Canadian Pig
Sector (1985)
Mike Shumsky
No. 10 (21-601-MPE86010) Revisions to the Treatment of Imputed House
Rents in the Canadian Farm Accounts, 1926 -1979 (1986)
Mike Trant
No. 11 (21-601-MPE92011) The Ratio Estimator: an Intuitive Explanation
and Its Use in Estimating Agriculture Variables (1992)
François Maranda and Stuart Pursey
No. 12 (21-601-MPE91012) The Impact of Geographic Distortion Due to
the Headquarters Rule (1991)
Rick Burroughs
No. 13 (21-601-MPE91013) The Quality of Agriculture Data – Strengths
and Weaknesses (1991)
Stuart Pursey
No. 14 (21-601-MPE92014) Alternative Frameworks for Rural Data (1992) A.M. Fuller, Derek Cook and
Dr. John Fitzsimons
No. 15 (21-601-MPE93015) Trends and Characteristics of Rural and Small
Town Canada (1993)
Brian Biggs, Ray Bollman and Michael McNames
No. 16 (21-601-MPE92016) The Microdynamics and Farm Family
Economics of Structural Change in Agriculture (1992)
Phil Ehrensaft and Ray Bollman
No. 17 (21-601-MPE93017) Grains and Oilseeds Consumption by
Livestock and Poultry, Canada and Provinces 1992
Livestock and Animal Products Section
No. 18 (21-601-MPE94018) Trends and Patterns of Agricultural Structural
Change: Canada / US Comparison
Ray Bollman, Leslie A. Whitener and Fu Lai Tung
No. 19 (21-601-MPE94019) Farm Family Total Income by Farm Type,
Region and Size for 1990 (1994)
Saiyed Rizvi, David Culver, Lina Di Piétro and Kim O'Connor
No. 20 (21-601-MPE91020) Adjustment in Canadian Agriculture (1994) George McLaughlin
No. 21 (21-601-MPE93021) Microdynamics of Farm Size Growth and
Decline: A Canada-United States Comparison
Earnings in North America: Positioning for Trade Liberalization
-Barnard, Ray Bollman and Blaine Calkins
No. 23 (21-601-MPE92023) Potatoes: A Comparison of Canada/USA
Structure
Glenn Zepp, Charles Plummer and Barbara McLaughlin
No. 24 (21-601-MPE94024) Farm Structure Data: A US-Canadian
Comparative Review
Victor J. Oliveira, Leslie A. Whitener and Ray Bollman
No. 25 (21-601-MPE94025) Grain Marketing Statistics Statistical Methods
Working Paper Version 2
Karen Gray
No. 26 (21-601-MPE94026) Farm Business Performance: Estimates from
the Whole Farm Database
W. Steven Danford
No. 27 (21-601-MPE94027) An Attempt to Measure Rural Tourism
Employment
Brian Biggs
No. 28 (21-601-MPE95028) Delineation of the Canadian Agricultural
Ecumene for 1991
Timothy J. Wershler
No. 29 (21-601-MPE95029) Mapping the Diversity of Rural Economies: A
Preliminary Typology of Rural Canada
Liz Hawkins
No. 30 (21-601-MPE96030) Structure and Trends of Rural Employment:
Canada in the Context of OECD Countries
Ron Cunningham and Ray D. Bollman
No. 31 (21-601-MPE96031) A New Approach to Non-CMA\CA Areas Linda Howatson-Leo and
Louise Earl
No. 32 (21-601-MPE96032) Employment in Agriculture and Closely
Related Industries in Rural Areas: Structure and Change 1981-1991
Sylvain Cloutier
No. 33 (21-601-MPE98033) Hobby Farming – For Pleasure or Profit? Stephen Boyd
No. 34 (21-601-MPE98034) Rural Youth: An Overview Richard Lévesque
No. 35 (21-601-MPE98035) Employment patterns in the non-metro
workforce
Robert Mendelson
No. 36 (21-601-MPE98036) Rural and small town population is growing in
the 1990s
Robert Mendelson and Ray D. Bollman
No. 37 (21-601-MPE98037) The composition of business establishments in
smaller and larger communities in Canada
Robert Mendelson
No. 38 (21-601-MPE98038) Off-farm Work by Census-farm Operators: An
Overview of Structure and Mobility Patterns
Michael Swidinsky, Wayne Howard and Alfons Weersink
Prices: 1 copy Free 2 to 10 copies $50.00 11 to 25 copies $75.00 26 to 38 copies $100.00
TO ORDER:
METHOD OF PAYMENT:
*
MAIL(
PHONE3(
FAXAgriculture Division 1 800 465-1991 1 613 951-1680 Statistics Canada Charge to VISA or VISA, MasterCard 12th floor, Jean Talon Bldg. MasterCard. Outside and purchase orders Tunney’s Pasture Canada and the U.S., only. Please do not Ottawa, Ontario and in the Ottawa area send confirmation. K1A 0T6 call (613) 951-7134. A fax will be treated
Please do not send as an original order. confirmation.
:
INTERNET [email protected]L
1 800 363-7629Telecommunication
(Please Print) Device for the hearing Impaired Company Department Attention Title Address City Province ( ) ( ) Postal Code Phone Fax
E-mail address:
(Check only one)
q
Please Charge my:~
VISA~
MasterCardCard Number
Expiry Date
Cardholder (please print)
Signature
q
Payment enclosed $q
Purchase Order Number(please enclose)
Authorized Signature
Working Paper Number
Title Catalogue Number No. of copies
Total $
SUBTOTAL (please circle Canadian or U.S. funds)
Cnd./ U.S. $
$ Discount (if applicable)
GST (7%) (Canadian clients only, where applicable)
Applicable PST (Canadian clients only, where applicable)
Applicable HST (N.S., N.B., Nfld.)
GRAND TOTAL $
'PRICES: 1 copy Free 2 to 10 copies $50.00 11 to 25 copies $75.00 26 to 38 copies $100.00
'Prices are subject to change. To confirm current prices call 1 800 465-1991.
'Catalogue prices for clients outside Canada are shown in US dollars. Clients outside Canada pay total amount in US funds drawn on a US bank.
'Canadian clients pay in Canadian funds and add 7% GST and applicable PST or HST.
'Cheque or money order should be made payable to the Receiver General for Canada.
' GST Registration # R121491807