In-transit Data Analysis and Distribution in a Multi-Cloud
Environment using CometCloud
Ioan Petri, Omer Rana
School of Computer Science & Informatics
Cardiff University, UK
[email protected]
Javier Diaz-Montes,
Mengsong Zou, Manish
Parashar
Rutgers Discovery Informatics Institute
Rutgers University, USA
[email protected]
Tom Beach, Yacine
Rezgui, Haijiang Li
School of Engineering Cardiff University, UK
[email protected]
ABSTRACT
Many applications require data to be captured and processed in real time, migrating all the data to a central site prior to analysis, a procedure that can create significant overhead. Examples include the variety of sensor network-based ap-plications, where sensors interface with real world artifacts and must respond to physical phenomenon that cannot be predicted apriori. The amount of data likely to be gener-ated by a sensor and processing requirements in such ap-plications can not be pre-determined (as they are often de-pendent on the rate of change of the physical phenomenon being measured and potential occurrence of “trigger events” which are non-deterministic). We propose the use of a multi-layer Cloud infrastructure that distributes processing over both sensing nodes, multiple intermediate/gateways nodes and the more complex centralised data centre. Such layers need to work in coordination to ensure more reliable and efficient use of computing and network resources, prevent-ing the need to move data to a central location when this is not necessary and creatingdata processing pathsfrom data capture to analysis. We outline the basis for a decision function that evaluates: (i) where processing should be car-ried out; (ii) what processing should be undertaken centrally vs at an edge node; (iii) how processing can be distributed across multiple data centre locations to achieve QoS and cost targets. We present a prototype that has been implemented using the CometCloud system, deployed across three sites in the UK and the US and validate using an application which calculates energy flow in a Sports facility in Italy.
Categories and Subject Descriptors
H.4 [Information Systems Applications]: Miscellaneous; D.2.8 [Software Engineering]: Metrics—complexity measures, per-formance measures
Keywords
Data streaming, multi-level Cloud, building data analytics
1.
INTRODUCTION
There has been significant interest recently in cre-ating “multi-Clouds” or a Cloud-of-Clouds. Such in-frastructures are generally distributed and involve inte-gration of capability from a variety of different Cloud providers. The key benefits suggested for such an ag-gregation is: (i) reduced reliance on a single vendor’s infrastructure; (ii) improved fault tolerance (whereby failure in one Cloud system does not render the en-tire infrastructure inoperable); (iii) improved security – similar argument to fault tolerance, i.e. a breach in one Cloud system does not impact the entire infrastructure; (iv) the ability to utilise capability (and data) that may only be available in one Cloud system and not be eas-ily transferrable to another. Various efforts have been proposed to implement such multi-Clouds, ranging from research efforts focused on Cloud interoperability (e.g. the Open Cloud Computing Interface (OCCI) effort1at
the Open Grid Forum and the implementation of spe-cialist gateways to connect different Cloud systems), the development of a Cloud Operating System (CloudOS) to connect distributed Clouds (European FP7 “UNIFY” project2) to the use of specialist in-network capability to process data in network elements between different end points (GENICloud project3). Similarly, on-line sites such as CloudHarmony4 report over 100+ Cloud
providers that offer capability ranging from storage and computation to complete application containers that can be acquired at a price, primarily using service-based access models.
In previous work, the STACEE system [17] was devel-oped for dynamically creating storage distributed Clouds using edge devices, such as routers, routing switches, multiplexers, mobile phones, PCs/media centers, set-top boxes and modems. The functional architecture within STACEE makes use of edge device capacity in
1 http://occi-wg.org/ 2 http://www.fp7-unify.eu/ 3 http://groups.geni.net/geni/wiki/GENICloud 4 http://cloudharmony.com/
a Cloud using Peer-to-Peer (P2P) technology, thereby reducing energy consumption at a single site and max-imising user engagement with the system. With a four layer architecture, the system ensures a high level of communication, control, synchronization and data ac-cess. Additional work in this context included develop-ment of a distributed “Social Cloud” [18], which enables users to share heterogeneous resources within the con-text of a social network. The Social Cloud model as-sumes the existence of trust between users within such a system, thereby overcoming some of the restrictions to sharing that would arise within a more open environ-ment.
In this paper we describe how a distributed cloud sys-tem can be used to perform a number of different data analysis operations (in-situ vs. in-transit) based on pre-defined application requirements. Our prototype is im-plemented using CometCloud [2],[1] and demonstrated through an application fora whole building energy ulation using EnergyPlus. This time-step based sim-ulation package can be used to model heating, cool-ing, lightcool-ing, ventilation and other energy flows within a building. Our distributed Cloud is across three sites (Cardiff (UK), Rutgers and Indiana (USA)) – all host-ing EnergyPlus. The reminder of this paper is organised as follows: sections 1, 2 and 3 present the idea on in-transit data analysis and use of distributed clouds, pro-viding a key motivation for our research and analysing several related approaches. Section 5 presents our model identifying how CometCloud has been utilized. The evaluation of our implemented system is presented in section 5.4, with conclusion and future work in section 6.
2.
RELATED WORK
In-transit data analysis refers to the manipulation and transformation of data using resources in the data path between source and destination, and can be ex-tremely advantageous for data intensive applications. Various reactive management strategies for in-transit data manipulation have been undertaken [14]. Stud-ies have investigated the possibility of coupling these strategies with various application levels to create a co-operative management framework and in-transit data manipulation for data-intensive scientific and engineer-ing workflows [12]. Several in-situ system workflows study the problem of visualization for monitoring pur-poses. Recently, such systems facilitate the coupling of simulation codes with popular visualization and anal-ysis toolkits, such as VisIt [10] and ParaView [11], ex-posing a broader suite of analytics tools for undertaking simulations. The performance design for these work-flows are becoming increasingly important as they bal-ance between a number of parameters such as latency and run-time performance both for in-situ and in-transit workflows [12].
A method for optimising in-transit data analysis is to use Software Defined Networks (SDNs), where net-work control plane is decoupled and is directly pro-grammable. This migration of control, formerly tightly bound in individual network devices, into accessible com-puting devices enables the underlying infrastructure to be abstracted for applications and network services, which can treat the network as a logical or virtual entity. There are several monitoring tools based on SDN con-cept [15] which allow the development of more expres-sive traffic measurement application by proposing a clean slate design of the packet processing pipeline. These tools focus more on efficiently measuring traffic ma-trix using existing technology and aim to determine an optimal set of switches to be monitored for each flow. Topology-based analysis techniques for simula-tion data have been also intensively explored and used due to their efficient representation of the feature space of scalar functions. These techniques use various algo-rithms and graphs such as contour trees and merge trees and are mainly employed for encoding threshold based feature definitions and contribute in a number of large scale science applications [16].
The increasing volume of data generated by the ap-plications has added constraints on how easily and ef-ficiently it can be processed. Requiring the application to move the data to disk before processing can be com-pleted is not a viable mechanism at extreme scale and can have space and time constraints. Satisfying these requirements of data analysis can be challenging, espe-cially in large-scale and highly dynamic environments with shared computing and communication resources, where capability, capacity and costs for resources in un-determined [14].
3.
ARCHITECTURE
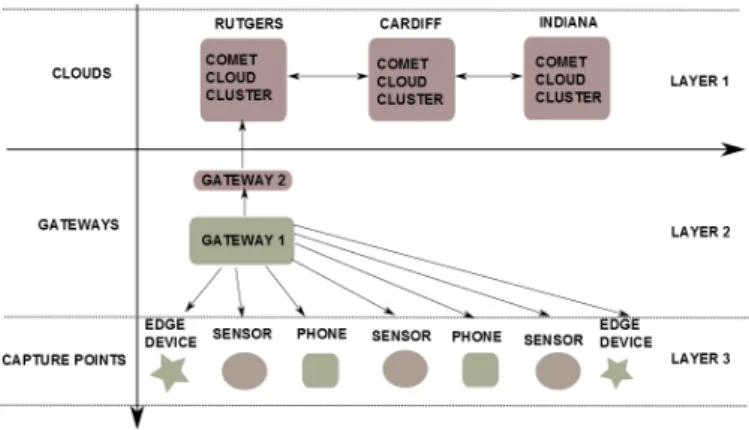
The distributed cloud system presented in Figure 1 consists of three main layers: (i)L3(Layer 3): data cap-ture point, (ii) L2(Layer 2): gateway nodes (in practice, multiple levels may exist) and (iii) L1(Layer 1): data centre/computing cluster. At L1 various data capture devices, such as sensors, mobile phones (with human input) record values based on an observed phenomena. These devices capture data with a pre-defined frequency (often dictated by the rate of change of the phenomenon being observed), depending on the capacity of the de-vice to record/collect data and also based on specific system requirements that need to be satisfied. A variety of standards have recently been proposed at L3, such as the Constrained Application Protocol (CoAP) [5] – sup-ported through Erbium REST interface and Contiki [4]. L2 involves the use of multiple gateways, which may be realised in practice using network switches and routers, fronted by OpenFlow software, which enables such net-work components to be remotely controlled. However,
such gateways may also be computational devices that aggregate data from a variety of L3 sensors. We envision a variety of devices (with varying degrees of complexity and controllability) to exist at L2. Finally, L1 contains more complex computing clusters and data centre pability, where greater computational and storage ca-pability is made available to application users, enabling more complex, generally long running, simulations to be carried out on the data.
Figure 1: System Architecture
Devices at L2 can carry out various operations on the raw data collected at L3 – such as performing stream op-erations (average, min, max, filtering etc) on a time/sample window of data, carrying out encryption of an incoming data stream or a variety of other data encoding/transcoding operations before forwarding this data for subsequent analysis to L1. Hence, devices at L2 retrieve data but can also perform some preliminary analysis. We envi-sion a distributed Cloud to be composed of devices at all of these levels, and with a need to coordinate work across these levels to achieve particular data analysis and performance targets. Each level also has its own objective function which influences the types of opera-tions carried out.
Distributing analysis of data across these different levels can improve the overall system performance and reduce the load on L1 infrastructure. We also observe that raw data collected at L3 may not necessarily be needed (in its entirety) at L1 – and aggregate opera-tions on the data (e.g. average, summation, etc) may be enough for the type of analysis required at L1. It is therefore not necessary to transfer all the collected data to the data centre (as often undertaken currently – even with the availability of recent systems such as Amazon Kinesis [6] or Google BigQuery [7] for streaming data), wasting network bandwidth and buffer/ storage space at levels L2 and L1. We identify the following classes of data analysis:
In-situ analysis: is carried out at L1, on a pre-agreed number of computing resource. This is the current mode of operation with many Cloud systems – whereby
data is aggregated at a central site prior to analysis. In streaming systems (e.g. Amazon Kinesis), data shard-ing is carried out prior to transfer of this to Amazon VM instances hosted at a particular data centre. This approach can have major disadvantages in terms of load and response time, as collection at a central server can be time consuming (and sometimes not necessary) – thereby limiting QoS targets that can be met in prac-tice.
Data-drop analysis: After data values are collected by edge devices, and sent over the network, the actual data analysis process starts when the data sets are dropped into a specific folder. Data-drop analysis is the ability to trigger on-demand analysis making use of elastic com-puting resources available at L1 (at the data centre). A key challenge in this type of analysis is to predict the number of computing resources needed (as data is dy-namically made available) based on heuristics or prior execution history. This type of analysis can suffer from the same QoS limitations at In-situ analysis, as it still requires data to be shipped over the network from L3 to L1 infrastructure.
In-transit data analysis: Identifies the type of distributed analysis carried out at L3 and (more generally) L2. In-transit analysis makes use of capability available in software defined networks to undertake partial analysis while the data is in transit from source (L3) to the data processing engine (generally L3). This approach can significantly improve overall analysis time (and limit use of resources at L1), as pre-analysis can help identify what needs to be carried out at L1. In-transit analysis therefore makes more effective use of computing capa-bility available at L2.
4.
DECISION PARAMETERS
In-transit data analysis can bring substantial benefits in terms of execution time and system performance es-pecially in cases when the system workflow is complex and involves different computational layers. As each layer has distinct computing capabilities (Figure 1), it is necessary to identify: (i) where analysis should be car-ried out; (ii) when to start the analysis. For instance, for edge devices data capture frequency and its impact on battery life is useful to identify, for gateways it is important to provide a certain level of performance in transferring data sets between L1 and L3 resources.
In addition to these functional objectives, it is also important to identify the properties of the data sets, such as data format used by edge devices and the data transfer time between layers. The decision process is influenced by the objectives of each architectural level. In our system the decision mechanism relies on: For Clouds Level: (i) Where to compute the tasks: (a) locally or (b) remotely; (ii) How many combinations to run giving the deadline and accuracy constrained
re-quired by the user. For Gateway Level: What task to schedule at this level in order to reduce the workload at the Cloud. For Capture Points Level: The required frequency over which sensors should provide values.
5.
APPLICATION SCENARIO
In our scenario we consider that a user job is de-fined as job : [input, obj, deadline], where input data is represented as [IDF, W,[param]], IDF represents the building model to be simulated, W represents the weather file required for the simulation, [param] de-fines the parameter ranges associated with the IDF
file that need to be optimised [param] = [ri →
(xm, xn)]. A jobobjtherefore encodes the optimisation
objective objective : [outV arN ame, min/max], defin-ing the name of the output variable to be optimised
outV arN ame and the target of the optimisation pro-cess min/max, min:minimising the outV arN ame or
max:maximising the outV arN ame.Deadline is a pa-rameters defining the time interval associated with the job submitted.
A job contains a set of tasks N = {t1, t2, t3, ..., tn}
mapped into tuples within the CometCloud tuple-space. Each task ti is characterised by two parameters ti →
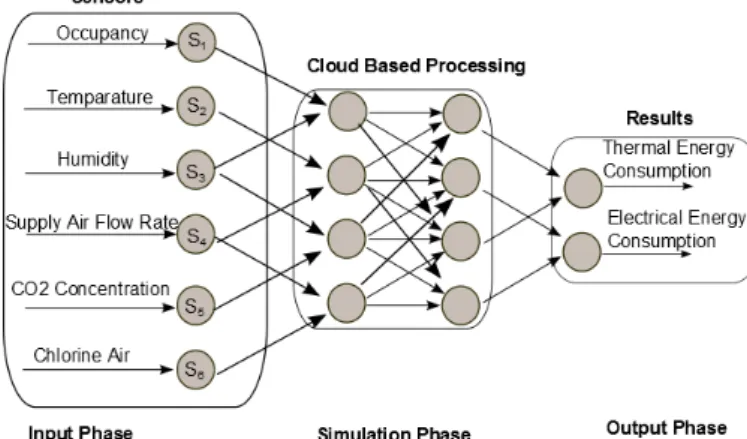
[ID, data] with the first parameter being a task iden-tifier and data represents one set of results (given a particular parameter range). /The application scenario used in this paper is based on EnergyPlus [3], a simu-lation engine that enables energy simusimu-lation of a built environment based on various inputs from sensors. The simulation output represents an optimum setpoint to be implemented within the building using suitable actua-tion mechanisms. We use sensor data from theSportE2
project pilot called FIDIA5. TheSportE2project, funded under the European FP7 ICT programme, focuses on developing energy efficient products and services dedi-cated to the needs and unique characteristics of sporting facilities.
Figure 2: Application Scenario
5
http://www.asfidia.it
5.1
Sensors Level
Each sensor in our pilot can communicate via a gate-way or can be directly linked (using wired infrastruc-ture) with the pilot automation server (identified as I/O to Automation Server (AS) in the table). Sensors are usually battery powered meters with a typical auton-omy. Sensors can measure: (i) indoor temperature and air temperature inlet – usually battery powered with a Modbus IP protocol connected to the AS gateway; (ii) Water Temperature using a regular I/O operation to the AS gateway; (iii) Indoor Humidity – battery powered, and communicating to the AS gateway; (iv) Supplied Air Flow Rate measured with a velocity sensor and us-ing I/O operations to the AS gateway.
5.2
Gateways Level - BMS and AS
There are two distinct gateways:(i) Building Manage-ment System (BMS) and (ii) Automation Server (AS). The BMS gateway is a server machine that controls the activities and spaces within the building. BMSs are most commonly implemented in large projects with extensive mechanical, electrical, and plumbing systems and are a critical component to manage energy demand. In addition to controlling the building’s internal envi-ronment, BMS systems are sometimes linked to access control (turnstiles and access doors controlling who is allowed access to the building) or other security systems such as closed-circuit television (CCTV) and motion de-tectors. The AS gateway is a hardware-based server that is factory programmed with StruxureWare Build-ing Operation software [8] (for instance). In a small installation, the embedded AS acts as a stand-alone server, mounted with its I/O modules with a small foot-print. In medium and large installations, functionality is distributed over multiple Automation Servers (ASs) that communicate over TCP/IP. Capable of coordinat-ing traffic from above and below its location, the AS can deliver data directly to you or to other servers through-out the site.
5.3
CometCloud Sites Level
Table 1: Parameters Range
Parameters P1 P2 P3 P4 Deadline
Before filter 16,18 0,1 0,1 0,1 30 Min/task After filter 16 0,1 0,1 0,1 30 Min/task
At this level, we have a CometCloud-based federa-tion of resources [19], where each site has access to a set of heterogeneous and dynamic resources, such as public/private clouds, supercomputers, etc. These re-sources are uniformly exposed using cloud-like abstrac-tions and mechanisms that facilitate the execution of applications across the resources. Each site decides
200 250 300 350 400 450 500
Rutgers Cardiff FutureGrid
Time (h
)
Not-Filtered Filtered
(a) Execution time
50 60 70 80 90 100 110 120 130 140
Rutgers Cardiff FutureGrid
Cost (m onetary units) Not-Filtered Filtered (b) Execution Cost 0 20 40 60 80 100 120 140 160
Build.A Build.B Build.A Build.B
Numbe r of Jobs 100%-Completed Not-100%-Completed Rejected Filtered Not Filetered (c) Jobs
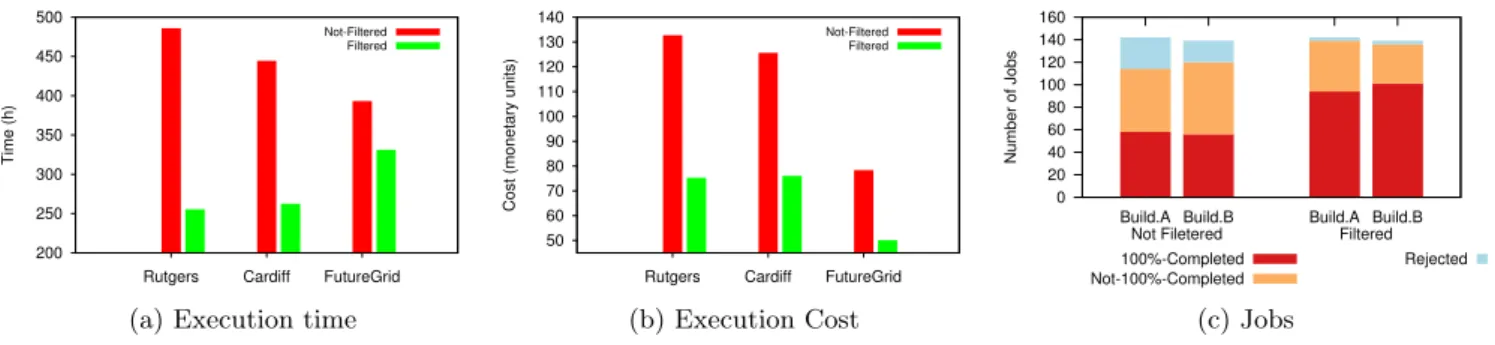
Figure 3: Summary of experimental results for use cases with filtering and without filtering. 3a collects the total execution time in each case; 3b collects the total cost spent on computing all jobs; 3c shows the number of rejected jobs, 100% Completed and Not 100% Completed jobs
on the type computation it runs, as well as the prices based on various decision functions that include factors such as availability of resources, computational cost, etc. This federation is dynamically created at runtime where sites can join or leave at any given time. Notably, this requires a minimal configuration at each site that amounts to specifying the available resources, a queuing system or a type of cloud, and credentials. We consider three sites in these scenario – one based at Cardiff, at Rutgers, and at Indiana. A federation site therefore refers to a deployment which is connected over a net-work and not co-located with a master node. Our sites are: Cardiff site: has a virtualized cluster-based infras-tructure with 12 dedicated physical machines. Each machine has 12 CPU cores at 3.2 GHz. Each VM uses one core with 1GB of memory. The networking infras-tructure is 1Gbps Ethernet with a measured latency of 0.706 ms on average. Rutgers site: has a cluster-based infrastructure with 32 nodes. Each node has 8 CPU cores at 2.6 GHz, 24 GB memory, and 1Gbps Ether-net connection. The measured latency on the Ether-network is 0.227 ms on average. FutureGrid site: make use of an OpenStack cloud deployment at Indiana University. We have used instances of type medium, where each instance has 2 cores and 4 GB of memory. The mea-sured latency of the cloud virtual network is 0.706 ms on average.
5.4
Experiments
We consider two use cases: in the first case, all in-formation collected by sensors is used to create jobs. In the second use case, information collected by sensors will be processed in-transit in the Gateway layer to filter out unimportant information (e.g. values out of range or certain combination of parameters that cannot lead to reasonable results) and then create jobs to be sent to federations sites level. In this case, one job might require less computation capability due to in-transit fil-tering. We explore the benefit of in-transit data analysis
by comparing differences between these two scenarios in terms of the total cost for each site to compute all jobs, the overall time spent and number of jobs completed successfully.
We consider sensors in two geographically distributed buildings that are collecting information about the sta-tus of the building and sending this information via their gateways. In order to better explore the behav-ior of in-transit data analysis and task distribution, we emulate the execution of the tasks and use a Poisson dis-tribution to periodically generate sensor collected infor-mation every 100 minutes. A job is generated after the gateway has received data from sensors. One job will produce multiple EnergyPlus computation sub-tasks. All the three sites, Rutgers, FutureGrid and Cardiff, bid for computing those jobs based on their available re-sources and how many sub-tasks they can finish before the deadline. No single winner will get all the sub-tasks. Instead, these sub-tasks will be distributed to all bidder sites based on their estimation of job completion dead-line. Each site will getbidN um/allSitesT otalBidN um
sub-tasks to compute. We allocate two local and two external workers to each site. Once a site consumes a list of sub-tasks, these tasks will be sent to workers to finish computation. These nodes are further used to compute the tasks that the master generated based on the parameters values received from buildings.
No filtering: From Table 1 we can see that the original
parameters we get from sensors includes four types of parameters which then gives a combination of 16 En-ergyPlus sub-tasks per job. Each EnEn-ergyPlus sub-task takes 30 minutes to compute on all three sites. In Fig-ure 3c, we can notice that due to resource limitation, some jobs are rejected because these sub-tasks cannot be completed before the deadline by these three sites. Among those accepted jobs,Not 100% Completed Jobs are those whose sub-tasks were completed within the given deadline. When no processing is applied to gate-way level, the load on the cloud increases, the number
of tasks to be processed is higher hence some jobs are rejected. The rejection of jobs is also caused by various other factors such as network speed, scheduling con-straints, placing multiple bids without knowing results of previous auctions, etc. Those100% completed jobs have all sub-tasks completed on time.
With filtering: After analysis of sensor data, we can
fil-ter out some of those unnecessary paramefil-ters. These parameters can have values which are out of a specific range or different values of these parameters can be col-lected as an average(i.e. distributed sensors recording indoor temperate in various parts of a room). In Ta-ble 1, we can find that the number of sub-tasks for each job is reduced to eight. In order to better compare with this use case with the previous one, in this experiment we assume that jobs are generated following the same time series as the previous experiment. This means the total number of jobs are the same, only the sub-task number per job is smaller. Figure 3c shows that the number of rejected jobs are reduced significantly after filtering. The percentage of Not 100% Completed Jobs in accepted jobs is also decreased. From Figure 3a, we can see that the total execution time for completing all jobs is decreased. We give a cost for each task in mone-tary units(m.u.)and consider that all sites use the same cost convention. The total execution cost also shows rapid decrease in Figure 3b. This is mainly because the number of sub-tasks per job is reduced from 16 to eight after filtering part of the parameters. Therefore, we can prove the necessity of performing in-transit data analysis at different layers.
6.
CONCLUSION
In data-intensive applications executing tasks in a distributed way can lead to significant benefit – reduc-ing the need to capture all the data at a sreduc-ingle site (e.g. at a data centre). Calculating energy in build-ings is one example of such an application, where the flow of data to be processed presents challenges due to the computational requirements and timing constraints. We describe an implementation of a distribute Cloud using CometCloud. We show how our distributed cloud model facilitates EnergyPlus simulations to be deployed with data recorded from building sensors and how var-ious analysis can be applied at intermediate architec-tural layers to ease the energy optimization of buildings. We have presented the design and implementation of the proposed approach and experimentally evaluated a number of scenarios where the execution of EnergyPlus tasks. The experimental results have shown a number of benefits that our system provides with regards to task completion and costs.
7.
REFERENCES
[1] CometCloud Project. http://www.cometcloud.org/. Last accessed: August 2013.
[2] M. Parashar, M. Abdelbaky, I. Rodero, A. Devarakonda, ”Cloud Paradigms and Practices for Computational and Data-Enabled Science and Engineering”, IEEE Computing in Science and Engineering (CiSE) Magazine, to appear. [3] N. Fumo, and P. Mago, and R. Luck, “Methodology to
Estimate Building Energy Consumption Using EnergyPlus Benchmark Models.” Energy and Buildings; (42:12); pp. 2331-2337, 2010.
[4] M. Kovatsch, “Erbium REST Engine and CoAP implementation of Contiki”.
http://people.inf.ethz.ch/mkovatsc/erbium.php. Last accessed: March 2014.
[5] Z. Shelby, K. Hartke and C. Bormann, “Constrained Application Protocol (CoAP)”, draft-ietf-core-coap-18. Available at:https:
//datatracker.ietf.org/doc/draft-ietf-core-coap/. Last accessed: March 2014.
[6] Amazon Kinesis. Available at:
http://aws.amazon.com/kinesis/. Last accessed: March 2014.
[7] Google BigQuery. Available at:
https://developers.google.com/bigquery/Last accessed: March 2014.
[8] StruxureWare Building Operation. Available at:
http://www2.schneider-electric.com/sites/corporate/ en/solutions/struxureware/Last accessed: March 2014. [9] Bhat, M. Parashar, M. Khandekar, N. Kandasamy, and S.
Klasky, “A Self-Managing Wide-Area Data Streaming Service using Modelbased Online Control,” in 7th IEEE Int. Conf. on Grid Computing (Grid 2006). Barcelona, Spain: IEEE Computer Society, 2006, pp. 176–183.
[10] J.-M. F. Brad Whitlock and J. S. Meredith. Parallel In Situ Coupling of Simulation with a Fully Featured Visualization System. In Proc. of 11th Eurographics Symposium on Parallel Graphics and Visualization (EGPGVˇS11) , April 2011.
[11] N. Fabian, K. Moreland, D. Thompson, A. Bauer, P. Marion, B. Gevecik, M. Rasquin, and K. Jansen. The paraview coprocessing library: A scalable, general purpose in situ visualization library. In Proc. of IEEE Symposium on Large Data Analysis and Visualization (LDAV), pages 89
˝
U96, October 2011
[12] K. Moreland, R. Oldfield, P. Marion, S. Jourdain, N. Podhorszki, V. Vishwanath, N. Fabian, C. Docan, M. Parashar, M. Hereld, M.E. Papka, and S. Klasky, Examples of in Transit Visualization, ˇT Proc. International Workshop Petascale Data Analytics: Challenges and Opportunities (PDAC ˇS11),Nov. 2011
[13] Janine C. Bennett et al. “Combining in-situ and in-transit processing to enable extreme-scale scientific analysis”. In Proc. of the Int. Conf. on High Perf. Computing,
Networking, Storage and Analysis (SC ’12). IEEE Computer Society Press, Los Alamitos, CA, USA
[14] H. Kim and N. Feamster, ¸SImproving network management with soft- ware defined networking, Communications Magazine, IEEE , vol. 51, no. 2, pp. 114 ˝U119, 2013. [15] P.-T. Bremer, G. H. Weber, J. Tierny, V. Pascucci, M. S.
Day, and J. B. Bell. Interactive exploration and analysis of large-scale simulations using topology-based data
segmentation. IEEE Transactions on Visualization and Computer Graphics, 17:1307 ˝U1324, 2011
[16] D. Neumann, C. Bodenstein, O. F. Rana and R.
Krishnaswamy, “STACEE: Enhancing Storage Clouds using Edge Devices”,Proceedings of the ACM/IEEE workshop on Autonomic Computing in Economics (ACE), alongside ICAC 2011, Karlsruhe, Germany, June 2011. ACM Press. [17] K. Chard, K. Bubendorfer, S. Caton and O. Rana, “Social
Cloud Computing: A Vision for Socially Motivated Resource Sharing”,IEEE Transactions on Services Computing, IEEE Computer Society Press, 2011.
[18] I. Petri, T. Beach, M. Zou, and et. al. Exploring models and mechanisms for exchanging resources in a federated cloud. In Intl. Conf. on cloud engineering (IC2E 2014), 2014