Simple Network Management provisioning based
on Quality of Experience feedback
Ren´e Serral-Graci`a, Eva Marin-Tordera, Marcelo Yannuzzi,
Xavi Masip-Bruin, Sergi S´anchez
Advanced Network Architectures Lab,
Technical University of Catalunya (UPC), Spain
{
rserral, eva, yannuzzi, xmasip, sergio
}
@ac.upc.edu
Abstract
This paper presents a promising Autonomic Network Management System (ANMS) that allows Service Providers (SPs) to perform efficient network resource provisioning with their Network Operators (NOs). The novelty of our ANMS is that it offers an starting point to use the end-users perceived quality as a metric to manage the network resources. We show that our system is capable of achiev-ing considerable reductions in the operational costs of SPs, while keepachiev-ing proper bounds in the end-user satisfaction for the offered multimedia services.
1
Introduction
Over years, Network Operators (NOs) have heavily relied in overprovisioning in order to provide network services to their customers. However, Internet traffic doubles every two years, so there are many arguments against overprovisioning, which seems unsustainable both in terms of operational and power consumption costs. Additionally, the emergence of Virtual Network Operators (VNOs)—which do not own any network infrastructure but lease the required network resources from NOs—offers a cheaper and competitive alternative to network access. As a consequence, NOs are seeking for novel techniques and value added services to avoid being relegated to mere network carriers, and to make a more efficient use of their resources. Furthermore, VNOs require more tunable traffic provisioning methods to reduce the operational costs, and to offer more competitive resource provisioning alternatives to Service Providers (SPs).
At the same time, SPs hold large data centers and clusters to offer different services to end-users, from on-line gaming to multimedia streaming solutions. Many SPs do not own any carrier infrastructure, and thus adopt the overprovisioning imposed by the NOs, and by extension by VNOs, as the option to offer some guaranties in their ser-vices. The imposition of such a model is responsible for the limited adoption of Quality
of Service (QoS), since overprovisioning is easier to implement and to manage. Op-posed to this, the Internet is becoming an interactive and multimedia oriented network, encouraging the development of novel, fully distributed and lightweight quality assess-ment techniques replacing the legacy (and mostly unused) QoS models. In particular, Quality of Experience (QoE) is gathering the attention from the research community. Jointly with this spreading of multimedia content—which according to [1] it amounts to a∼27% of the total Internet traffic and growing—plus the increase in CAPEX and energy consumption caused by network overprovisioning, it is becoming apparent that a new model for network management is required for NOs, for VNOs, and for SPs.
In this paper we propose a promising cross-layer Autonomic Network Management strategy which allows a SP to dynamically adjust the network resource reservation with its NOs (or VNOs) depending on the end-users perceived QoE of the offered service. Our approach proposes a lightweight mechanism to monitor the QoE at the end-users’ applications, using in-band signaling with the data center to update the resource reser-vation with the NO (or VNO) at the network layer accordingly.
We evaluate the performance of our proposal from two different perspectives; first we study the periods with unsatisfied end-users when using our system, compared to the case of having fixed bandwidth allocation. Second, we compare the reduction in operational costs in the SP premises also against the case of fixed bandwidth. We show that even with lower operational costs, the end-user satisfaction is increased.
The rest of the paper is structured as follows. In Section 2, we discuss the related work in the area. We continue in Section 3 with the main contribution of this work, that is, the proposed cross-layer management system. Next, we focus on the simulation driven evaluation of the proposed strategy, highlighting as a use case the performance of our system in a video-streaming scenario. Finally, in Section 5, we conclude and outline the open lines in our research.
2
Related Work
Autonomic Network Management (ANM) is an emerging research topic with many open issues [2]. NOs and SPs require autonomic methods to reduce the costs and au-tomating the management of their infrastructure as well as to control and optimize the utilization of resources. In general, such systems are focused on well-known manage-ment issues, e.g., resource managemanage-ment [3], QoS/SLA assessmanage-ment [4], etc.
Our strategy is designed to complement other ANMS, offering a promising per-spective for dynamic resource reservation. Indeed, we consider cross-layer data by gathering information about the end-users satisfaction—in our approach these data is gathered directly from the end-users’ applications without any human intervention— and then performing the required reservation and/or release of resources from the NO (i.e., the IP layer and below). This task is typically carried out through QoS mecha-nisms, requiring highly complex centralized networking infrastructures for managing
the data acquisition. To overcome the scalability limitations of these solutions, our approach moves the computational burden of quality assessment to the end-users’ ap-plications, which transparently report the system status using in-band signaling.
Since we use the end-users’ applications as quality monitors, their location is op-timal to measure the user-perceived QoE. QoE stands for the end-user perception of a given service, which can be computed using the Mean Opinion Score (MOS) with techniques such as [5] adapted for video traffic. This paper does not intend to propose new methods of computing the QoE, but rather to exploit existing techniques to provide feedback about the quality offered by the SP, so that the latter can dynamically reserve or release of resources from its NOs to meet its quality policies.
3
Cross-layer Management
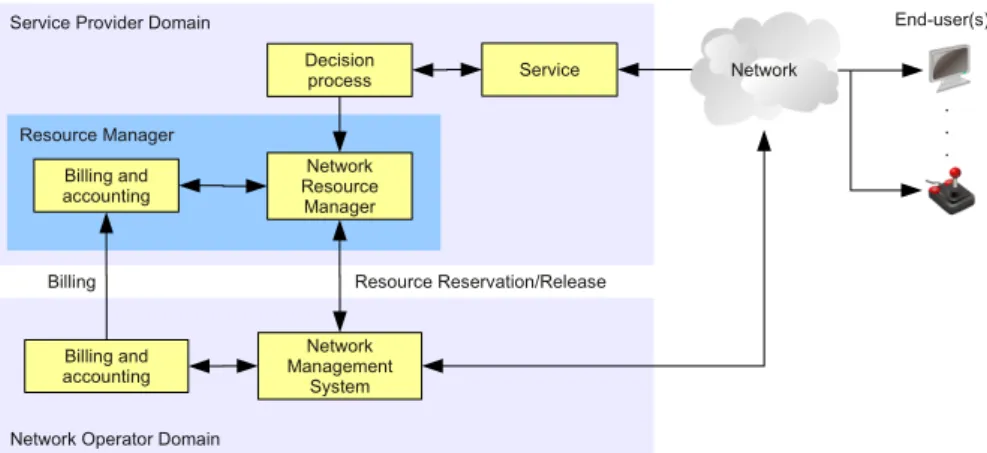
In this section, we focus on the description of the main contribution of this paper. In particular, we detail the ANMS proposed to perform on-line resource management from the SP towards the NO (vertical signaling) in order to guarantee that the SP’s end-users are properly perceiving the offered service (horizontal signaling). As we detail in Fig. 1 the system is composed of the following building blocks:
• Multimedia Service:besides delivering the actual service to end-users, this block also acquires the end-users perceived QoE (horizontal signaling).
• Decision process: it analyzes the perceived QoE reported by the multimedia service and decides whether to ask for more resources (vertical signaling), as detailed later in Alg. 1.
• Resource Manager: this block is in charge of the resource management in the data center itself. Since we only focus on the interaction with the NO, in our work we assume that the SP already has mechanisms to monitor and control the data center, along with mechanisms to compute the resources needed by the system to offer the service. Within the Resource Manager we identify:
– Network Resource Manager (NRM):NRM uses the results obtained from the decision process to compute the current service status. New require-ments generating specific requests will be sent to the NO providing auto-nomic capabilities to on-line reservation (or release) of the necessary net-work resources.
– Billing and accounting: the reservation or release resources is finally trig-gered depending on the business model of the SP.
Regarding the Network Operator domain, the blocks interacting with the SP are the Billing and accounting, which is responsible to charge the SP depending on the pro-visioned resources, and the Network Management System, which enforces the on-line
Network Operator Domain Service Provider Domain
Network Management System Decision process End-user(s) Network Resource Manager Resource Reservation/Release Billing and accounting Service Billing Network . . . Resource Manager Billing and accounting
Figure 1: Building blocks of the Cross-Layer QoE aware ANMS.
configuration of network devices to comply with the SP requirements. In the following sections, we detail the specific behavior of the QoE assessment within the Multimedia Service block, the Decision Process, and the Network Resource Manager, excluding the rest of the blocks since they have been studied previously in the literature in works such as [3, 6], and are out of the scope of this paper.
3.1
Per-service QoE assessment
Considering the current usage of the Internet, all the services have a potentially high number of end-users, which makes very hard to monitor and analyze in real-time the quality from a centralized location. Despite of this, all such services follow in one way or another the client/server paradigm, which implies that the end-user needs a specific client-side application, namely, a web browser with JavaScript support, or a native application installed to interact with the service. It is thus clear that, these applications offer a vantage point to analyze the delivered service, and since they are running at the end-users’ premises, they are good candidates to perform the monitoring. On top of that, using the end-nodes as measurement entities inherently distributes the load of the QoE computation. As a consequence, our approach proposes to upgrade such client-side applications in order to perform the QoE assessment. Using the QoE as a trigger provides a more accurate method for resource reservation than simply using QoS—or available bandwidth—given that it can measure QoE metrics such as response time, or perceived video quality, which cannot be computed with traditional network-based QoS approaches.
For each type of service(s)the SP defines a series of constraints, which are embed-ded within the client-side application and determine how the QoE is computed. The system then defines a quality thresholdφ(s)∈[0,1]that determines the lower
accept-able bound for the service quality; the higherφ(s)the better is the experienced quality. As we shall show in next section, this limit is used to manage the network resources in the SP.
3.2
The decision process
As discussed above, the decision process is one of the key parts of our infrastruc-ture. In particular, it is in charge of deciding whether the resources used are well suited for the current load depending on the QoE observed by the end-users. In our proposal, the decision process solely uses the perceived QoE as a metric to decide whether to reserve resources, since the decision module has neither knowledge of the current re-source reservation nor about bandwidth requirements, such knowledge is in the NRM. This allows a clean design with a generic NRM, while keeping a per service decision process specifically developed to assess the QoE offered.
In a context with thousands of concurrent users, obtaining the perceived QoE of a single end-user is of no practical interest from the SP point of view. On the con-trary, having several end-users with degraded quality is relevant, as it might alter the popularity of the service (and of the SP itself).
Hence, we propose the following Assessment strategy, the decision module peri-odically queries the Service module (cf. Fig. 1) to obtain the perceived QoE for each end-user. The decision process keeps track of the end-users perceived quality in two different ways, depending whether the QoE degradation is localized (i.e., the issues occur within the same regional zone, or within the same network prefix), or global (i.e., there are insufficient reserved resources in the whole system to cope with current end-users’ demands). In our initial approach we only consider single domain networks, leaving the study of multi-domain scenarios for future work.
The next step is to decide when a service is considered locally or globally degraded. To this end, we define two different quality thresholds, namelyρ(global) andσ(local), as follows:
Definition 1 Let ρ(s) ∈[0,1] be the threshold from where a service S is considered globally degraded and more resources are required for the whole SP.
More specifically,ρ(s)is the permitted bound of unsatisfied end-users over the total
using the service. Hence, the goal of the system is that, at any instant of time, the ratio of unsatisfied usersυ(s)is such thatυ(s)≤ρ(s), whereυ(s)is computed using Eq. 1:
υ(s)=∑
n−1
i=0
U
in (1)
In Eq. 1,nis the amount of end-users of the service, and
U
irepresents whether the user is unsatisfied, withU
icomputed as detailed in Eq. 2:U
i=(
1 ,i f q(is)≤φ(s) (Useriis unsatisfied)
Algorithm 1decisionProcess
Input: st{st: End-user service status}
Output: triggera request to the NRM trigger←∅
updateStats(
S
,st){Update the system status withst}5: ifυ(s)>ρ(s)then
trigger←Dall,υ(s) E
{Set Global trigger}
else
for all j∈
S
Pdoifω(js)>σ(s)then
10: trigger←trigger∪Dj,ω(js) E
{Set Prefix trigger}
end if end for end if
whereqi is the quality experienced by theith end-user, andφ(s) has been previously
defined in Section 3.1 as the lower acceptable bound for the service quality.
Definition 2 Letσ(s)∈[0,1]be the threshold from where a service is considered
de-graded within a network prefix, and more resources are required towards that specific network.
For localized degradations, the goal is that for any network prefix j∈NO, the ratio of unsatisfied usersω(js), over those using the service from the local prefix j, is such
thatω(js)≤σ(s). Let’s denote
P
={P1, . . . ,P|P|}as the set of local prefixes using theservice. Then, at a given instant of time, the ratio of locally unsatisfied end-usersω(js)is computed analogously toυ(s)in Eq. 1, but considering only the end-users using prefix
j. Let
S
Pbe a local status descriptor, containing the ratios of unsatisfied users for eachprefix j∈NO. Likewise, let
S
PC be the status descriptor containing the ratios of the overall unsatisfied users. In our system, the ratios of unsatisfied users are stored in a system wide status descriptorS
, which holds the status for all the prefixes and users currently in the system:S
=S
P∪S
PC.Algorithm 1 outlines the operations performed by the decision process. The algo-rithm first updates the overall status
S
of the data center with the new set of values received from the Service module. After this, the system computesυ(s) (Eq. 1), anddecides if a global resource request should triggered to the NRM. In case that the num-ber of potentially unsatisfied users is below the thresholdρ(s), the algorithm follows with the assessment ofω(js). In this case, the system schedules as many requests as
local prefixes under service degradation. As it can be observed, the decision process does not consider the release of resources, which is deferred to the NRM.
3.3
Network Resource Manager
The NRM is in charge of interpreting the values obtained by the decision process, i.e., reserve or release the required resources, and receive feedback about the reserva-tion status from the NO. It might be argued that relying on resource usage (e.g., used bandwidth) is enough to provide a proper estimate of the end-users’ perception. How-ever, bandwidth usage does not consider events such as lost frames, or end-user wait times for the service, which are critical from the end-user point of view. Additionally, having per end-user QoE information can be used to internally improve the data center behavior, e.g., increasing the priority of the processes serving the unsatisfied end-users or, as we discuss in this work, to manage the network resources.
Unlike the decision process, the NRM considers two different aspects regarding the system quality; first the overall resource usage, and second the overall end-user satisfaction. Regarding the resource usage, the system proactively sends a request for more resources towards the NO before the network reaches an overload situation. To reduce the number of updates, the resources are requested in blocks of fixed sizeδ, in accordance to the policies imposed by the NO. Regarding the second aspect, whenever the end-user satisfaction drops below the specified boundsρ(s)orσ(s), the NRM will
ask for more resources in case the system is close to overloading. As a consequence, the NRM will merge in a single request operation the information obtained from the used network resources (by the Resource Manager) and the satisfaction ratio (from the decision process) with the following criteria:
• If the current system loadL(t)is close to the reserved resources
R
(t), that is, L(t)≥αR
(t), where α∈[0,1)is the threshold to avoid network overloading.Then the system reservesk bandwidth blocks complying withkδ≥[1+ (1− α)]
R
(t).• If the service requires tighter network constraints, i.e., there are still resources but the ratio of unsatisfied end-users is higher thanρ(s)orσ(s), the SP must increase
the priority of the flows. Such priority increase is usually mapped by the NO to different classes of service, generally classified into four different categories, namely,Gold,Silver,BronzeandBest effort.
Once the requested resources are determined, the system must compute the cost of reserving these resources, and depending on the available budget (or on the reservation policies) the request can be accepted or not. Hence, we propose the followingResource allocation and release policy.
Since the required amount of resources in most services depends on the number of end-users, we use this information to determine the future requirements in terms of resources. The goal of the allocation policy is to minimize the ratio of unsatisfied end-users. As a consequence, the algorithm must quickly react to any potential overloading of resources, while it can have a looser behavior for the release of resources. To this end, we propose two different mechanisms, one suited for Increasing (I) the resource
reservation, and the other one for Decreasing (D) it. This behavior is modeled in our system with the expression presented in Eq. 3. Letr(t)denote the amount of required resources at a given instant of timet. The policies that we use are based on linear combinations of the history ofr(t)as follows:
LI(t+1) = Θ0r(t) +Θ1r(t−1)
LD(t+1) = Φ0r(t) +· · ·+Φ3r(t−3)
(3)
As shown in Eq. 3, for the the increase or release of resources we use the last two or four samples ofr(t), respectively. The weights in each case are such that:∑1i=0Θi=1 and∑3j=0Φj=1. Thus, ifLI(t+1)≥α
R
(t), thenR
(t+1) = [1+ (1−α)]LI(t+1), and the system asks for more resources as discussed previously. Otherwise, in the case thatLD(t+1)≤αR
(t), thenR
(t+1) =R
(t)[1−12LD(t+1)]when 21LD(t+1)R
(t)>δ, which produces a stepwise smooth decrease of the allocated resources.
4
Performance Evaluation
In this section, we evaluate our proposal from two different perspectives. First, we detect the periods with end-user unsatisfaction when using our system, and second, we analyze the reduction in the operational costs observed by the SP. In both cases, we compare our solution against the fixed bandwidth allocation currently offered by NOs. As a proof of concept, we validate our system by simulating a video streaming service provider with clients requesting a video in real-time. More specifically, the videos have a Constant Bit Rate requirement of 900Kbps, and the users enter and leave the system randomly watching videos with a duration from one minute to one hour. The client applications compute the video quality transparently, using the technique developed in [7], i.e., computing the delivery delays and the packet losses directly from the video frames, and thus assessing the perceived video quality from a single measurement point. This information is sent to the SP, which computes the ratios of satisfactionυ(s) andω(js), and decides whether to change the resource reservation.
In order to simplify the exposition, we only show here the results for global quality degradations (υ(s)). The simulations of per-prefix degradation lead to similar results.
The simulations compare our approach with the fixed bandwidth allocation present today in SPs. In the set up environment we simulated various flash-crowd events with the following criteria: each simulation lasts around 45 minutes, each flash-crowd event has a duration range spanning from 5 to 10 minutes, e.g., when a specially appealing video is submitted, and there are 5 flash-crowd events per simulation. The rest of the time the average number of users is around one order of magnitude smaller than during the flash-crowd (the overall number of users in the system varies from 1000 to 16000). With these conditions, we run five different simulations changing the number of flash-crowd events that demand more resources than allocated by the system in the case of fixed bandwidth allocation. That is, the amount of flash-crowds requiring more
resources than the initially allocated ranges from 1 to all 5. To gather the results, we monitor the allocated bandwidth through reservation requests, the monthly price of the provisioning as detailed in [6], and the periods with service degradation. In particular, we monitor the ratio of service degradation on the system.
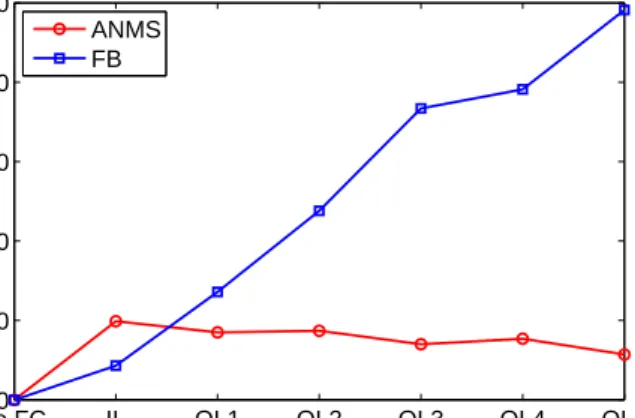
Our findings are summarized in Fig. 2, where we show both the case of using our Autonomic Network Management System (ANMS) and using fixed bandwidth (FB). The figure shows in the X-Axis the type of flash-crowds, from the trivial case of not having crowds, to the case of having a highly congested site with up to 5 flash-crowds overloading the system during long time periods. While the Y-Axis details the percentage of periods with unsatisfied user.
No FC.0 IL OL1 OL2 OL3 OL4 OL5 10 20 30 40 50 Flash Crowd Periods with υ (s) > ρ (s) (%) ANMS FB
Figure 2: Comparison in fracion of time with unsatisfied users
As it can be observed, our system generally outperforms the fixed bandwidth allo-cation for the different amount and intensity of flash-crowds. In particular, the amount of time the service is degraded in our system for all the users is independent of the intensity of the flash-crowds, while in the case of having fixed bandwidth it is strongly related, as expected, with the congestion level, in the table it can be noted that the periods with service degradation are always below 10% for our ANMS, raising up to
∼50% for the fixed bandwidth. Another aspect worth noticing is that even with flash-crowds within the provisioned limits, there are cases that cause service degradation. The reason for this behavior is that the resource requirements are close to the ones reserved (e.g., link load higher than 80%), so the network buffers and the jitter of the video flows derive in mild service degradation, which in some cases cause theυ(s)to
raise above the thresholdρ(s).
Aligned with the above discussion, the maximum interval with service degradation in the case of having fixed bandwidth is generally as long as a whole flash-crowd period (around 300 seconds), and it is always longer than the one observed on our system, which is bounded by the adaptation to the load demand derived from Eq. 3. Another aspect to consider is the amount of time the system is underprovisioned, i.e., periods
No FC. IL OL1 OL2 OL3 OL4 OL5 1000 2000 3000 4000 5000 6000 7000 8000 9000 10000 Flash Crowd
Average reserved bandwidth (Mbps) ANMS FB
(a) Average Reserved Bandwidth
No FC. IL OL1 OL2 OL3 OL4 OL5
10000 12000 14000 16000 18000 20000 22000 24000 26000 28000 30000 32000 Flash Crowd
Estimated (monthly) cost
ANMS FB
(b) Monthly Cost
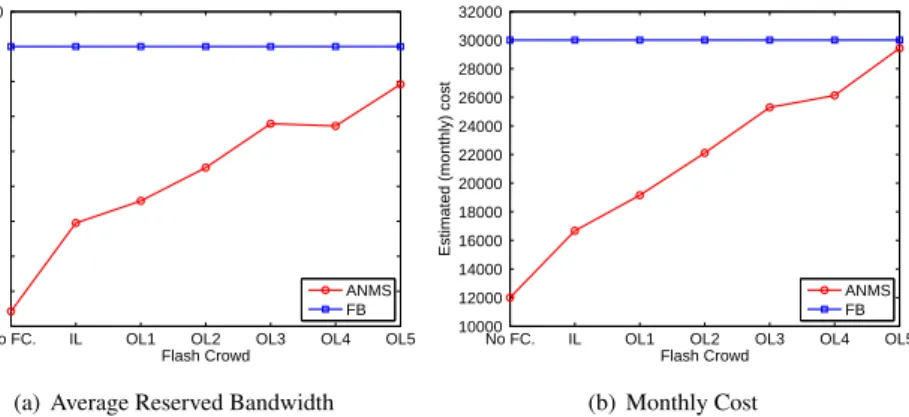
Figure 3: Comparison between ANMS and fixed bandwidth reservation
with severe service degradation, which is in all the cases below 3% for our solution, while it raises up to∼47% when using fixed bandwidth. Regarding the used bandwidth and the operational cost our solution, even with constant flash-crowd events, is able to outperform the fixed bandwidth while still reducing the service degradation periods.
To complement Fig. 3, in Fig. 3(a) and 3(b), we detail the average reserved band-width and the monthly operational cost caused by the resource reservations for each simulation. In the figure the X-Axis states the different traffic profiles, i.e., No-Flash Crowd, Flash-crowd within limits (IL) and the different out of limits (OL) events.
As it can be observed, the FB has both constant bandwidth reservation and monthly cost. While using ANMS the bandwidth and the estimated cost are dynamically ad-justed to cope with the particular demands of each simulation.
5
Conclusions and Future Work
In this paper, we presented a promising proactive approach for Service Providers to efficiently manage traffic provisioning jointly with the Network Operator. We use the offered QoE as the trigger to perform the resource reservation, given its more efficient mechanism compared with classical QoS based solutions. The motivation behind the proposal is the increased complexity in terms of cost for NOs to provide overprovi-sioned networks, and the need of SPs of more efficient and accurate means of resource provisioning, while delivering a reliable service and reducing the operational costs of the network.
To evaluate the performance of our ANMS we performed a series of simulations with a different set of flash-crowd and high load scenarios that demonstrate that our Cross-Layer ANMS can, simultaneously, reduce the required network resources and its operational costs, while offering a better service than the classic fixed bandwidth reservation.
Service Providers and Network Operators to implement the system while maintaining a feasible economic model for both parties. Related to this, we plan to extend the platform to multi-domain scenarios.
Acknowledgement
An extended version of this paper has been submitted to Globecom 2010.
This work was partially funded by Spanish Ministry of Science and Innovation under contract TEC2009-07041, and the Catalan Government under contract 2009 SGR1508.
References
[1] Cisco Systems White Paper. “Cisco Visual Networking Index—Forecast and Methodology, 2007–2012”, pages 1–15, June 2008.
[2] Nancy Samaan and Ahmed Karmouch. “Towards autonomic network manage-ment: an analysis of current and future research directions”. Communications Surveys & Tutorials, IEEE, 11(3):22–36, Quarter 2009.
[3] Vlad Nae, and et. al. “Efficient management of data center resources for mas-sively multiplayer online games”. SC ’08: Proceedings of the 2008 ACM/IEEE conference on Supercomputing, pages 1–12, 2008.
[4] Ren´e Serral-Graci`a, and et. al. “Network performance assessment using adaptive traffic sampling”.IFIP Networking, LNCS 4982:252–263, Singapore, May 2008.
[5] Jirka Klaue, and et. al. “EvalVid - A Framework for Video Transmission and Quality Evaluation”. InProceedings of the 13th International Conference on Modelling Techniques and Tools for Computer Performance Evaluation, pages 255–272, 2003.
[6] Hao Wang, and et. al. “Optimal ISP subscription for Internet multihoming: al-gorithm design and implication analysis”. Proceedings IEEE INFOCOM 2005, 2360–2371, March 2005.
[7] Ren´e Serral-Graci`a and et. al. “Packet Loss based Quality of Experi-ence of multimedia video flows”. R. Rep. http://personals.ac.upc.edu/ rser-ral/research/techreports/psnr mos.pdf, 2009.