Peace River Manasota Regional 2008 HBMP Annual Data Report Water Supply Authority May 2009
Suggestions for Using Adobe Acrobat
to Read this Report
The following is a list of suggestions that you may want to consider
when using Adobe Acrobat to view this document and follow the
included links to the report’s graphics and tables.
1. This report was organized using version 8.1.2 of Adobe Acrobat. You may receive a warning when opening the document using an older version of the Adobe Acrobat Reader – however, you can probably skip the warning without seeing any problems. We have tried using older versions back to Adobe 4.0 without any noticeable problems. Those familiar with using older Adobe Acrobat versions shouldn’t encounter any problems. However, you can download a free new version of the Adobe Reader from the web, or you can install the free reader included on this CD, in the Abode Acrobat Reader folder.
2. Links to figures, tables at the back of the document, or particular sections are indicated by the use of bold, blue lettering. When you move your mouse over these links a hand will appear, and left clicking the mouse will take you there.
3. However, to get back to the current location you need to have “return to previous page” tool on your Adobe Acrobat tool bar enabled. Clicking this will take you back to the main text after you have looked at the linked figure or table. (If you do not have this feature enabled on your tool bar, you can add it by going to tools/customize/and then adding a check to “previous page” found under the “page navigation” tools.)
4. You can further navigate through the document by opening the “Bookmarks” on the left hand side of the Adobe Acrobat Reader. There you will find bookmarks that are linked to all the major sections of the document as well as all the tables and figures. It is recommended that you keep the bookmarks open while reading the document. You will find the bookmarks a convenient method of navigating through the report. 5. Finally, you may find reading the document using the links easier if you view the
document as single pages of a book, rather than using the default continuous page setting. This is a matter of preference so you may whish to try both alternatives. (To reset the view to single pages, go to view/page display and select “single page”.)
Peace River Hydrobiological
Monitoring Program
2008 HBMP Annual Data Report
Required by
Southwest Florida Water Management District
Water Use Permit 20010420
Prepared for
Peace River Regional Water Supply Facility
Peace River Manasota Regional
Water Supply Authority
6311 Atrium Drive, Suite 100 Bradenton, Florida 34202
Prepared by
5300 West Cypress Street, Suite 300 Tampa, Florida 33607-1712
Peace River Manasota Regional i 2008 HBMP Annual Data Report Water Supply Authority May 2009
Acknowledgments
The raw data, as well as the methods sections, presented in this report for the calendar year 2008 were provided by each of the contractors responsible for conducting specific elements of the Hydrobiological Monitoring Program.
• EarthBalance (Florida Environmental) – was responsible for all in situ water column physical measurements and the collection of water chemistry samples for both the “fixed” and “moving” station elements of the HBMP.
• U.S. Geological Survey (Tampa Office) – was responsible for all data collected at the two tide gages located in the lower Peace River that continuously collect data at 15 minute intervals. Measurements at each gaging location included measurements of: 1) surface and bottom conductivity; 2) surface and bottom water temperature; 3) and tide stage (water depth).
Lower Peace River Continuous Recorders
1. The Harbour Heights gage is designated by USGS as site 02297460, and it is located at the end of a private dock at River Kilometer 15.5.
2. The second site is designated by USGS as 02297350 and it is located on a dock near Peace River Heights. This upstream monitoring site is located at River Kilometer 26.7.
Gaged Stream Flow
USGS also collects daily stream flow data at a wide number of gaging locations throughout southwest Florida. Flow data from a number of these sites are used by the HBMP program. Data for the period-of-record were obtained from the USGS web site:
(http://fl.water.usgs.gov/Tampa/index.html)
1. Peace River at Bartow (02294650) 2. Peace River at Fort Meade (02294898) 3. Peace River at Zolfo Springs (02295637) 4. Peace River at Arcadia (02296750) 5. Joshua Creek at Nocatee (02297100) 6. Horse Creek near Arcadia (02297310) 7. Prairie Creek near Fort Ogden (02298123) 8. Shell Creek near Punta Gorda (02298202) 9. Myakka River near Sarasota (02298830) 10. Big Slough near North Port (02299450)
• PBS&J (Tampa Office) – was responsible for all data collected at the three Authority HBMP recorders located in the lower Peace River that continuously collect data at
15-Peace River Manasota Regional ii 2008 HBMP Annual Data Report Water Supply Authority May 2009
minute intervals. Measurements at each of the five surface gaging locations include surface conductivity and water temperature. Conductivity, temperature and dissolved oxygen are also monitored near the bottom of the water column at a single location.
Authority HBMP Lower Peace River Continuous Recorders
1. RK12 – Near bottom conductivity, temperature and dissolved oxygen are recorded at 15-minute intervals from the HBMP continuous recorder attached to a navigation aid located on the lower Peace River downstream of Shell Creek (River Kilometer 12.9). Data collection began in May 2008.
2. RK21 – Near surface conductivity and temperature are measured at 15-minute intervals from the HBMP continuous recording gage attached to the Manatee Speed Zone Sign located on the Peace River near Liverpool side channel (River Kilometer 21.9). Data have been collected over the 2006-2008 time interval.
3. RK23 – Near surface conductivity and temperature at 15-minute intervals from the HBMP continuous recording gage attached to the Manatee Speed Zone Sign located on the Peace at River Kilometer 23.4. Data have been collected from 2006 until May 2008, after which monitoring at this site was suspended.
4. RK24 – Near surface conductivity and temperature at 15-minute intervals from the HBMP continuous recording gage attached to the Manatee Speed Zone Sign located on the Peace River just downstream of Navigator Marina (River Kilometer 24.5). Data have been collected over the 2006-2008 time interval.
5. RK30 - Near surface conductivity and temperature are measured at 15-minute
intervals from the HBMP continuous recording gage attached to the Manatee Speed Zone Sign located on the Peace River just upstream of the Facility (River Kilometer 30.6). Data collection began in May 2008.
6. RK31 - Near surface conductivity and temperature are measured at 15-minute
intervals from the HBMP continuous recording gage attached to the old railroad trestle located on the Peace River upstream of the Facility (River Kilometer 31.7). Data collection began in May 2008.
• Peace River/Manasota Regional Water Supply Authority – provided measurements of daily withdrawals by the facility.
• City of Punta Gorda – provided measurements of daily withdrawals and data from the Shell Creek HBMP.
• Benchmark Laboratory – conducted all HBMP water chemistry analyses conducted during 2007.
Peace River Manasota Regional iii 2008 HBMP Annual Data Report Water Supply Authority May 2009
Executive Summary
Historical Overview
On December 10, 1975, the Consumptive Use Permit #7500016 for the Peace River Regional Water Supply Facility was signed between General Development Utilities, Inc. and the Southwest Florida Water Management District (District). In conjunction with this agreement, a comprehensive Hydrobiological Monitoring Program (HBMP) was set forth to assess the responses of various physical, chemical and biological characteristics of the Charlotte Harbor Estuary to changes in Peace River flow. The program was designed to evaluate the impacts and significance of natural salinity changes on the aquatic fauna and flora in upper Charlotte Harbor, and to determine if freshwater withdrawals by the Peace River Regional Water Supply Facility (Facility) could be shown to alter these patterns.
Between 1979 and 2008, an ongoing series of individual reports have previously been submitted to the District, documenting the results of the HBMP during the period from January 1976 through December 2007. These reports include summarizations (findings) of data collected during the first four years of baseline monitoring, prior to the start of freshwater withdrawals, as well as comparisons of these data to the results obtained from the HBMP during subsequent years of water treatment facility operation. The period covered within this 2008 HBMP Annual Data Report follows directly upon that contained within the preceding 2007 HBMP Annual Data Report submitted in May 2008, as well as both the 2004 HBMP 2004 Mid-term Interpretive Report submitted in November 2006 and the draft 2006 HBMP Comprehensive Summary Report
submitted in April 2008. This current data report includes unreported HBMP data collected over the period from January through December 2008, and represents the nineteenth year of data collection for the Peace River Manasota Regional Water Supply Authority (Authority), as owner/operator of the Peace River Regional Water Supply Facility.
Although the Peace River Facility has only been operated by the Authority since 1991, the initial system was constructed by General Development Utilities and has been withdrawing water from the Peace River since 1980. The Facility’s initial storage capacity was 625 million gallons in the form of an 85 acre off-stream, surface reservoir. Additional storage capacity was added in 1985 with the development of a series of Aquifer Storage Recovery (ASR) wells. These initial ASR wells added a further 1,080 million gallons of storage capacity by 1988. An additional expansion of ASR wells in 1989 further increased the Facility’s total combined storage capacity to 2,785 million gallons. The storage capacity was again increased in 1995 by further expansion of ASR wells, providing a total combined ASR system storage capacity of approximately 3,865 million gallons. The storage capacity was again expanded in 2002 by the further addition of 12 new wells providing a total ASR system storage capacity of approximately 7,500 million gallons. The Facility presently has the capacity to treat up to 24 mgd (37.1 cfs). The Facility’s existing raw water river diversion station is comprised of four pumps having a combined maximum capacity of 44 mgd (68.0 cfs). In comparison, the long-term average annual daily total gaged river freshwater flow upstream of the Peace River Facility since 1976 has been approximately
Executive Summary
Peace River Manasota Regional iv 2008 HBMP Annual Data Report
Water Supply Authority May 2009
796 mgd (1233 cfs). During periods of high river flow, raw river water is stored in the off-stream surface reservoir and any excess treated water is stored in the system’s ASR wells. Conversely, when water is unavailable from the Peace River due to the established low flow cutoff of 130 cfs, water can be pumped from the raw off-stream surface water reservoir to the Peace River Facility for treatment, and/or previously treated water can also be recovered from the ASR well system to meet the water supply demands of the Authority’s service area.
In order to meet growing regional water demand, the Authority has started another expansion of the Facility. This expansion includes an increase to the river pumping capacity to 90 mgd, which is currently the upper limit of the 1996 permit, and will also double the Facility’s treatment capacity to 48 mgd. A larger new regional 640 acre off-stream reservoir with a capacity of 6 billion gallons is also under construction, and the existing transmission piping networks will also be gradually expanded to optimize regional water delivery. Completion of the ongoing physical expansion of the Facility’s capacity and the new reservoir are scheduled for 2009.
Summary of Previous Key HBMP Findings
The following briefly summarizes a number of the primary findings and conclusions presented in the submitted draft 2006 Comprehensive Summary Report (named for the period through which HBMP data were analyzed).
Rainfall – Climate researchers have suggested that natural climate cycles or phases can persist over multiple decades. One of these cycles, the Atlantic Multidecadal Oscillation (AMO) refers to long term cool and warm phase differences of only about 1°F (0.6°C) in North Atlantic average sea surface temperatures. An analysis of Atlantic sea surface temperatures suggests that warm AMO phases occurred during 1869-1893, 1926-1969, and from 1995 to date, while cooler phases occurred during the 1894-1925 and 1970-1994 time periods. Climatological data indicate that differences between relatively warm and cool AMO periods affect both air temperature and rainfall patterns. Analyses presented as part of the 2006 HBMP Comprehensive Summary Report
indicated the following patterns.
• Total annual average Peace River watershed rainfall levels at the Bartow and Arcadia gages were found to be slightly higher prior to the 1960s when compared with the period from the late 1960s to the mid 1990s. The data indicate that between the mid 1990s and 2006 annual total rainfall levels have, on average, increased within these two interior Peace River watersheds.
• Annual average wet-season (June-September) rainfall in the Peace River watershed was generally higher during the 1930s through the mid-1960s when compared with the interval from the late 1960s through the early 1990s. Since approximately 1994 there has been a notable increase in wet-season rainfall.
• No similar long-term patterns were apparent with regard to dry-season (January-May and October-December) rainfall, although periodic high annual totals were observed corresponding to El Niño events.
Executive Summary
Peace River Manasota Regional v 2008 HBMP Annual Data Report
Water Supply Authority May 2009
• The plots of yearly annual deviations from the average rainfall further supported the conclusions that total annual rainfall during the 1940s and 1950s was above the long-term average of 52 inches per year, and generally below this average during much of the 1970s and 1980s.
• Similar analyses of annual deviations conducted after dividing yearly rainfall totals into wet-season (June through September) and dry-season (October through December and January through May) indicated slightly higher wet-season rainfall during the earlier time periods. In contrast, dry-season rainfall varied randomly around the long-term average over time.
Lower Peace River Estuarine Freshwater Inflows – The following summarizes the major findings of analyses presented in the 2006 HBMP Comprehensive Summary Report.
• The trend analyses indicate that there have been long-term statistically significant declines in flows in the upper reaches of the watershed at both Bartow (since 1940) and Zolfo Springs (since 1934).
• U.S. Geological Survey (USGS) gaged Peace River at Arcadia flows also show statistically significant declines in a number of flow metrics over the 75-year period-of-record.
• In the southern tributaries of the Peace River watershed, by comparison, flows have increased over their periods-of-record (which are of shorter duration than the northern gages). Shell Creek flow data indicate statistically significant increases in the lowest flow percentiles (base flows), while there have been increasing trends in Prairie Creek at all percentiles between the monthly minimum and median values, and all percentiles of flow at the Joshua Creek gage have increased over time.
• Even with such agriculturally augmented dry-season flows in many of the southern watershed basins, combined total gaged flows upstream of the Facility still show statistically significant declines over the 1951 to 2006 interval for all monthly percentiles below the median flow.
• There were no statistically significant trends in flows at any of the USGS gages along the main stem of the Peace River during the period of HBMP monitoring between 1976 and 2006.
• All of the analyzed flow metrics (percentiles) at the Joshua Creek gaging location showed statistically significant increases over the 1976-2006 time interval. The results indicate the relative magnitude of agricultural development that has occurred in the Joshua Creek basin during this time interval.
• In comparison, the trend test results show that only those flows at or below the median have been augmented by agricultural development in the Horse Creek and Prairie Creek basins.
Executive Summary
Peace River Manasota Regional vi 2008 HBMP Annual Data Report
Water Supply Authority May 2009
• The observed differences in trends indicate that not only have all three of these southern Peace River watershed basins seen augmented dry-season stream flows due to agricultural ground water pumping, but that the degree of land use and drainage changes that have occurred in the Joshua Creek watershed have also resulted in structural changes that have fundamentally altered hydrologic surface flows in the basin.
Peace River Treatment Facility Withdrawals – The following observations and conclusions were presented in the report with regard to the status, long-term patterns and trends in Facility freshwater withdrawals.
• Prior to 1988 when withdrawal quantities were not based on a percent of river flow, much larger percentages of low flows were initially taken under the District’s original monthly based withdrawal schedule.
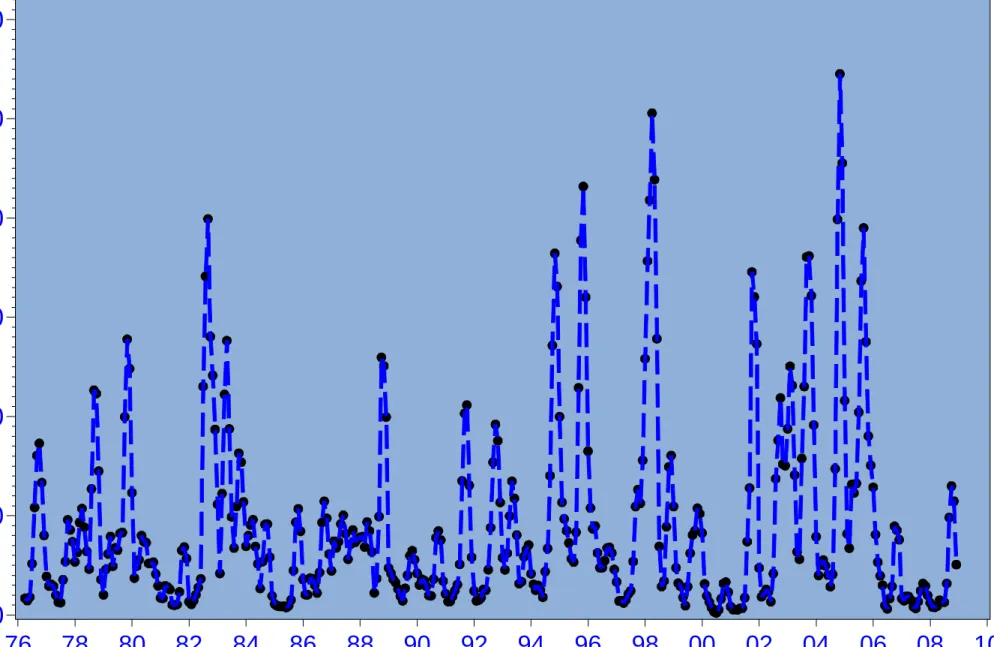
• Time-series plots plainly show the relatively steady increases in the amounts of freshwater withdrawals by the Facility since 1980 due to increasing potable water demands. Also clearly evident is the noticeable increase in maximum Facility withdrawals following completion of the Facility’s 2002 expansion, which resulted in the Authority’s increased ability to treat and store larger daily amounts of freshwater.
• Comparisons indicate that other than during the warm/dry months of April and May when the Facility is often not withdrawing water from the Peace River due to the 130 cfs cutoff, Facility withdrawals have been fairly uniform throughout most of the year, differing primarily between changes in the permits and differences in Facility capacities. • The low flow cutoffs based on flows at the USGS Peace River at Arcadia gage have often
resulted in periods each year when the Facility does not withdraw water from the river. During 2000 the Facility did not withdraw any water from the Peace River for a total of 248 days, and relied solely on stored reserves another 219 days during 2001.
• Facility withdrawals have periodically exceeded the ten percent criteria since it was established in 1988. The primary reason for these discrepancies stems from the way that stage/flow data are gathered. The Authority uses “provisional” preceding day flow data from the water level recorder at the USGS gaging station on the Peace River at Arcadia. Currently, these data are taken directly from the USGS Tampa office’s website. However, after the fact, the USGS checks and evaluates the data from the stage recorder and validates the river cross section a number of times each year. Thus, the daily values used by the Authority are only “provisional” and are occasionally changed by the USGS weeks or months after the fact. It is not uncommon for subsequent determinations of percent withdrawals, based on revised USGS calculations of daily flows, to conclude that daily Facility withdrawals, based on provisional flow information, in fact exceeded the established ten percent criteria. Such differences also result in instances when the Authority actually takes less than the permitted ten percent. The Authority and the USGS Tampa office staff have continued to work to reduce such instances to the greatest possible extent.
Executive Summary
Peace River Manasota Regional vii 2008 HBMP Annual Data Report
Water Supply Authority May 2009 Status and Trends in “Fixed” HBMP Station Water Quality Parameters – The HBMP water quality monitoring design has included the monthly collection of in situ physical measurements and chemical water characteristics at a number of fixed station locations (Figure 1.5) along the lower Peace River and in upper
Charlotte Harbor. These data were used to describe the present status, and statistically test for long-term changes in the water quality characteristics at these specific selected locations along the lower Peace River HBMP monitoring transect. The following summarizes the results and findings of these analyses for a number of key water quality parameters.
• Salinity – There is a strong,
distinct spatial salinity gradient along the lower Peace River monitoring transect. The greatest annual and inter annual variability in salinity generally occurs in the surface waters near the mouth of the river in the upper harbor where seasonal differences may reach 35 parts per thousand (or practical salinity units) between extended
periods of low and high freshwater inflow. The influences of the recent high freshwater inflows during the 1997/1998 El Niño event and the extended 1999-2001 drought are evident in the time-series plots.
• Dissolved Oxygen – Near-bottom dissolved oxygen concentrations show clear seasonal
cycles in response to higher freshwater flows during the summer wet-season. The duration and magnitude of periods of very low dissolved oxygen concentrations increase toward the river mouth as higher bottom salinities establish greater vertical stratification in the water column during high flows. Other studies have noted apparent declines in dissolved oxygen concentrations in the lower river over time, but have been unable to clearly identify any cause. The current analyses, based on a somewhat longer data set than these previous analyses, generally finds similar surface and bottom annual average dissolved oxygen concentrations along the HBMP monitoring transect when comparing the 1976-1989 and 1996-2006 time periods.
• Water Color – Humic compounds derived from the breakdown and subsequent leaching
of vegetation into surface waters are the source of the high water color that characterizes the blackwater river systems of southwest Florida. Color levels in the estuary temporally
Executive Summary
Peace River Manasota Regional viii 2008 HBMP Annual Data Report Water Supply Authority May 2009
increase quickly in response to increased freshwater inflow, with very high color levels extending well into the harbor during extended periods of high freshwater flows such as occurred during the 1997/1998 El Niño or recently during the extremely high flows that occurred during 2001, 2003, 2004 and 2005. Statistical analyses indicated significant differences between the average annual surface color levels at the two most downstream monitoring locations (River Kilometer (RK) -2.3 and 6.6) between the 1976-1989 and 1996-200 sampling periods. These differences reflect the higher recent inflows of dark colored water farther down the river and into the upper harbor during the recent period of high flows.
• Nitrite+Nitrate Nitrogen – Concentration levels and seasonal patterns of dissolved
inorganic nitrite+nitrate nitrogen differ along the lower river/upper harbor HBMP monitoring transect. The time-series plots indicate that inorganic nitrite+nitrate nitrogen levels at the most downstream fixed sampling station (located near the arbitrarily defined river mouth) are typically near or at method detection limits. Salinities are typically high in this region of the estuary and, except during periods of very high river flow, phytoplankton primary production is limited by the availability of inorganic nitrogen. Conversely, during extended periods of high freshwater river flows, surface salinities decline, bringing increased nutrient loading and higher levels of water color that limit the penetration of light into the water column and subsequently reduces phytoplankton growth and nitrogen uptake. By comparison, inorganic nitrogen levels progressively increase moving upstream along the HBMP sampling transect, as dilution by low nutrient/high salinity harbor water declines and higher water color increasingly limits phytoplankton nitrogen uptake. Only during periods of extended low freshwater flow, such as during the spring dry-season, are ambient inorganic nitrogen levels low at the upstream river sampling sites. The observed statistically significant increase in inorganic nitrogen concentrations in the upper harbor (RK -2.4) matches with the corresponding increase in water color and supports the previous observations that these increases reflect higher inflows of darker (nitrogen rich) freshwater farther downstream into the upper harbor during the recent period of characteristically higher river flows.
• Total Kjeldahl Nitrogen – While this gross measurement of combined inorganic
ammonia and organic water column nitrogen shows distinct seasonal patterns, spatially levels at all the monitoring locations were observed to be relatively similar. Statistical tests found no significant differences when comparing the 1976-1989 and 1996-2006 time periods.
• Ortho-Phosphorus – Probably the most dramatic long-term change in water quality in
the lower Peace River has been the marked, observed statistically significant long-term decline in dissolved inorganic (and total) phosphorus concentrations. Phosphorus concentrations generally reflect both the spatial and temporal variation in Peace River freshwater inputs. The highest phosphorus concentrations are typically associated with seasonal low river flow, when the influences of ground water are more pronounced. Long-term temporal patterns indicate rapid declines in both the magnitude and variability in phosphorus levels when compared with the first six years of HBMP monitoring. Comparisons of the average annual mean phosphorus concentrations between the 1976-1989 and 1996-2006 time periods indicate a continued decline at the HBMP river
Executive Summary
Peace River Manasota Regional ix 2008 HBMP Annual Data Report
Water Supply Authority May 2009
stations, even though the largest changes occurred prior to 1984. Of particular note however are more recent observations, which show phosphorus levels throughout the lower Peace River/upper Charlotte Harbor Estuary have dramatically increased following Hurricanes Charley, Francis and Jeanne in August and September of 2004. The long-term data indicate that following this unusual series of events phosphorus concentrations increased throughout the system to levels not seen for over 20 years.
• Silica – Both the long-term time-series plots and the statistical comparisons of mean
annual average reactive silica concentrations indicate that silica levels have recently dramatically increased along the entire length of the lower Peace River monitoring transect. During the most recent eleven years of HBMP monitoring, silica concentrations at all five fixed sampling sites have increased and the range of variability has increased when compared with similar data from the 1976-1989 period. It may be that the observed increases in ambient reactive silica levels in the Peace River estuarine system reflect the cumulative influences of increased ground water use and the expansion of water intense agriculture in the Peace River watershed, or it may be associated with other land use changes occurring upstream in the watershed. The Authority has collected additional dry- and wet-season data at a number of locations throughout the upper watershed in order to be able to better identify potential sources of both apparent increasing silica and phosphorus concentrations.
• Chlorophyll a – Previous studies observed marked declines in the periodic very high
chlorophyll a concentrations or phytoplankton “blooms” that commonly occurred in the surface waters throughout the lower Peace River/upper Charlotte Harbor estuarine system during the late 1970s and early 1980s. However, the current examination of the data, which extends similar analyses through 2006 indicates that since 2004 chlorophyll a
levels in the lower river and upper harbor have uniformly shown increases to annual average levels not seen in over 20 years. Following Hurricanes Charley, Francis and Jeanne in August and September of 2004, as previously discussed, water quality data from the lower river showed marked increases in ortho-phosphorus levels that correspond with the observed increases in chlorophyll a. Since phosphorus levels in the lower Peace River/upper Charlotte Harbor Estuary are naturally high, and nutrient additions have shown local estuarine phytoplankton populations are seasonally nitrogen and not phosphorus limited, it is doubtful that the observed increases in phosphorus levels are directly the ultimate cause of the observed increases in chlorophyll a concentrations. More than likely it is that other water quality constituents not monitored by the HBMP, but having the same source as the observed phosphorus increases, are responsible for the observed increases in phytoplankton levels. Overall, the result of the observed historic declines, combined with the recent observed increases, is that there are no statistically significant differences in average annual seasonally weighted mean chlorophyll a
concentrations between the 1976-1989 and 1996-2006 time intervals at any of the fixed HBMP monitoring locations. This result demonstrates the inherent difficulty in using most commonly applied statistical trend procedures when evaluating long-term changes in water quality parameters having multiple non-seasonal increasing and decreasing patterns.
Executive Summary
Peace River Manasota Regional x 2008 HBMP Annual Data Report
Water Supply Authority May 2009
Current Hydrobiological Monitoring Program
The initial monitoring elements of the HBMP were designed in 1976 to provide answers to specific questions raised by District staff during the Facility’s original permitting process. These questions raised concerns regarding the potential for negative impacts that might be associated with possible salinity changes in Charlotte Harbor resulting from freshwater withdrawals. The HBMP was from its conception envisioned as a dynamic program. Modifications have been made to the program’s monitoring elements throughout its history, with study elements having been added and deleted in order to enhance the overall knowledge base of the lower Peace River/upper Charlotte Harbor estuarine system. Historically, those major monitoring elements aimed at assessing direct relationships with variations in freshwater inflow have had the longest histories (vegetation and water quality). Other HBMP elements, primarily those focused on assessing indirect biological indicators, have extended over a number of years and then ended once a sufficient baseline basis of information had been accumulated.
Based on the results of the 1993 and 1995 Summary HBMP Reports and additional analyses requested by District staff during the 1996 permit renewal process, an expanded HBMP was approved by the District in March 1996 as a part of Water Use Permit (WUP) #20010420 for implementation in 1996 and subsequent years. The Peace River Facility’s 20-year Water Use Permit continues to require the submission of Annual Data Reports, as well as Mid-term and Comprehensive Summary Documents respectively after data collection for the 3rd and 5th years of each five-year period. Specific conditions within the 1996 permit renewal included major expansions of both the physical and biological elements of the Hydrobiological Monitoring Program.
USGS Continuous Recorders –The primary goal of this HBMP study element has been to
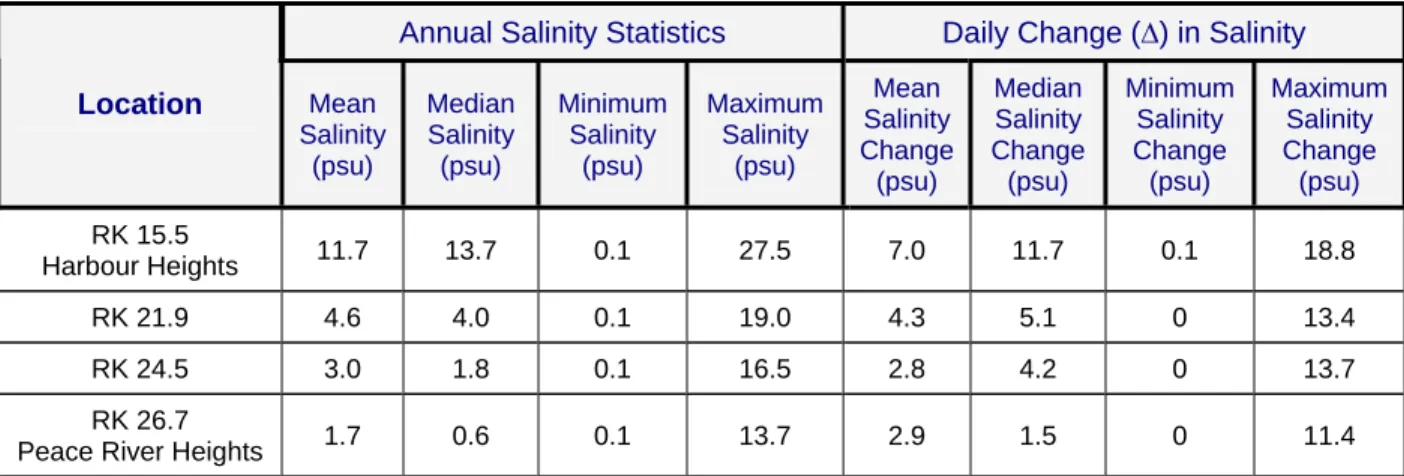
develop an extensive database of short-term changes in surface and near-bottom salinity in the lower Peace River. In 1996 the USGS installed an automated 15-minute interval water level conductivity and stage recorder approximately 15.5 kilometers upstream of the river’s mouth at Harbour Heights. In November 1997 a similar Peace River Heights recorder was installed at approximately RK 26.7 just downstream of the Peace River Treatment Facility (Figure 5.1). As indicated in previous HBMP annual reports, both surface and bottom conductivities at the downstream Harbour Heights site (River Kilometer 15.5) are very strongly influenced by tide (water stage) during periods when river flows are relatively low. During May, in the dry-season, it was not uncommon for surface and bottom conductivities to vary 7000 to 15000 uS/cm (roughly from 4 to 9 psu) over a tidal cycle. During the wet-season, this lower reach of the Peace River is characteristically far fresher and daily variations in both surface and near bottom conductivities resulting from tidal influences are greatly reduced, typically varying over a range of less than 0.2 psu.
At the more upstream continuous USGS gage at Peace River Heights (RK 26.7), the conductivity data collected in 2008 showed surface and bottom conductivities varying 5000 to 15000 uS/cm (roughly from 3 to 9.0 psu) over a tidal cycle during the May spring dry-season. This is again in direct contrast to recent wetter years such as 2005, when the data indicate only small, infrequent differences in conductivity (usually less than 100 uS/cm) resulting from tidal variations during
Executive Summary
Peace River Manasota Regional xi 2008 HBMP Annual Data Report
Water Supply Authority May 2009
the May 2005 dry-season. During September 2008, conductivities were low, but still showed small variationsdue to higher tidal events associated with strong southerly winds.
Conductivities at the more upstream Peace River Heights recording gage indicated the extent and duration of the upstream movement of higher conductivity harbor waters during 2008. High conductivity water (5,000 – 20,000 uS/cm) extended upstream into this characteristically freshwater reach of the lower river from January through April, again from May through the later part of June, and then again during November and December. This is in direct contrast to the preceding much wetter 2003-2005 time interval when conductivities at the Peace River Heights gage exceeded 1000 uS/cm for only just a few days each year.
Additional Authority Continuous
Recorders – The five HBMP recorders
installed during 2005 and 2008 by the Authority showed analogous patterns to those observed at the two USGS continuous gages located downstream and upstream along the HBMP monitoring transect (Figure 5.1). As previously discussed with respect to corresponding data from the two USGS continuous gages located downstream and upstream of these HBMP recorder locations, surface conductivities in the reach of the lower Peace River characterized by the three HBMP recorders between River Kilometers 21.9 and 24.5 typically show a great degree of daily tidal variability during periods of low flow and usually only very small or limited tidal salinity changes during higher flows.
Water Chemistry and Water Column
Physical Profiles – The primary focus of
this HBMP program extends along the
monitoring transect centerline that extends from south of the mouth of the river (which follows an imaginary line between Punta Gorda Point and Hog Island) to upstream of the Facility to where Horse Creek enters the lower Peace River. Two separate HBMP study elements incorporate both in situ water column profile physical measurements combined with the collection of chemical water quality sampling along the monitoring transect. Several objectives are associated with both the individual and combined findings of these water quality HBMP study elements. A principal goal of both monitoring efforts is to assess the overall “health of the estuary” by collecting sufficient long-term data to statistically describe spatial and seasonal variability of the water quality characteristics of the lower Peace River/upper Charlotte Harbor Estuary, and test for significant changes over time (trends). A further goal of these HBMP elements is to determine whether significant relationships exist between freshwater inflows and
Executive Summary
Peace River Manasota Regional xii 2008 HBMP Annual Data Report
Water Supply Authority May 2009
the seasonal/spatial variability of key selected water quality parameters. Where such relationships exist, a further objective then becomes to determine the potential magnitude of change that might result from both existing and projected future permitted withdrawals, and compare such predicted changes due to withdrawals with the normal ranges of observed natural seasonal and annual variability.
Similar and comparable physical and chemical water quality parameter measurements along the upper Charlotte Harbor/lower Peace River estuarine monitoring transect are collected under these two different HBMP study elements.
1. During the first week of each month, water quality measurements (physical and chemical) are conducted at four “moving” salinity-based isohaline locations (0, 6, 12 and 20 psu) along a river kilometer centerline running from the imaginary “mouth” of the Peace River upstream to above its junction with Horse Creek, and downstream to Boca Grande Pass. The relative monthly location of each sampling is based on the first occurrence of these specific isohalines (± 0.5 ppt), with freshwater being defined as the first occurrence of conductivities less than 500 ms. Historically, this isohaline sampling effort was undertaken in conjunction with other long-term phytoplankton elements of the HBMP.
2. Approximately two weeks after the collection of the “moving” isohalines, water column physical profiles are conducted, near high tide, at sixteen “fixed” locations along a transect running from just below the river’s mouth upstream to a point just above the Peace River Facility (see Figure 1.5 above). In addition, chemical water quality samples are taken at five of these locations.
Both of these water quality study HBMP elements include physical in situ water column profile measurements of characteristic parameters (temperature, dissolved oxygen, pH, conductivity and salinity) at 0.5 meter intervals from the surface to the bottom. In addition both efforts measure the penetration of photosynthetically active radiation (PAR) to determine ambient extinction coefficients at specific sampling locations. Both studies also include the analyses of an extensive list of chemical water quality parameters. The only difference is that at the “fixed” sampling stations both sub-surface and near-bottom samples are collected at each of the five sites, while only sub-surface water chemistry samples are taken as part of the “moving” isohaline based HBMP study element.
Summary of 2008 HBMP Study Results
The following compares data collected during 2008 with similar average values for key parameters previously compiled during various elements of the ongoing long-term monitoring programs. This summary of 2008 data includes the following key HBMP study elements.
1. Peace River freshwater inflows and facility withdrawals.
Executive Summary
Peace River Manasota Regional xiii 2008 HBMP Annual Data Report Water Supply Authority May 2009
3. Water quality characteristics such as nitrate/nitrite, ortho-phosphorus, nitrogen to phosphorus ratios, and reactive silica.
4. Biological measurements of phytoplankton biomass (chlorophyll a.)
In making comparisons of the 2008 data with averages of similar data collected over the preceding 32-year period (1976-2007), it should be noted that the very wet winter/spring El Niño of 1997/1998 was followed by very dry La Niña conditions that influenced southwest Florida and the entire Peace River watershed between 1999 and early 2002 (see Figures 2.3 and 2.4). A weaker El Niño occurred at the end of 2002, and freshwater flows during 2003, 2004 and 2005 were generally above average. Rainfall in the Peace River watershed during the recent 2006-2008 interval by comparison was well below average.
• Flows – Average mean daily Peace River flow at the Arcadia gage during 2008 was only
431 cfs, which is more than the preceding annual average flow of 376 cfs in 2006 and the average of 173 cfs during extremely dry conditions of 2007. The average mean daily flow of 173 cfs during 2007 was the 2nd lowest mean daily average flow over the past 32 years, and only slightly higher than the average daily flow of only 139 cfs that occurred in 2000 during the past extended 1999-2001 drought.
The recent three years of drought are in direct comparison with the preceding four-year period between 2002 and 2005 when Peace River flow at Arcadia averaged 1662 cfs. Overall, mean Arcadia flows during 2008 were just 47 percent of the average daily flow
Executive Summary
Peace River Manasota Regional xiv 2008 HBMP Annual Data Report Water Supply Authority May 2009
for the preceding long-term 1976-2007 period. In comparison, the sum of average daily flows from the Peace River at Arcadia, Horse Creek, Joshua Creek, and Shell Creek during 2008 was roughly 53 percent of the average daily flows over the longer term 1976-2007 HBMP monitoring period.
• Withdrawals – Throughout 2008, the Peace River Facility operated under a series of
District modifications to the Water User Permit and Executive Orders that temporarily altered the low flow cutoff and/or temporarily increased the percent of flow that could be withdrawn from the river. The Facility’s mean average daily withdrawal during 2008 was 15.4 cfs. Overall withdrawals comprised 3.6 percent of the annual Arcadia gaged flow, and 1.9 percent of the combined lower Peace River gaged flow (Peace River at Arcadia, Horse Creek, Joshua Creek and Shell Creek). Combined total freshwater withdrawals by the Peace River and the City of Punta Gorda facilities accounted for approximately 2.7 percent of total freshwater flows to the estuary. There were a number of days during 2008 when Peace River Facility withdrawals exceeded the designated maximum percent allowed by the District. Such exceedances of the permitted percent withdrawals primarily result from subsequent revisions by USGS of the provisional daily flow information available to the Authority at the time of actual withdrawals. Often there are extended periods each year when the Peace River Facility does not withdraw any water from the river due to either the low flow threshold and/or Facility operations. During 2008, the facility did not withdraw any water from the river approximately 23 percent of the time. Since the later half of 2002, maximum Facility withdrawals have increased due to the completed facility expansion, which has resulted in an increase in the Authority’s ability to divert, treat and store larger daily amounts of freshwater when river flows are high.
• Salinity Spatial Distribution – The influences of the much drier than usual conditions
that characterized 2008 were reflected in the seasonal and average spatial distributions of each of the four sampled, moving isohalines along the HBMP monitoring transect. Overall, the relative spatial distributions of each of the isohalines during 2008 reflected upstream movements of 7-11 kilometers when compared with their previous long-term 1983-2007 averages.
The following provides comparisons between 2008 and long-term averages for the following selected physical, chemical and biological water quality characteristics.
• Temperature – Mean annual water temperatures during 2008 at the two lower salinity
isohalines (0 and 6 psu) were generally similar with corresponding values measured over the preceding 25-year period (1983-2007). Overall, water temperatures measured at all four salinities during both January and December 2008 were, as during the previous five years (2003-2007), much warmer than usual when compared to similar seasonal values measured over the longer term period-of-record.
• Water Color –During the drought (2006 and 2007) color levels in the lower Peace
River/upper Charlotte Harbor estuarine system were well below their long-term averages within all but the highest salinity isohaline as a result of the extremely low average
Executive Summary
Peace River Manasota Regional xv 2008 HBMP Annual Data Report
Water Supply Authority May 2009
seasonal freshwater inflows over most of the year. Somewhat surprisingly, color levels during the summer wet-season of 2008 were among the highest observed over the period-of-record, even though overall flows were only approximately half of the historic average over the HBMP monitoring period (1976-2008). It is possible that the observed high levels of color resulted from a “flushing” of humic compounds accumulated over the preceding period of drought by the brief period of relatively high flows during the summer of 2008.
• Extinction Coefficient – The rates of measured light attenuation at each of the four
HBMP isohalines reflect the interactions of both ambient color and phytoplankton biomass (chlorophyll a). Comparisons of mean extinction values among the four isohalines in 2008 and with corresponding long-term averages indicate very similar patterns as those described for water color. Relatively low levels of color during all but the brief, intense summer wet-season during 2008 within the 0 and 6 psu isohalines resulted in light extinction coefficients being well below their long-term 1983-2007 historical annual averages.
• Nitrite/Nitrate Nitrogen - During 2008, the average concentrations of this major
inorganic form of nitrogen in each of the four sampled estuarine isohaline zones were well below (approximately a third) of the long-term (1983-2007), historical annual averages. The data clearly indicate that inorganic nitrogen levels in the lower Peace River/upper Charlotte Harbor estuarine system have declined due to the recent three years of drought. Monthly comparisons among the isohalines indicate nitrite/nitrate inorganic nitrogen concentrations in the lower Peace River/upper Charlotte Harbor estuarine system are characterized by a distinct spatial gradient that shows strong responses to seasonal patterns of freshwater inflows. Concentrations typically decrease rapidly with increasing salinity, with inorganic nitrogen levels within the 20 psu isohaline often being near or at method detection limits over much of the year. Normally, estuarine inorganic nitrogen concentrations decline to their lowest levels during the relatively drier, spring as phytoplankton populations respond to increasing water temperatures and light, and increased primary production removes available inorganic nitrogen.
• Ortho-phosphorus - Estuarine inorganic phosphorus concentrations in the lower Peace
River and upper Charlotte Harbor are heavily influenced by the characteristically “very” high natural levels found in the Peace River watershed. As a result, the observed difference in concentrations among the four isohalines simply reflects conservative dilution by Gulf waters. Unlike inorganic nitrogen, seasonal observed changes in phosphorus concentrations in the estuary are for the most part unaffected by biological uptake. Inorganic phosphorus concentrations entering the estuary system from the Peace River watershed are typically lower during wetter periods, when a higher proportion of flow results from surface flow (rather than coming from groundwater, which is naturally richer in phosphorus). Historically, since the late 1970s, there had been marked declines in inorganic phosphorus levels in the lower Peace River/upper Charlotte Harbor estuarine system due to declines in the combined influences of phosphate mining and processing in the upper reaches of the basin. However, following Hurricane Charlie and the subsequent influences of Hurricanes Francis and Jeanne during the late summer of 2004,
Executive Summary
Peace River Manasota Regional xvi 2008 HBMP Annual Data Report Water Supply Authority May 2009
inorganic phosphorus concentrations have dramatically increased throughout the lower Peace River/upper Charlotte Harbor estuarine system. Ortho-phosphorus concentrations have remained well above both historic and recent levels. The direct cause for these increased levels seems to be related to the closing of the Ft. Meade phosphogypsum stack system in the upstream Whidden Creek subbasin.
• Nitrogen to Phosphorus Atomic Ratios – Calculated atomic inorganic nitrogen to
phosphorus ratios for ambient measured concentrations in 2008, as indicated by the long-term averages, show nitrogen to always be the limiting macronutrient at each of the four isohalines.
• Silica – Seasonally, silica levels in the lower Peace River/upper Charlotte Harbor
estuarine system typically peak following periods of high freshwater inflows. Although silica levels also seem to be positively correlated with higher water temperatures (possibly reflecting recycling from riverine/estuarine sediments), historically lower silica concentrations in higher salinity zones of the estuary have often occurred during corresponding periods of combined low spring freshwater inflow and spring increases in phytoplankton diatom numbers. Between 1983 and the late 1990s these seasonal patterns of increasing and decreasing reactive silica concentrations remained relatively stable with no indications of any consistent systematic changes over time. However, as discussed in previous HBMP reports, silica levels started showing increasing concentrations during the late 1990s. Then, as flows declined during the extended 1999-2002 drought, silica levels also declined. However, following the return of higher than average flows during
Executive Summary
Peace River Manasota Regional xvii 2008 HBMP Annual Data Report Water Supply Authority May 2009
2003-2005 measured silica levels in the estuary again began rapidly increasing. Even though flows since 2006 have been below normal, silica levels throughout the lower river/upper harbor estuary have continued to reach historically high levels during the past three summer wet-seasons. As with ortho-phosphorus, the proximate cause for these increasing levels seems to be related to the closing of the Ft. Meade phosphogypsum stack system in the upstream Whidden Creek subbasin.
• Chlorophyll a – The seasonal patterns of freshwater inflows to the estuary during 2008
were characterized by drier than usual conditions except during the summer wet-season, when compared to the long-term average conditions. Typically, seasonal periods of increased flows produce both higher than average inputs of limiting inorganic nutrients (nitrogen), as well as higher than average levels of water color (resulting in greater light attenuation). The increase in flows at the end of June following an unusually dry spring was followed by sharp increases in phytoplankton biomass in July within both the 6 and 12 psu zones. Overall, average phytoplankton production (chlorophyll a) levels during 2008 within the three upstream Peace River/upper Charlotte Harbor estuarine salinity zones were similar to their long-term (1983-2008) corresponding averages. As in previous years, phytoplankton levels within the intermediate (6 and 12 psu) isohalines, reflected a balance between stimulation due to increased nitrogen inputs, and light inhibition resulting from higher water color. During previous years, taxonomic counts indicated that such “bloom” events within these intermediate salinity zones were predominantly characterized by high numbers of dinoflagellates (Dinophyceae) or
Executive Summary
Peace River Manasota Regional xviii 2008 HBMP Annual Data Report Water Supply Authority May 2009
diatoms (Bacillariophycae). Chlorophyll levels in the highest isohaline (20 psu) during 2008 were much higher than the historical average, reflecting both the higher availability of light due to the drought conditions, and a marked response to the input of nutrients during the summer wet-season.
Conclusions
This document represents the thirteenth Annual Data Report submitted under the expanded Hydrobiological Monitoring Program (HBMP) initiated in 1996 in compliance with Water Use Permit 20010420. The graphical and summary analyses presented in this document do not indicate any substantial changes, or atypical events in either the physical or biological data collected during 2008, other than those previously noted. These include:
• Freshwater inflows during 2008 were characterized by much drier than normal flows, especially during the normal summer wet-season (Figure 2.3 above).
• There has been a continuation of the previously noted long-term increase in reactive silica concentrations in the lower Peace River (Figure 3.18 above).
• There are strong indications that inorganic phosphorus concentrations in the freshwater entering the estuary have increased in recent years, following decades of major declines that began in the late 1970s (Figure 3.20 above).
The “limited” analyses presented in the Annual Data Report do not suggest that there have been any long-term, systematic changes resulting from either current or historic water withdrawals by the Peace River Regional Water Supply Facility.
Review of Long-term Changes in Upstream Water Quality
Analyses of long-term water quality data from both the fixed and isohaline monitoring program study elements presented in this and previous HBMP reports have identified several important recent and longer term changes in water quality that have occurred upstream of the Facility that may influence both aspects of operations and/or the biological communities of the estuarine system.
• There have been long-term, progressive increases in the conductance of the water coming downstream to the Facility during the drier months of the year. This trend has further been associated with increasing volumes of water (base flow) during the normally seasonal drier time intervals. These changes over recent decades have been primarily associated with increasing land conversions from less to more intense forms of agriculture that increasingly rely on irrigation using high conductivity water pumped from the upper Floridan aquifer. Such changes are particularly apparent in the Joshua and Horse Creek basins in the southern portions of the Peace River watershed. The upstream changes in water quality (conductance, chlorides and TDS levels) originating from agricultural discharges during the dry-season have yet to be a serious hindrance to
Executive Summary
Peace River Manasota Regional xix 2008 HBMP Annual Data Report Water Supply Authority May 2009
water supply operations. However, this is not to say that such changes may not become a problem in the future if the current trends in the contributing upstream basins continue. • Silica levels in the lower Peace River/upper Charlotte Harbor estuary have been
progressively increasing over the past decade. More recently, phosphorus levels in the lower Peace River that had historically show dramatic declines during the late 1970s and 1980s have returned to levels not observed in decades. These observed changes in long-term HBMP data, combined with the Authority’s watershed monitoring and the District’s watershed ambient surface water quality monitoring indicate that these recent changes coincide well with the ongoing closure of phosphogypsum stacks and associated discharges in the Whidden Creek subbasin. It is therefore reasonable to assume that increases in these same parameters that predate the period of closures of the USAgriChemicals Fort Meade operations have also been related to changes in phosphate mining activities in the upper Peace River watershed.
Permanent Historic and Current HBMP Data
This Executive Summary provides a brief over view of the HBMP project and the recent findings from the 2008 annual report. The entire report, including summary graphics and tables, and all historic project water quality data are available in electronic format on a CD titled 2008 HBMP Annual Data Report. This CD is available upon request by contacting the Southwest Florida Water Management District or the Peace River Manasota Regional Water Supply Authority. All historic water quality and in situ data collected during the fixed, moving station, and continuous recorder elements of the HBMP are provided on the 2008 HBMP Annual Data Report CD in a separate directory labeled 2008 Data Sets, as files in ASCII, Excel and/or SAS formats.
Peace River Manasota Regional xx 2008 HBMP Annual Data Report Water Supply Authority May 2009
Contents
Acknowledgements Executive Summary Contents Section Page 1.0 Introduction/Summary 1.1 Report Objectives ... 1-1 1.2 Peace River Facility Water Use Permit and Related HBMP ... 1-2 1.3 Previous HBMP Study Elements and Studies . ... 1-5 1.4 Overview of Previous HBMP Summary Results ... 1-7 1.5 Ongoing HBMP Program Study Elements . ... 1-10 1.5.1 Water Chemistry and Water Column Physical Profiles ... 1-10 1.5.2 USGS Continuous Recorders ... 1-11 1.5.3 Additional HBMP Continuous Recorders ... 1-12 1.6 Summary of 2008 Results ... 1-14 1.7 Conclusions... 1-17 1.8 Permanent Data... 1-18 1.9 Problems Encountered During 2008... 1-20 2.0 Peace River Gaged Flows and Regional Water Supply FacilityWithdrawals
2.1 2008 Gaged Flows to the Lower Peace River………. 2-2 2.2 Peace River Facility Withdrawals ……… 2-4 2.3 Comparisons of Peace River Facility and Shell Creek
Facility Withdrawals ………. 2-7
2.4 Summary ……… 2-8
3.0 In Situ Physical Measurements, Water Chemistry and Phytoplankton Biomass at “Moving Isohaline Locations
3.1 Introduction... 3-1 3.2 Historical Long-term Phytoplankton Study Elements ... 3-1 3.3 Overview of Isohaline Based Monitoring Methods... 3-3 3.3.1 In Situ Measurements of Physical Parameters ... 3-5 3.3.2 Light Profile ... 3-5 3.3.3 Water Chemistry... 3-6
3.4 Physical and Water Chemistry Data Collected in the “Moving” Isohaline
Locations ... 3-6 3.5 Summary ... 3-8
Contents
Peace River Manasota Regional xxi 2008 HBMP Annual Data Report Water Supply Authority May 2009
4.0 Water Chemistry Data Collected At “Fixed” Station Locations
4.1 Introduction...4-1 4.2 Description of Fixed Station Data Collection...4-2 4.3 Data Collection and Analyses...4-3 4.4 Results and Conclusions...4-3 4.4.1 Physical Water Column Characteristics (2008) ...4-3 4.4.2 Chemical Water Quality Characteristics (2008) ...4-5 4.4.3 Long-Term Physical and Chemical Water Quality
Characteristics (1976-2008) ...4-8 5.0 USGS and HBMP Continuous Recorders
5.1 Introduction and Overview...5-1 5.2 Results from USGS Continuous Recorders (2008) ...5-5 5.3 Results from HBMP Continuous Recorders (2008) ...5-7 5.4 Summary Comparisons among USGS and HBMP Continuous
Recorders ….……… 5-8 6.0 Significant Environmental Change
6.1 Regulatory Basis of Review ...6-1 6.2 Resource Management Goals and Relevant Hydrobiological Indicators...6-1 6.3 Rationale for Defining Significant Environmental Change ...6-2 6.4 Authority’s Management Response Plan (MRP) to a Potential
Observed Significant Environmental Change ...6-4 6.5 Assessment of Permitted Withdrawals ……….………. 6-7 7.0 Assessment Upstream Changes in Water Quality
7.1 Increasing Conductance in the Lower Peace River...7-1 7.1.1 Peace River at Arcadia ...7-1 7.1.2 Joshua Creek at Nocatee ...7-2 7.1.3 Horse Creek near Arcadia...7-3 7.1.4 Peace River Kilometer 30.7...7-3 7.2 Changes in Phosphorus and Silica in the Lower Peace River...7-4 7.3 Summary ...7-7 8.0 References Tables Figures Maps Photographs Data Sets
Peace River Manasota Regional 1-1 2008 HBMP Annual Data Report Water Supply Authority May 2009
1.0 Introduction/Summary
1.1 Report Objectives
The primary purpose of this introductory section the of 2008 HBMP Annual Data Report is to summarize and provide brief overviews of the historic background and current status of the Peace River Manasota Regional Water Supply Authority’s (Authority) Hydrobiological Monitoring Program (HBMP). The following summarizes the major topics included in this section.
• A review of the Authority’s Peace River Facility Water Use Permit (WUP), and the overall goals and objectives of the associated HBMP.
• An overview of major previous and current HBMP monitoring elements, as well as special HBMP studies.
• A brief summary of some of the key findings of recent previous HBMP reports and studies.
• An outline of current HBMP monitoring elements.
• Summary results presented in Sections 2 through 7 of this 2008 HBMP Annual Data Report.
• An overview of the current and historic data sets used in the analyses of 2008 HBMP data.
• A general summary of specific problems encountered by study elements during the 2008 HBMP monitoring that resulted in either missing or unusable data.
The following outlines the organization and primary objectives of each of the other sections of the 2008HBMP Annual Data Report.
• Section 2.0 (Peace River Gaged Flows and Peace River Facility Withdrawals) –The purpose of this section is to provide analysis and summaries of 2008 gaged river freshwater inflows to the lower Peace River estuary, and provide comparisons with freshwater withdrawals by Peace River Regional Water Supply Facility (Facility). This section also presents comparisons of the 2008 flow record and facility withdrawal levels with similar long-term information over the 1976-2008 time interval, which corresponds with the historic period of HBMP monitoring.
• Section 3.0 (Physical and Chemical Water Quality Characteristics at “Moving” Isohaline Based Locations) –The intention of this section is to provide a brief overview of the initial objectives of the “moving” isohaline based monitoring program, describe the current sampling plan, and present both the results of data collected in 2008 as well as
Introduction/Summary
Peace River Manasota Regional 1-2 2008 HBMP Annual Data Report Water Supply Authority May 2009
summary graphical and tabular comparisons of the 2008 results with previous similar salinity based sampling HBMP data collected between 1983-2007.
• Section 4.0 (Physical and Chemical Water Quality Characteristics at “Fixed” Lower River/Upper Harbor Monitoring Transect Locations) – This section summarizes the objectives of the long-term “fixed” station monitoring program, describing both the historic and current sampling designs, and presents both the results of data collected in 2008 as well as summary graphical and tabular comparisons of selected 2008 water quality monitoring results with previous similar HBMP data collected between 1976-2007.
• Section 5.0 (USGS and HBMP Continuous Recorders) – This report section summarizes the initial principle objectives envisioned in establishing 15-minute U.S Geological Survey (USGS) continuous recorders (tide stage, and surface and bottom temperature and conductivity) at Harbour Heights (River Kilometer 15.5) and Peace River Heights (River Kilometer 26.7). Also described and summarized are the design criteria that were used in establishing three additional HBMP 15-minute continuous recorders (subsurface temperature and conductivity) in December 2005 at River Kilometers 22.0, 23.4 and 24.5. Three additional recorders were further added in May 2008, based on recommendations of the HBMP Scientific Review Panel. The results of data collected in 2008 at these eight locations are presented, and graphical and tabular results are compared among these sites along the lower Peace River HBMP monitoring transect, as well as with the previous collected data.
• Section 6.0 (Significant Environmental Change) – This section briefly summarizes the previously presented (2006 HBMP Comprehensive Summary Report) discussion of the Southwest Florida Water Management District’s (District) concept of an “Adverse Impact” and compares and contrasts the HBMP working definition of “Significant Environmental Change” relative to impacts potentially associated with Facility withdrawals from the lower Peace River.
• Section 7.0 (Assessment Upstream Changes in Water Quality) – The final section of this report address observed long-term changes in water quality upstream of the Facility. Discussed are the identified proximate causes and how these changes have influenced observed water quality in the lower Peace River/upper Charlotte Harbor estuarine system and potentially Facility operations.
1.2 Peace River Facility Water Use Permit and Related HBMP
The Authority’s Peace River Treatment Facility is located adjacent to a side-branch of the Peace River in southwest DeSoto County. Although the system has only been operated by the Authority since 1991, the Facility has been operating and withdrawing water from the Peace River since 1980. The Facility presently has the capacity to treat up to 24 million gallons per day (mgd), which is equivalent to withdrawals from the river of 37.2 cubic feet per second (cfs). The existing raw water river diversion station has four pumps having a combined maximum capacity of 44 mgd (68.0 cfs). During periods of high river flow (or periods where permitted withdrawal
Introduction/Summary
Peace River Manasota Regional 1-3 2008 HBMP Annual Data Report Water Supply Authority May 2009
exceeds demand), raw river water is stored in an off-stream surface reservoir and any excess treated water is stored in the system’s 21 aquifer storage/recovery (ASR) wells. Conversely, when water is unavailable from the Peace River due to the established low flow 130 cfs cutoff (or when demand exceeds permitted withdrawals), water can be pumped from the raw water reservoir to the Peace River Facility for treatment, and/or previously treated water can also be recovered from the ASR well system to meet the water supply demands of the Authority’s service area.
As part of the Authority’s future plan to meet projected increasing water demands due to regional growth in the member counties, the Authority is currently implementing plans to further expand the Peace River Facility. Current plans are to increase the river Facility pumping capacity of the river pump station to 90 mgd, which is the current permit limit. These plans also include the current ongoing construction that will let the Facility treat 48 mgd, which is twice the current capacity. In addition, a new regional off-stream reservoir with a capacity of approximately 6 billion gallons is under construction, and pipe networks will be expanded to optimize water delivery throughout the region. Completion of this next expansion under the current Water Use Permit is expected during 2009.
On December 10, 1975, the Consumptive Use Permit #7500016 for the Peace River Regional Water Supply Facility was signed between General Development Utilities, Inc. and the Southwest Florida Water Management District. In conjunction with this agreement, a comprehensive Hydrobiological Monitoring Program was set forth to assess the responses of various physical, chemical and biological characteristics of the Charlotte Harbor Estuary to changes in Peace River flow. The program was designed to evaluate the influences and significance of natural salinity changes on the aquatic fauna and flora in upper Charlotte Harbor, and to determine if freshwater withdrawals by the Peace River Regional Water Supply Facility could be shown to alter these patterns. The area of study is shown in Figure 1.1.
In 1976 the initial monitoring elements of the HBMP were designed in coordination with District staff to provide answers to specific questions raised during the original permitting process. These questions raised concerns regarding the potential for negative impacts potentially associated with salinity changes in the lower Peace River/upper Charlotte Harbor estuarine system resulting from freshwater withdrawals. Analysis of data from pre- and post-water treatment plant operation, presented in the August 1982 Summary Report, indicated the need to revise the monitoring program to better evaluate changes in the Charlotte Harbor system due to both natural seasonal and longer-term variations in freshwater inflows, and relative magnitude and timing of changes due to Facility withdrawals. Further modifications and refinements to the HBMP were made in 1985 and again in conjunction with the renewal of the Water Use Permit in November 1988.
The current Water Use Permit (No. 20010420) was issued by the District to the Authority in March 1996. The permit contained specific conditions for the continuation and enhancement of the Hydrobiological Monitoring Program for the lower Peace River/upper Charlotte Harbor Estuary. The HBMP study elements specified in the 1996 permit were designed to build upon and add to the HBMP monitoring activities that have been ongoing since 1975, and predate the 1980 completion and initial consumptive Facility withdrawals. The initial background and
Introduction/Summary
Peace River Manasota Regional 1-4 2008 HBMP Annual Data Report Water Supply Authority May 2009
HBMP monitoring conducted prior to operations provided a basis for pre-withdrawal conditions against which later comparisons were made.
Between 1979 and 2008, an ongoing series of individual reports have been submitted to the District, documenting the results of the HBMP during the period from January 1976 through December 2006. These reports include summarizations (findings) of data collected during the first four years of baseline monitoring, prior to the start of freshwater withdrawals, as well as comparisons of these data to the results obtained from the HBMP during subsequent years of water treatment plant operation. Under the 1988 permit, data reports were required to be submitted annually, and two expanded Comprehensive Summary Reports were submitted that included a range of comparative analyses of the data reported over the preceding periods. The first Comprehensive Summary Report was finalized in December 1993 and included analyses of long-term data collected between 1983 and 1991. The next Comprehensive Summary Report was filed in draft form in 1994 (finalized in April 1995), and statistically summarized and evaluated the results of the HBMP study elements conducted between 1976 and 1993.
The 1996 Water Use Permit specifies reporting requirements with respect to data collected and interpreted under the HBMP. In addition to Annual Data Reports, the permit requires limited Mid-term Reports and much more extensive Comprehensive Summary Reports to be submitted to the District approximately after the third and fifth years of each five-year interval of the duration of the 20-year permit. Due to increased public concerns regarding long-term hydrologic alterations of freshwater flows in the Peace River watershed, the Authority has expanded the level of data analysis in all of the HBMP Reports beyond that originally envisioned during the 1996 permit renewal. The primary focus of these additional increased statistical analyses and evaluations have been specifically directed toward further assessing both the magnitude and distribution of potential impacts resulting from current and projected future Facility withdrawals under the 1996 permit. The HBMP Scientific Review Panel (Panel) also recommended a number of significant modifications and additions to the HBMP over recent years. In addition to these program modifications, the Panel has provided suggestions and asked questions about the HBMP data which have been included in recent HBMP reports.
The 2002 Peace River HBMP Comprehensive Summary Report (named for the period through which HBMP dat