PCSF: An R-package for network-based
interpretation of high-throughput data
Murodzhon Akhmedov1,2,3,4, Amanda Kedaigle4, Renan Escalante Chong4¤ , Roberto Montemanni1, Francesco Bertoni2, Ernest Fraenkel4*, Ivo Kwee1,2,3*
1 Dalle Molle Institute for Artificial Intelligence Research (USI/SUPSI), Manno, Switzerland, 2 Institute of
Oncology Research (IOR), Bellinzona, Switzerland, 3 Swiss Institute of Bioinformatics (SIB), Lausanne, Switzerland, 4 Department of Biological Engineering, MIT, Cambridge, Massachusetts, United States of America
¤ Current address: Systems Biology, Associate Director, Immuneering Corporation, Cambridge, Massachusetts, United States of America
*[email protected](EF);[email protected],[email protected](IK)
Abstract
With the recent technological developments a vast amount of high-throughput data has been profiled to understand the mechanism of complex diseases. The current bioinformatics challenge is to interpret the data and underlying biology, where efficient algorithms for ana-lyzing heterogeneous high-throughput data using biological networks are becoming increas-ingly valuable. In this paper, we propose a software package based on the Prize-collecting Steiner Forest graph optimization approach. The PCSF package performs fast and user-friendly network analysis of high-throughput data by mapping the data onto a biological net-works such as protein-protein interaction, gene-gene interaction or any other correlation or coexpression based networks. Using the interaction networks as a template, it determines high-confidence subnetworks relevant to the data, which potentially leads to predictions of functional units. It also interactively visualizes the resulting subnetwork with functional enrichment analysis.
This is aPLOS Computational BiologySoftware paper.
Introduction
A tremendous quantity of high-throughput data at multiple layers of cellular systems has been profiled to study biological responses to perturbations and diseases. The current challenge is to develop methods for effective analysis of these data to better interpret underlying biology and identify functional units. Network modeling approaches are some of the techniques lately used for analysis of biological networks [1,2]. Recently, the Prize-collecting Steiner Forest (PCSF) algorithm has been applied to interaction networks to find a subnetwork enriched for input data, which corresponds to relevant subunits in the interactome of a cell [3,4].
a1111111111 a1111111111 a1111111111 a1111111111 a1111111111 OPEN ACCESS
Citation: Akhmedov M, Kedaigle A, Chong RE,
Montemanni R, Bertoni F, Fraenkel E, et al. (2017) PCSF: An R-package for network-based interpretation of high-throughput data. PLoS Comput Biol 13(7): e1005694.https://doi.org/ 10.1371/journal.pcbi.1005694
Editor: Dina Schneidman, Hebrew University of
Jerusalem, ISRAEL
Received: May 3, 2017 Accepted: July 23, 2017 Published: July 31, 2017
Copyright:©2017 Akhmedov et al. This is an open access article distributed under the terms of the
Creative Commons Attribution License, which
permits unrestricted use, distribution, and reproduction in any medium, provided the original author and source are credited.
Data Availability Statement: The package and
tutorials are available on GitHub athttps://github.
com/IOR-Bioinformatics/PCSF.
Funding: MA was supported by the Swiss National
Science Foundation (205321-147138/1,www.snf. ch). MA (partially) and AK were supported by the National Institute of Health (U54-NS-091046 and U01-CA-184898,www.nih.gov). The funders had no role in study design, data collection and analysis, decision to publish, or preparation of the manuscript.
The PCSF problem has NP-hard characteristics, and it requires a great deal of effort to find exact solutions on larger biological networks. Recently, we have developed a fast heuristic for the PCSF [5], and conducted a detailed performance comparison with existing methods [6]. As an extension to this, we present an R package that performs fast and user-friendly analysis of high-throughput data using the interaction networks as a template, and interprets the bio-logical landscape of interactome with respect to the data. More specifically, the PCSF package allows the user to i) upload the interactome and patient data ii) compute the PCSF subnetwork solution iii) perform functional analysis on resulting subnetwork iv) and interactively visualize the final subnetwork with functional enrichment information.
Design and implementation
The PCSF methodology
The PCSF is a well-known problem in graph theory. Given an undirected graphG= (V,E), where the vertices are labeled with prizespvand the edges are labeled with costsce>0, the
goal is to identify a subnetworkG0= (V0,E0) with a forest structure. The target is to minimize
the total edge costs inE0, the total node prizes left out ofV0, and the number of trees inG0. This
is equivalent to minimization of the following objective function:
FðG0Þ ¼MinimizeX
e2E0 ceþb
X
v2=V0pvþwk ð1Þ wherekis the number of trees in the forest, and it is regulated by parameterw. The parameter βis used to tune the prizes of nodes relative to edge costs.
Recently, we have applied PCSF to biological networks in the Forest module of the Omics Integrator software [4]. In biological networks such as protein-protein interaction (PPI) net-works, every vertex represents a biomolecule, and every edge corresponds to the cellular inter-action between two biomolecules. Edges of the network are given costs which correspond to confidence or frequency of that interaction. The vertices of the network are given prizes according to the measurements of differential expression, copy number, or number of muta-tion for that gene or protein. The set of vertices that are assigned a prize are referred to as termi-nalnodes. Non-terminal nodes, which were not observed in the experimental data, may appear in the solution and are calledSteinernodes. After scoring the interactome, the PCSF is used to detect a relevant subnetwork (forest). The PCSF aims to identify neighborhoods in interaction networks potentially belonging to the key dysregulated pathways of a disease or experiment.
In order to avoid a bias for the hub nodes of PPI networks to appear in solution of PCSF, we use the method introduced in Forest [4], which penalizes the prizes of nodes according to their degree in the PPI. Within the implementation, we use the parameterμto fine-tune the penalties as:
p0
v¼pv mdegreeðvÞ: ð2Þ
The parameterμalso affects the total number ofSteinernodes in the solution. The higher the value ofμ, the smaller the number ofSteinernodes in the subnetwork, and vice-versa. The rec-ommended range ofμfor biological networks is between 1e-4 and 5e-2 to fine-tune the Steiner/terminalnode ratio in the subnetwork and averageSteiner/terminalin-degree ratio of the corresponding nodes in the original template network.
Implementation, dependencies, and installation
The software was implemented in R environment, and easily can be installed within the R ter-minal. As input, the package requires a template network such as protein-protein interaction, Competing interests: The authors have declared
protein-metabolite interaction or any other correlation-based interaction network, and it maps differentially expressed genes/proteins/metabolites from the high-throughput data as vertex prizes into the template network. Then, it computes and returns high-scoring neighbor-hoods to identify functional modules in the interactome. Required parameters are:β—for tun-ing the vertex prizes,ω—for regulating the number of distinct components in the subnetwork, andμ—for hub penalization.
The package has the following R-package dependencies: • BH and igraph—for efficient graph handling and calculations, • httr, methods, org.Hs.eg.db, and topGO—for enrichment analysis, • Rcpp—to employ C++ source code within R,
• visNetwork—for visualization.
The dependencies are automatically installed along with the PCSF package. For more details about the package dependencies and installation we refer the reader to see the supple-mentary documents.
The software test
A software was successfully installed and tested in the following environments: Mac OS X (10.12.4) R 3.4.0, Ubuntu (16.04) R 3.2.3, Windows 7 R 3.4.1. We have analyzed over 100 bio-logical network instances within the computational performance comparison, and illustrated our method in a biological application to interpret the phosphoproteomic data derived from H358 cells, a model of lung cancer. Few dozens of people have tested the package on installa-tion, debugging, parameter setting, and own data. We provided the interaction network and the phosphoproteomic data from the lung cancer within the package. Any bugs, suggestions and request related to the package can be reported throughout its GitHub repository (https:// github.com/IOR-Bioinformatics/PCSF).
Results
Computational performance comparison
In this section, we compare the computational performance of our method with the message passing (MSGP) [3] algorithm. The belief propagation has been used in similar biological application such as identification of unknown protein associations [3], prediction of hidden components in regulatory networks [7], and reconstruction of multiple dysregulated pathways [8]. As a template network, we used an integrated interactome of proteins [9] and metabolites [10], which composed of 36892 nodes and 1016411 edges. We employed the phosphoproteo-mic data from the Breast Cancer patients in [11]. A network instances are generated by map-ping each patient’s differential phosphoproteomic data asterminalnodes onto template interactome. We tested the methods forω= {1, 2}, and provided the average statistics of 10 runs to maintain a fair comparison baseline.
The comparison statistics of the methods are reported inTable 1. The performance of the MSGP [3] algorithm [3] and our method are provided under the MSGP and PCSF columns, respectively. Theμvalue was set to 0 for both methods to be comparable, which removes its impact on the objective function values. The solution qualities and running times of the approaches are displayed in the table. For these large network instances, the PCSF provides comparable quality solutions to the belief propagation algorithm for both values ofω. On other hand, the PCSF significantly outperformed the belief propagation in terms of running
times. There is approximately ten times speed up on average, and it can be useful to analyze large biological networks in a reasonable time.
For more information about the PCSF algorithm and rigorous performance comparisons, the interested readers are referred to [6].
Biological application
In this section, we demonstrate the usage of the PCSF package on biological data, discuss the package functionalities and its output within the R environment. We analyze differential phos-phoproteomic data derived from H358 cells, a model of lung cancer, that were stimulated with TGF-β. These data were previously published in [12], and were also used to demonstrate Omics Integrator [4]. We construct a template PPI network from the STRING database (ver-sion 13) [9] and apply some filtering steps [6]. A named vector containing the proteomic data and a data frame containing the filtered PPI is available within the package. The template net-work and data are loaded into R environment as follows:
> data(“STRING”)
> ppi <- construct_interactome(STRING) > data(“Tgfb_phospho”)
> terminals <- Tgfb_phospho
The resulting PPI network consists of 17581 edges and 15405 nodes, out of which 58 termi-nal nodes correspond to differentially phosphorylated proteins. After loading the PPI network and assigning the terminal prizes, we usePCSF()to find high-confidence subnetworks by
Table 1. The results of the methods for the Breast Cancer network instances generated using the phosphoproteomic data in [11]. The performance
of the message passing algorithm [3] and the proposed method are respectively displayed under MSGP [3] and PCSF forω= {1, 2}. The OBJ column reports the quality of the solutions (objective function values) obtained by the methods, and the running times of the algorithms are displayed under t(s) in seconds. The average statistics of 10 runs provided by both algorithms are reported for each instance.
ω= 1 ω= 2
MSGP [3] PCSF MSGP [3] PCSF
Instance Terminals OBJ t(s) OBJ t(s) OBJ t(s) OBJ t(s)
Basal-AN-A0AL 92 26.94 1920 27.18 101 27.94 2025 28.18 100 Basal-BH-A18Q 283 80.81 2188 81.31 291 82.89 1532 82.8 297 Her2-C8-A12Z 63 19.42 1422 19.51 71 20.42 1151 20.51 71 Her2-C8-A12L 75 25.07 1002 25.31 83 26.07 1134 26.31 83 Her2-A2-A0EQ 139 35.02 1583 35.33 147 36.02 1545 36.33 148 Her2-C8-A135 193 52.83 1762 53.19 199 53.85 1680 54.22 200 LumA-AO-A0JJ 168 50.2 1970 50.57 176 51.38 1729 51.83 175 LumA-A8-A08Z 174 48.55 1749 48.81 179 49.61 1904 49.87 181 LumA-BH-A0C1 201 52.42 2092 52.82 210 53.42 1992 53.82 207 LumB-AN-A0AJ 149 42.94 2220 43.32 155 43.96 1732 44.35 156 LumB-A7-A0CJ 158 45.36 2506 45.84 167 47.02 1476 47.52 170 LumB-AR-A1AV 190 56.47 1656 56.88 199 57.85 1506 58.26 198 LumB-AO-A03O 193 54.95 1878 55.22 205 55.87 1239 56.22 197 LumB-BH-A0DD 230 60.31 2297 60.65 235 61.37 2358 61.71 238 LumB-A2-A0T3 248 65.83 1793 66.05 261 66.91 2053 67.13 256 mean 47.81 1869 48.13 179 48.97 1670 49.27 178 std 16.26 377 16.32 62 16.43 354 16.42 62 https://doi.org/10.1371/journal.pcbi.1005694.t001
providing parametersβ,ωandμas it is discussed in Section. The dynamic and interactive out-put subnetwork can be plotted withplot()function.
> subnet <- PCSF(ppi, terminals, w = 2, b = 1, mu = 0.0005) > plot(subnet)
Given that the edge weights and input data were often derived from high-throughput data and are necessarily noisy, it is recommended to test the robustness of the solution. One way to do this is to solve the PCSF several times while adding noise to edge costs, and combine all results in the final subnetwork. Edges and nodes are then given scores indicating how many times they appeared in the solutions with varying edge costs.
> subnet <- PCSF_rand(ppi, terminals, n = 10, r = 0.1, w = 2, b = 1, mu = 0.0005)
Next, an enrichment analysis of the final subnetwork is performed for functional interpreta-tion. The subnetwork is clustered using the edge betweenness clustering algorithm from the igraph R-package, and for each cluster, functional enrichment is done by employing either EnrichR [13] API or topGO [14] R-package that can be specified by the user. Note that EnrichR API requires a working internet connection to perform the enrichment. If not speci-fied, the package defaults to EnrichR, it uses topGO if there is no internet connection.
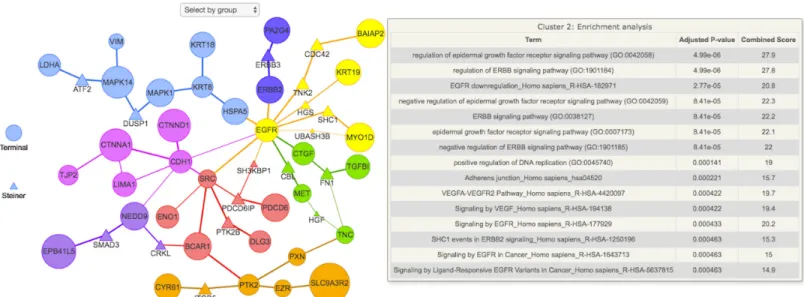
An interactive version of the annotated subnetwork can be visualized as inFig 1. In the case of the Tgf-βstimulation data, the subnetwork provided by PCSF was enriched for relevant Gene Ontology terms like “mesenchymal-epithelial cell signaling” and “EGFR downregula-tion”. We also see Steiner nodes such as CBL and ITGB5, which have been shown to be involved in several models of non-small cell lung cancers [15], like the H358 cells. Therefore, we see that the PSCF algorithm points out proteins and pathways that are highly relevant to the system under study.
Fig 1. Functional enrichment analysis of the final subnetwork using the EnrichR API. The node sizes and edge widths are proportional to the amount of
times that node or edge appeared in the noisy runs. Nodes are colored according to cluster membership. As in the EnrichR API, the p-value is calculated using the Fisher test and adjusted for multiple hypotheses. The top 15 functional enrichment terms for each cluster are ranked according to the adjusted p-value and displayed in a tabular format when the mouse hovers over a node in that cluster. Each cluster can be visualized separately by “Select by group” icon located at the top of the figure.
> res <- enrichment_analysis(subnet) > plot(res$subnet)
Availability and future directions
The source code of the package and the tutorials are available on GitHub athttps://github. com/IOR-Bioinformatics/PCSF. The package is accompanied with the building and installing documentation, a detailed vignette and reference manual to demonstrate the usage of its func-tions. We used the MIT open source software license for the package.
The PCSF is a general method and it also can be applied to interpret multi-omics data for functional analysis. We plan to integrate genomic, transcriptomic, proteomic and metabolo-mic high-throughput data by mapping them onto biological networks and solving the PCSF. Heterogeneous omics data integration is extremely challenging task. At the same time, it is crucial to have overall picture and understanding of cellular mechanism in deep, and develop effective therapeutic strategies for complex diseases. Currently, the bioinformatics community is still missing effective data integration techniques, and we believe our method will be one-step contribution for improving the available methods in the literature.
The last but not least, the proposed package is significantly faster compared to the previous network based PCSF methods, which can analyze large biological networks in a reasonable time.
Supporting information
S1 File. A vignette for the package.
(HTML)
S2 File. A reference manual of the package.
(PDF)
Author Contributions
Conceptualization: Murodzhon Akhmedov, Roberto Montemanni, Ivo Kwee. Data curation: Amanda Kedaigle, Ernest Fraenkel.
Formal analysis: Murodzhon Akhmedov.
Funding acquisition: Roberto Montemanni, Francesco Bertoni, Ernest Fraenkel, Ivo Kwee. Methodology: Murodzhon Akhmedov, Roberto Montemanni, Ivo Kwee.
Project administration: Roberto Montemanni, Ivo Kwee. Resources: Francesco Bertoni, Ernest Fraenkel.
Software: Murodzhon Akhmedov, Ivo Kwee.
Supervision: Roberto Montemanni, Francesco Bertoni, Ernest Fraenkel, Ivo Kwee. Validation: Murodzhon Akhmedov, Amanda Kedaigle, Ivo Kwee.
Visualization: Murodzhon Akhmedov, Renan Escalante Chong. Writing – original draft: Murodzhon Akhmedov.
References
1. Dittrich M.T., Klau G.W., Rosenwald A., Dandekar T. and Mueller T. (2008) Identifying functional mod-ules in protein-protein interaction networks: an integrated exact approach, Bioinformatics, 24(13), i223–i231.https://doi.org/10.1093/bioinformatics/btn161PMID:18586718
2. Beisser D., Klau G.W., Dandekar T., Mueller T. and Dittrich M. (2010) BioNet: an R-package for the Functional Analysis of Biological Networks, Bioinformatics, 26(8), 1129–1130.https://doi.org/10.1093/ bioinformatics/btq089PMID:20189939
3. Bailly-Bechet M., Borgs C., Braunstein A., Chayes J., Dagkessamanskaia A., Franc¸ois J.M. and Zec-china R. (2010) Finding undetected protein associations in cell signaling by belief propagation, PNAS, 108, 882–887.https://doi.org/10.1073/pnas.1004751108PMID:21187432
4. Tuncbag N., Gosline S.J.C., Kedaigle A., Soltis A.R., Gitter A. and Fraenkel E. (2016) Network-Based Interpretation of Diverse High-Throughput Datasets through the Omics Integrator Software Package,
PLoS Comput Biol, 12(4), e1004879.https://doi.org/10.1371/journal.pcbi.1004879
5. Akhmedov M, Kwee I, and Montemanni R. (2016) A divide and conquer matheuristic algorithm for the Prize-collecting Steiner Tree Problem, Computers and Operations Research, 70, 18–25.https://doi. org/10.1016/j.cor.2015.12.015
6. Akhmedov M., LeNail A., Bertoni F., Kwee I., Fraenkel E. and Montemanni R. (2017) A fast Prize-col-lecting Steiner Forest algorithm for Functional Analyses in Biological Networks, Lecture Notes in
Com-puter Science, 263–276.https://doi.org/10.1007/978-3-319-59776-8_22
7. Tuncbag N., Braunstein A., Pagnani A., Huang S.C., Chayes J., Borgs C., Zecchina R. and Fraenkel E. Simultaneous Reconstruction of Multiple Signaling Pathways via the Prize-Collecting Steiner Forest Problem. Journal of Computational Biology, 20(2):124–136, 2013.https://doi.org/10.1089/cmb.2012. 0092PMID:23383998
8. Tuncbag N., McCallum S. Huang S.C., and Fraenkel E. SteinerNet: a web server for integrating ‘omic’ data to discover hidden components of response pathways. Nucleic Acids Research, 1–5, 2012.
9. Szklarczyk D., Franceschini A., Kuhn M., Simonovic M., Roth A., Minguez P., Doerks T., Stark M., Muller J., Bork P., Jensen L.J. and Mering C.v. (2011) The STRING database in 2011: functional inter-action networks of proteins, globally integrated and scored, Nucleic Acids Res, 39, D561–D568.https:// doi.org/10.1093/nar/gkq973PMID:21045058
10. Wishar D.S., Tzur D., Knox C., Eisner R., Guo A.C., Young N.,. . .and Fung C. (2007). HMDB: the Human Metabolome Database. Nucleic Acids Res. 2007 Jan; 35(Database issue):D521–6.https://doi. org/10.1093/nar/gkl923
11. Mertins P., Mani D.R., Ruggles K.V., Gillette M.A., Clauser K.R., Wang P.,. . .and Kawaler E. (2016). Proteogenomics connects somatic mutations to signalling in breast cancer. Nature, 534:55–62, June 2016.https://doi.org/10.1038/nature18003PMID:27251275
12. Thomson S., Petti F., Sujka-Kwok I., Mercado P., Bean J., Monaghan M., Seymour S.L., Argast G.M., Epstein D.M. and Haley J.D. (2011) A systems view of epithelial-mesenchymal transition signaling states, Clinical & experimental metastasis, 28(2),.
13. Chen E.Y., Tan C.M., Kou Y., Duan Q., Wang Z., Meirelles G.V., Clark N.R. and Ma’ayan A. (2013) Enrichr: interactive and collaborative HTML5 gene list enrichment analysis tool, BMC Bioinformatics, 128(14),.
14. Alexa A. and Rahnenfu¨hrer J. (2009). topGO: Enrichment Analysis for Gene Ontology. R package ver-sion 2.28.0.
15. Tan Y.H.C., Krishnaswamy S., Nandi S., Kanteti R., Vora S., Onel K.,. . .and Robinson M. (2010). CBL Is Frequently Altered in Lung Cancers: Its Relationship to Mutations in Met and Egfr Tyrosine Kinases,
PloS One, 5 (1), Public Library of Science: e8972.https://doi.org/10.1371/journal.pone.0008972PMID:
![Table 1. The results of the methods for the Breast Cancer network instances generated using the phosphoproteomic data in [11]](https://thumb-us.123doks.com/thumbv2/123dok_us/91731.2510439/4.918.54.862.175.554/results-methods-breast-cancer-network-instances-generated-phosphoproteomic.webp)