Structure determination of Cu(4 1 0)–O using X-ray
diffraction and DFT calculations
E. Vlieg
a,b, S.M. Driver
c, P. Goedtkindt
b, P.J. Knight
c, W. Liu
d, J. L€
u
udecke
c,
K.A.R. Mitchell
d, V. Murashov
d, I.K. Robinson
e, S.A. de Vries
b,
D.P. Woodruff
c,*aDepartment of Solid State Chemistry, University of Nijmegen, 6525 ED Nijmegen, The Netherlands b
FOMInstitute for Atomic and Molecular Physics, Kruislaan 407, 1098 SJ Amsterdam, The Netherlands
c
Department of Physics, University of Warwick, Coventry CV4 7AL, UK
d
Department of Chemistry, University of British Columbia, Vancouver, BC, Canada V6T 1Z1
e
Department of Physics, University of Illinois at Urbana-Champaign, 1110 W. Green Street, Urbana, IL 61801, USA
Received 28 May 2002; accepted for publication 9 July 2002
Abstract
The Cu(4 1 0)–O surface, involving a 0.5 monolayer (ML) coverage of oxygen, is known to be extremely stable and a range of Cu(1 0 0) vicinal surfaces facet to (4 1 0) in the presence of adsorbed oxygen. A new surface X-ray diffraction investigation of this surface has been conducted to determine its structure, and the detailed structural parameter values obtained are compared with the results of a density functional theory (DFT) calculation. The results show that the metal structure is unreconstructed, with the oxygen forming an overlayer with 0.25 ML O atoms at near-colinear step-edge sites and 0.25 ML O atoms at mid-terrace hollow sites, approximately 0.6AA above the terraces. The large number of independent structural parameters potentially relevant to this vicinal surface presents a significant challenge for unique structural optimisation, but various missing row reconstruction models can be clearly excluded. Two detailed structural solutions are identified which give equally acceptable fits to the X-ray diffraction data after imposition of a Lennard-Jones penalty factor. These models differ especially in the O positions, but one is found to be more favoured by comparison with the results of the DFT calculations, and by considerations based on bond lengths and valence. Substantial relaxations from the bulk metal positions occur for the outermost Cu atoms; the ability of the vicinal surface to relax in this way may help to account for its stability compared with the missing row reconstruction induced by oxygen chemisorption on the Cu(1 0 0) surface.
Ó 2002 Elsevier Science B.V. All rights reserved.
Keywords: Surface structure, morphology, roughness, and topography; Surface relaxation and reconstruction; X-ray scattering, diffraction, and reflection; Chemisorption; Copper; Oxygen; Vicinal single crystal surfaces
1. Introduction
The phenomenon of adsorbate-induced facet-ing of surfaces has been recognised for many years. Typically metal surfaces show only weak www.elsevier.com/locate/susc
*
Corresponding author. Fax: +44-247-6692016.
E-mail address:d.p.woodruff@warwick.ac.uk(D.P. Wood-ruff).
0039-6028/02/$ - see front matter Ó 2002 Elsevier Science B.V. All rights reserved. PII: S 0 0 3 9 - 6 0 2 8 ( 0 2 ) 0 2 0 6 6 - 6
variations in the surface free energy as a func-tion of orientafunc-tion (the so-called c-plot), at least at temperatures sufficiently high to be studied through the equilibrium shape of small particles, and weak cusps in thec-plot only occur at one or two of the most closely-packed low-index surface orientations, leading to small planar facets on the equilibrium shape (see, for example, [1,2] and ref-erences therein). In the presence of certain adsor-bates, however, much stronger variations in the surface free energy are sometimes seen, and the favoured low energy orientations in these cases may be higher Miller index vicinal surfaces. One of the best-known examples of this type is the facet-ing of Cu(1 0 0) vicinal surfaces to {4 1 0} orien-tations in the presence of adsorbed atomic oxygen [3–11]. A clear implication is that Cu(4 1 0)–O is a particularly low energy structure. Even in the ab-sence of any detailed quantitative understanding of the structure of this surface, the fact that it apparently is strongly favoured was used to try to understand the structure of the (2p2p2)R45° -O structure of the singular Cu(1 0 0) surface [12]. This surface phase, which corresponds to a cov-erage of oxygen of 0.5 monolayer (ML), is quite different from the c(22) (or more properly (p2p2)R45°) which typifies the 0.5 ML struc-tures of many atomic adsorbates on other fcc(1 0 0) surfaces (including, for example, O on Ni(1 0 0)) but the 2p2-R45° periodicity of this structure is the same as the width of the (1 0 0) terraces in the Cu(4 1 0) surface (Fig. 1). This led to the idea that this periodicity may be the spacing of missing rows
of Cu atoms, leading to the creation of local ‘step-edges’ on the singular surface similar to those of the regularly stepped (4 1 0) face (Fig. 2). Several quantitative structural studies of the Cu(1 0 0)-(2p2p2)R45°-O surface [7,12–16], further re-inforced by scanning tunnelling microscopy (STM) [17] have shown that this is, indeed, the case. De-spite quite a number of investigations of the Cu(4 1 0)–O surface [7,9,10,18–21] however, the detailed structure has remained controversial.
Another important aspect of the Cu(4 1 0)–O surface is that it is an interesting case of a stepped surface which is extremely well-ordered. Steps are well-known to play an essential role in phenomena like electron emission, heterogeneous catalysis and Fig. 2. Schematic plan (top) and side (bottom) view of the Cu(1 0 0)(2p2p2)R45°-O missing row structure.
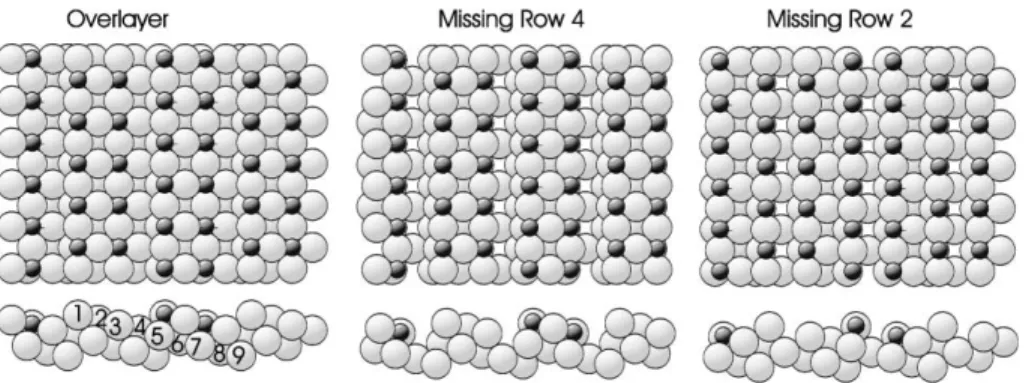
Fig. 1. Schematic plan (top) and side (bottom) views of the three basic models previously proposed for the Cu(4 1 0)–O structure as discussed in the text. The numbers label the atomic rows (layers) discussed in the text and the tables.
crystal growth. However, knowledge of the struc-tural details at steps remains sparse, and this is especially true for chemisorption systems. One reason for this is that steps are often disordered and thus their structures cannot be determined precisely by conventional diffraction techniques. The Cu(4 1 0)–O system is an exception to this rule and thus opens the possibility for a detailed structural analysis of the steps.
Fig. 1 shows a schematic diagram of the three main structural models which have been discussed for this surface; in each case the numbers which are superimposed label the inequivalent rows of atoms (and indeed each of these rows and its pe-riodically repeated equivalents define the (4 1 0) atomic layers). The simplest suggestion for the structure of the Cu(4 1 0)–O surface (Fig. 1––
‘overlayer’ model on the left) is that it comprises an essentially undistorted ideal Cu(4 1 0) surface with oxygen atoms occupying two sites which are rendered inequivalent by the presence of the steps but which would otherwise be equivalent 4-fold coordinated hollow sites arranged in a c(22) mesh on the (1 0 0) terraces. In the presence of the steps one of these sites at the step-edges (in Cu atom row 1 of Fig. 1) becomes only 3-fold coor-dinated relative to the (1 0 0) terrace but the other site, which occurs in the third Cu[0 0 1] row of the four-row wide terrace (row 3 of Fig. 1), retains its 4-fold coordination. This basic overlayer model is implicit in the original discussion of this surface phase by Perderau and Rhead [5], and subse-quently in the X-ray photoelectron diffraction in-vestigation of Thompson and Fadley [19]. A perceived difficulty with this model, however, is the mid-terrace hollow site occupation. On the singu-lar (1 0 0) surface of Cu it is clear that this simple hollow overlayer site is not stable, at least at 0.5 ML coverage, and the creation of missing Cu atom rows allowing all the adsorbed oxygen atoms to occupy step-edge sites of reduced coordination is preferred. Various theoretical arguments have been presented to account for this [22,23]. In fact some very recent studies of oxygen on Cu(1 0 0) by STM [24,25] and scanned-energy mode photo-electron diffraction (PhD) [16], at coverages too low to produce the missing row reconstruction, have indicated that under these circumstances a
simple overlayer site is occupied, but with an oxy-gen–copper outermost layer spacing significantly larger than in the reconstructed phase. Prior to this work, however, it was suggested that the (1 0 0) terraces of the Cu(4 1 0) surface may themselves have a missing Cu row as a result of the oxygen adsorption. The initial suggestion [7] was that the Cu row immediately below the step-edge may be missing (‘missing row 4’ or ‘MR4’ model, Fig. 1), creating a (1 0 0) terrace essentially identical to the local structure of the Cu(1 0 0)(2p2p2)R45°-O missing row phase (Fig. 2). An early STM study [9], on the other hand, appeared to show direct evidence of a missing row one atomic [0 0 1] row from the step-edge (‘missing row 2’ or ‘MR2’ model, Fig. 1). In this structure the Cu–O–Cu isolated chain of atoms at the step-edge is similar to those formed in the (12) reconstruction of Cu(1 1 0) by oxygen adsorption. However, a later STM study [10,11] with better atomic-scale reso-lution indicated that this was not correct, but the presence of local (4n1 0) facets with clear missing rows on the (1 0 0) terraces was interpreted as providing indirect evidence of the alternative MR4 model.
Until recently there has been very little quanti-tative structural investigation of the Cu(4 1 0)–O surface. An early low energy ion scattering inves-tigation sensitive only to the oxygen atom position at the step-edge indicated that oxygen atoms do occupy the expected edge-bridging sites of Fig. 1, but some 0.5AA above the Cu atoms [18]. A scan-ned-angle X-ray photoelectron diffraction study indicated very similar results for this step-edge site which appeared to be the only site occupied at low oxygen exposures, and that the mid-terrace row 3 hollow sites were occupied at saturation, the O atoms being 0.4AA above the nearby Cu atoms in both cases [19]. Neither study considered the pos-sibility of missing row structures, nor Cu atom position relaxations, and in both cases the esti-mated uncertainty was quite high (0.2–0.4 AA). There has been no reported use of the traditional ‘benchmark’ surface structural technique of quan-titative low energy electron diffraction (LEED) to this surface, but vicinal surfaces of this type can prove difficult for this method. This is because these surfaces have layer spacings perpendicular to
the surface that are too small for many of the standard methods of LEED theory to remain convergent, a problem that stems from the per-turbative treatment of the interlayer scattering. More exact treatments of the interlayer scattering are possible to circumvent this problem, but have not been applied to this particular system. One true quantitative structural method which does not suffer from this problem is surface X-ray diffrac-tion (SXRD), and this technique has recently been applied to study the structure of Cu(4 1 0) facets formed by oxygen dosing of a Cu(5 1 1) surface [20,21]. This study led to the conclusion that there is no oxygen-induced missing row on the (1 0 0) terraces of the (4 1 0) surface. Clearly this conclu-sion is quite different from that which might have been expected on the basis of recent discussions in the literature. Here we present the results of an independent SXRD investigation of the Cu(4 1 0)– O surface based on a Cu(4 1 0) crystal surface in-volving a significantly larger dataset. Even with this enlarged data base we find some ambiguity in the detailed structure, a problem related to the potentially large number of structural variables in the multilayer distortions which are possible on vicinal surfaces. Our results exclude several struc-tural models involving missing row reconstruc-tions on the (1 0 0) terraces, but they do indicate that the local O–Cu layer spacings of the oxygen atoms at the step-edge and mid-terrace sites differ significantly. We also present the results of new density functional theory (DFT) calculations which lead to very similar conclusions, and sup-plementary support is provided by valence con-siderations.
2. Methods used
2.1. SXRD measurements
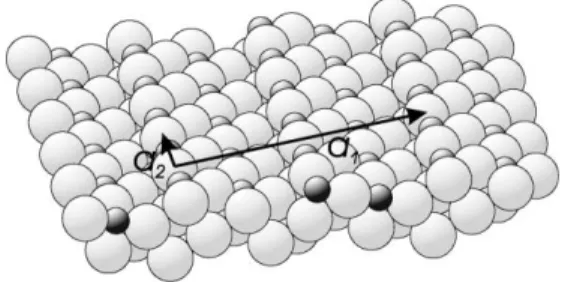
In order to describe the structure of Cu(4 1 0) we use a surface unit cell with lattice vectors {ai} that can be expressed in the conventional bulk fee lattice vectors as
a1¼ ½144 0fcc; a2¼ ½0 011fcc; a3¼ ½4 1 0fcc: ð1Þ
Note that with this choice the unit cell is twice the size of the primitive surface unit cell, but that the lattice vectors are orthogonal with a1¼a3¼
14:905 AA,a2¼3:615 AA (Fig. 3). This is the same
cell as used by Walko and Robinson for the {1 0 4} facets on the oxygen covered Cu(1 1 5) surface [20]. The direct space lattice vectors define the recipro-cal lattice vectors fbig by the relation aibi¼ 2pdij. The momentum transfer vector Q is then written as
Q¼hb1þkb2þlb3 ð2Þ
with (hkl) the diffraction indices. As is conven-tional in surface diffraction, handkare along the in-plane direction whileldenotes the out-of-plane momentum transfer.
The experiment was performed at station 9.4 of the Synchrotron Radiation Source in Daresbury, UK, using an ultra-high vacuum chamber [26] in combination with a 5-circle surface diffractometer with extended out-of-plane detector [27,28]. In order to achieve a sufficient range of perpendicular momentum transfer, a wavelength of 0.9 AA was selected using a channel-cut monochromator [29]. The Cu(4 1 0) crystal was found to have an initial surface mosaicity of 0.9° which is larger than the bulk mosaic spread due to the cutting and polishing used to prepare this crystal. Subsequent application of several cycles of high-temperature annealing (30 min at 900 °C) to sublime the top-most layers of the crystal strongly reduced the surface mosaicity to a value of 0.03°. After this, the surface was cleaned by repeated cycles of Arþ sputtering and annealing (500 °C). Two different Fig. 3. Schematic oblique view of the overlayer model of the Cu(4 1 0)–O structure showing the translation vectors parallel to the surface which define the surface unit cell described in the text.
preparation methods were used to form the Cu(4 1 0)–O surface: (1) exposure to oxygen at a pressure of 2107mbar for 12 min at a substrate
temperature of 300 °C; (2) exposure to oxygen at 6109 mbar for 100 min at a substrate
temper-ature of 400°C. By observing the (2,0,2.1) reflec-tion during dosing, we found that in both cases the changes in surface structure ceased after a total dose of approximately 4105 mbar s. In
addi-tion to changing the surface structure, the oxygen dosing also modified the surface ordering, the width of the (2,0,2.1) reflection being reduced by a factor of three. This significant improvement in the long-range order is consistent with the fact that the Cu(4 1 0)–O surface is very favourable, as reflected by the fact that nearby vicinal orientations of copper facet to (4 1 0) in the presence of adsorbed oxygen.
All surface structure factors were measured by performing rocking scans and applying the stan-dard corrections for Lorentz factor, active sample area and beam profile [30]. The surface diffrac-tometer we used has two fixed out-of-plane de-tectors angles (c¼0°or 15°). We found that both settings yielded the same structure factor for overlapping reflections after applying the appro-priate correction factors. Two datasets were mea-sured, one for each surface preparation. The first set contained a total of 151 non-equivalent reflec-tions (out of a total of 250 measured) and had an
average agreement factor between equivalent re-flections of 0.06 [31,32], The data consist of the (0,2) and (5,1) crystal truncation rods measured at l values up to 10, and many in-plane reflections measured at l¼0:4. The two rods are shown in Fig. 4. Data points shown with negativelare ob-tained by applying Friedel’s rule to symmetry-related data with positive l. The second dataset was of similar size, had a worse agreement factor (0.13), but was found to be fully consistent with the first one. For this reason only the first dataset was used in the detailed analysis. For all model calculations and fitting we used the program ROD [33], using reduced v2 values as goodness-of-fit
criterion.
2.2. DFT calculations
A parallel investigation to determine the lowest energy structure of the Cu(4 1 0)–O surface phase has been conducted with DFT calculations using the Vienna ab initio simulation package [34–37]. Electronic interactions were described by gradient-corrected ultra-soft Vanderbilt-type pseudopoten-tials [38] with Perdew–Wang exchange correlation [39]. The energy cut-off for the plane wave basis was set at 396 eV, and the Brillouin zone was sampled with the Monkhorst–Pack technique [40] using a 261 k-point grid. Partial orbital oc-cupancies were fixed by the method of Methfessel
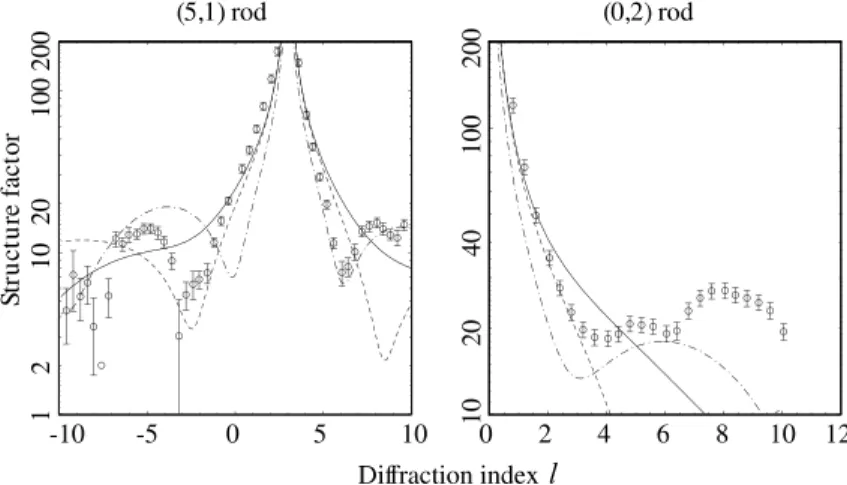
Fig. 4. Comparison of the experimental (5,1) and (0,2) rod scans (open circles) with the results of calculations for the ideal overlayer model (solid curve), MR4 model (dash-dotted curve) and MR2 model (dashed curve) with only the scale factor being optimised.
and Paxton [41], and the smearing width was set to 0.2 eV. Relaxation of ions into a minimum energy state was performed with a conjugate gradient al-gorithm, and the optimisation was terminated when the estimated error in the total energy was less than 104 eV for both electronic and ionic
minimisations. The copper surface region was modelled with a slab comprising twenty (4 1 0) atomic layers (cf. Fig. 1 which labels layers 1–9) separated by a vacuum layer of 14 AA. The slab calculations used a surface unit mesh based on the interatomic spacing found to correspond to the minimum energy for the bulk fcc phase of copper; this gave a bulk unit cell parameter of 3.642 AA, 0.7% larger than the experimental value for am-bient conditions. When comparing the results of the calculations for the surface slab with those obtained in the X-ray diffraction experiments, the calculated displacements are therefore scaled using a factor of 1.007. The orthogonal (centred) su-percell used in the calculations reported here thus had dimensions 15:017 AA3:642AA22:525 AA, and this was extended into three dimensions with periodic boundary conditions. The copper atoms in the outermost 12 layers (Cu1 to Cu12) were allowed to relax during the optimisation, while the bottom eight layers (Cu13 to Cu20) were con-strained to the positions in the bulk as obtained from the bulk DFT calculations.
3. SXRD data analysis
3.1. Comparison of alternative models
An intrinsic problem in solving the structure of vicinal surfaces is the large number of structural parameters that must be determined. The very small layer spacing perpendicular to the surface means that many layers may be modified by the presence of the surface. Indeed, as is clear from Figs. 1 and 3, the outermost four layers comprise the first, second, third and fourth Cu[0 1 0] atomic rows of the (1 0 0) terraces and are all at the solid/ vacuum interface. On singular low-index metal surfaces one commonly finds significant layer spacing changes relative to an ideally-terminated bulk structure in at least the outermost two atomic
layers, and this corresponds to eight Cu layers on Cu(4 1 0). In addition, the low symmetry of the vicinal surface means that significant displace-ments parallel to the surface can also be expected, especially for the atomic rows closest to the step-edge. Finally, one must also determine the position of the two inequivalent rows of O atoms on the surface. While it is straightforward to calculate the X-ray structure factors for the various possible models, even for this case containing close to 30 atoms in the surface unit cell, the many degrees of freedom make it difficult to find the optimum pa-rameters. Our starting point is the three distinct structural models which have previously been proposed and which are illustrated in Fig. 1. These are the simple overlayer model which seems to have been first implied by Perderau and Rhead [5] which we refer to as overlayer, the model in which the fourth Cu[0 1 0] row is missing (MR4) first proposed by Robinson et al. [7], and that in which the second Cu[0 1 0] row is missing (MR2), sug-gested by Lloyd and Woodruff [9].
In order to determine which of the models agrees best with the data, we first performed model calculations in which all parameters except an overall amplitude scaling factor were fixed. For this first fit, the oxygen atoms were placed exactly in between the Cu atoms in the same [0 1 0] row (and hence coplanar with the outermost Cu(1 0 0) terrace atoms), while the Cu atoms sites were those of an ideal termination of the bulk structure. The results of these fits are shown in Fig. 4. The v2
values for the overlayer, MR4 and MR2 models are 27.4, 36.7 and 39.3, respectively, (using the entire dataset). While this shows a slight preference for the overlayer model, all fits are bad. Other models considered (including some with sub-sur-face missing rows) gave comparable or even worse results, showing that without relaxation of the atomic positions a satisfactory fit cannot be ob-tained. This greatly complicates the identification of the best-fit structure because there are many non-equivalent atom positions in all models, and thus many independent fitting parameters.
In order to identify the most promising model in this very large parameter space, it is useful ini-tially to reduce the number of parameters which need to be adjusted by first fitting those data which
are insensitive to the relative atomic positions perpendicular to the surface. For this purpose one needs the in-plane diffracted beam intensities. An in-plane dataset with l¼0 can be estimated from the data measured atl¼0:4. We then only use 41 reflections out of the total dataset of 151. In this case we again found that without relaxation none of the models gave a good fit. However, including in-plane displacements of the three top layers, the O atoms being given the same displacement as the adjacent Cu atoms, exposed significant differences in the three models. Thev2 values in this case, for
the overlayer, MR4 and MR2 are 3.0, 9.4 and 10.1, respectively. These values strongly favour the overlayer model relative to either of the missing row models. Further modification of alternative models using additional fitting parameters, failed to find any other satisfactory fit. In complex structures there is always the potential problem of uniqueness, and the ultimate solution is necessarily constrained by the imagination of the researchers who pose the possible solutions to be explored, but extensive tests with various parameters and fitting routines (including simulated annealing) have led us to conclude that only the overlayer model leads to good results. For the reasons outlined above based on the similarities to the known missing row structure of Cu(1 0 0)(2p2p2)R45°-O we had anticipated that the MR4 model would be the correct one to describe Cu(4 1 0)–O, but while the initial model calculations looked promising (see Fig. 4), the full X-ray data show that it is wrong. This conclusion agrees with that of Walko and Robinson for their analysis of SXRD from the Cu(4 1 0) facets on a Cu(5 1 1) surface [20,21]. 3.2. Structural optimisation and relaxation deter-mination
Having established that the best structural model is the simple overlayer, the next step in the structure determination was to find the displace-ments of the atoms near the surface relative to an ideally-terminated bulk structure. For metal sur-faces, one expects the size of these displacements to decay rapidly as one moves into the bulk. At singular surfaces detectable displacements occur only for the outermost two to three layers,
corre-sponding to a distance of approximately 6AA. For the Cu(4 1 0) surface, however, the layer spacing is only 0.438AA, which means that going to a depth of 6AA involves more than 10 layers. Each atom can have a displacement along the a1 direction and
along the a3 direction. Due to symmetry, no
dis-placements alonga2 are expected. This leads to a
total of approximately 20 independent displace-ment parameters. Finding the true global mini-mum in such a large parameter space is very difficult.
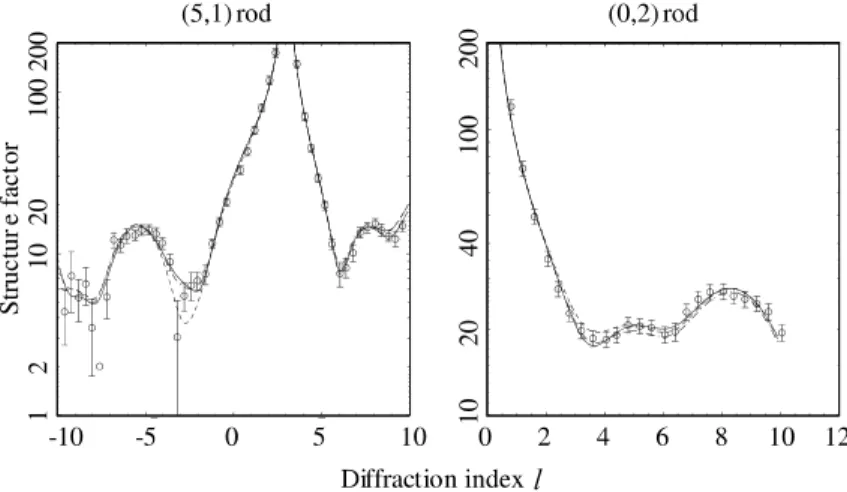
We have approached this problem in two ways. First we increased the number of fitting parame-ters step-by-step. Starting with the in-plane dis-placement parameters from the fit of the in-plane dataset, we added out-of-plane displacements in the fit of the entire dataset. We found that we needed lateral displacements in six layers (leading to eight fitting parameters because the O atoms are fitted independently from the Cu), while in the direction perpendicular to the surface about 10 layers are involved (12 fitting parameters). Adding more displacements did not lead to significant improvements in the fit, while reducing this num-ber led to fits that failed to fit the oscillations that are visible in the rods. We found that the optimum fit was obtained for Debye–Waller parameters values equal to those of the bulk. Including roughness did not improve the fits, indicating that the surface is very smooth. The final fit has a v2
value of 2.61 for the entire dataset. The results for the measured rods are shown in Fig. 5, while Fig. 6 shows the agreement for the in-plane data. The second approach we used in order to find the op-timum fit was a simulated annealing algorithm called ‘adaptive simulated annealing’ [42,43]. This very efficient code found the same optimum fit, but very much faster than our initial ‘manual’ ap-proach.
3.3. Constrained fit
The best-fit described above gives a good agreement with the X-ray data, but leads to a bond between the O atom in row 3 and the Cu atom in row 2 with length 1.53 AA. This appears unrea-sonably short compared with normal O–Cu bond lengths, which are typically in the range
1.80–1.95 AA for both bulk oxides and for chemi-sorption phases of O on Cu surfaces [7,12–16,44– 48]. Further, the list of near-neighbour O–Cu bond distances in Table 1 shows that O atoms in the ‘best-fit’ model are sometimes too far from their neighbours to meet the requirements for significant bonding interactions. The unphysical nature of
this model leads us to conclude that the X-ray dataset is insufficiently large or accurate to give a reliable determination of all displacement para-meters in the model. We should therefore constrain the possible models in some way to avoid severely unphysical solutions. One possible solution is to simply fix the displacement parameters involved in this particular bond. However, because there are many coupled displacements, a more flexible op-tion is to introduce a penalty funcop-tion for such unphysical distances. We have used a penalty function in the form of a Lennard-Jones potential. While this is certainly not a good potential to de-scribe the Cu–O interaction, it may nevertheless be a suitable penalty function, because it yields a large penalty for too short bond distances, while for very long bonds (i.e. no bonds in reality), the penalty is moderate. The software allows us to fit the X-ray data using a combination of the normal v2 and the penalty function [49]. Of course the
outcome of this procedure depends on the weight that is given to the penalty function, but we found that the results are fairly insensitive to this. In this constrained fit we included perpendicular dis-placements for 10 rows and lateral disdis-placements for the top six rows, as for the case of the un-constrained fitting.
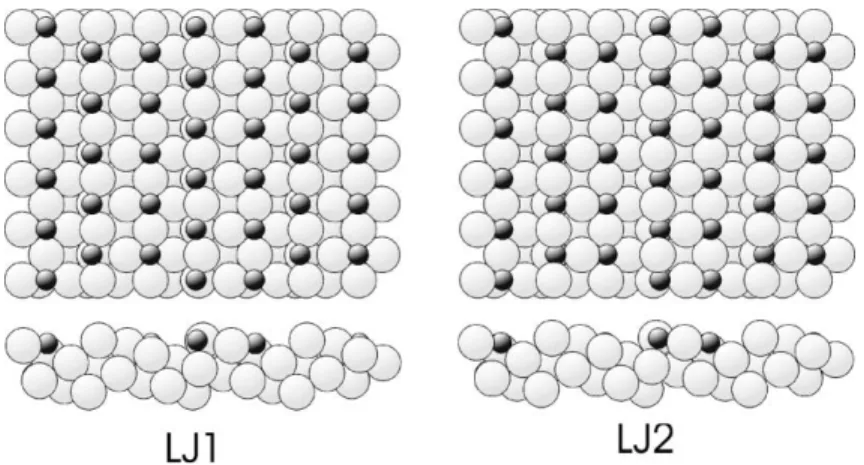
Using the Lennard-Jones penalty function we were able to obtain an excellent fit to the X-ray Fig. 5. Comparison of the experimental (5,1) and (0,2) rod scans (open circles) with the results of calculations for the best-fit overlayer structures for the unconstrained fit (solid curve), and for the two alternative fits including the Lennard-Jones penalty function (LJ1 (dash-dotted) and LJ2 (dashed)).
Fig. 6. A comparison of the in-plane structure factors as measured (grey half circles) and for the best-fit (unconstrained) overlayer model (open half circles). The radius of the half-cir-cles is drawn proportional to the structure factor amplitude.
data (v2¼2:83, compared to 2.66 for the
uncon-strained fit) without any unphysically short Cu–O bond lengths. Unfortunately, we find two equally good fits for which the full list of optimal dis-placements is shown in Table 2. Most of the dif-ferences in these parameter values are within the precision estimates, but one parameter for which the difference is significant is the lateral
displace-ment of the O atom in row 1. In the first fit (LJ1) this oxygen atom moves out from the step-edge by 0.56 AA, while in the second fit (LJ2) this atom is actually drawn in slightly at the step-edge. The fits to the experimental rod scans are shown in Fig. 5. The two models are compared in Fig. 7, while the O–Cu bond lengths are listed in Table 1. Table 3 summarises the displacements for the two different Table 1
Cu–O near-neighbour bond distances (inAA) in the different overlayer model fit structures of the present study, in the structure found in the previous SXRD study by Walko and Robinson [20], and in the structure obtained from the DFT calculations
O row number Cu row number Unconstrained fit
Constrained fit Walko and Robinson DFT calculation LJ1 LJ2 1 1 1.86 1.86 1.82 1.86 1.85 1 2 2.55 2.49 1.88 2.41 1.90 1 5 2.08 1.94 1.99 2.55 2.21 3 2 1.53 1.71 1.79 1.85 1.90 3 3 1.96 1.93 1.88 1.84 1.98 3 4 2.25 2.11 1.93 1.85 2.03 3 7 2.69 2.61 2.52 2.43 2.72 Table 2
The atomic displacements (inAA), relative to the reference overlayer model, with O atoms in the coplanar sites of the outermost (1 0 0) terrace, for the three different solutions of the overlayer model in the present study, for the structure found in the earlier SXRD study by Walko and Robinson [20], and for the structure given by the DFT calculations
Row Atom Unconstrained LJ1 LJ2 Walko and
Robinson DFT Perpendicular (z) displacements 1 Cu 0.10 0.16 0.15 0.37 0.11 1 O 0.08 0.08 0.04 0.79 0.39 2 Cu 0.25 0.24 0.27 0.28 0.27 3 Cu 0.01 0.03 0.07 0.34 0.08 3 O 0.74 0.72 0.59 0.57 0.83 4 Cu )0.10 )0.12 )0.08 0 )0.06 5 Cu )0.24 )0.10 )0.13 0 0.02 6 Cu 0.15 0.03 0.10 0 0.05 7 Cu )0.17 )0.08 )0.10 0 )0.03 8 Cu 0.08 )0.01 0.01 0 )0.01 9 Cu )0.10 )0.03 )0.05 0 0.03 10 Cu 0.10 0.05 0.06 0 0.01 Lateral (x) displacements 1 Cu )0.15 )0.14 )0.10 )0.23 )0.07 1 O )0.61 )0.56 0.06 )0.28 0.09 2 Cu 0.17 0.16 0.17 0.19 0.14 3 Cu 0.12 0.13 0.14 0.03 0.10 3 O )0.05 0.11 0.20 0.27 0.27 4 Cu 0.05 0.05 0.02 0.07 0.03 5 Cu 0.06 0.06 0.01 0.05 0.01 6 Cu 0.05 0.05 0.06 0 0.04
constrained fits including the precision esti-mates, average values from the two solutions being taken for parameters which differ by insignificant amounts.
4. Results of the DFT calculations
The inability of the X-ray diffraction analysis to distinguish between the two solutions LJ1 and LJ2 raises the question of whether supplementary in-formation can help to identify whether one of
these solutions is more likely to be correct. Of es-pecial relevance in this context are the results of our DFT calculations. Such calculations are, of course, a potential source of a wholly independent means of determining the (minimum energy) structure of a surface, but in the present case we have used these calculations not to assess the rel-ative energies of fundamentally different structural models, but rather to provide an independent de-termination of the optimum structural parameter values of the overlayer model. This should be particularly helpful in distinguishing the LJ1 and Fig. 7. Schematic plan (top) and side (bottom) views of (a) model LJ1 and (b) model LJ2.
Table 3
Summary of the fitted displacements (inAA), relative to the reference overlayer model, with O atoms in the coplanar sites of the outermost (1 0 0) terrace, for the fits to the present SXRD data including the Lennard-Jones penalty function and including the precision estimates
Row number Atom Z displace-ment rz X displace-ment rx Total dis-placement rtot 1 Cu 0.15 0.05 )0.12 0.04 0.19 0.06 1 O 0.07 0.07 )0.56/0.06 0.08 0.56/0.09 0.11 2 Cu 0.25 0.05 0.16 0.04 0.30 0.06 3 Cu 0.04 0.03 0.13 0.04 0.14 0.05 3 O 0.65 0.10 0.15 0.08 0.67 0.13 4 Cu )0.10 0.05 0.04 0.02 0.11 0.05 5 Cu )0.12 0.08 0.04 0.03 0.13 0.09 6 Cu 0.07 0.07 0.05 0.03 0.09 0.08 7 Cu )0.10 0.05 0.10 0.05 8 Cu 0.00 0.05 0.00 0.05 9 Cu )0.04 0.04 0.04 0.04 10 Cu 0.05 0.04 0.05 0.04
When these precision values are taken into account the two alternative fits are essentially equivalent except for thex-displacement of oxygen atoms in row 1 for which the two alternative values are given. For the other parameters the average values from the two different solutions are shown.
LJ2 solutions of the experimental SXRD investi-gation.
An initial DFT optimisation of the O/Cu(4 1 0) structure started from the overlayer surface model shown in Fig. 1, with all Cu atoms at bulk posi-tions, and the O atoms situated in the two ad-sorption sites, such that the O–Cu distances to terrace atoms are 1.81 AA. Energy minimisation from this starting point yielded a structure, the interatomic distances and atomic coordinates of which are listed in Tables 1 and 2. Independent optimisations, starting from the two structures given by the LJ1 and LJ2 analyses, converged to exactly the same DFT structure. Therefore, unlike the situation from the SXRD analysis, there are no local minima affecting the DFT optimisation in the region of parameter space explored. For most Cu atom positions (Table 2) differences between DFT coordinates, and those from the LJ1 and LJ2 an-alyses, are small, but there are more substantial differences for the O atoms. For these adsorbate atoms positions, especially, the DFT results more closely correspond to those from the LJ2 analysis, than from the LJ1 analysis. As might be expected, the same conclusion follows from a comparison of the O–Cu bond lengths quoted in Table 1. When compared with the experimental data the X-ray diffraction intensities expected for the DFT struc-ture yieldsv2 value of 7.0.
5. Discussion
5.1. Comparison of different analyses for Cu(4 1 0)–O The broad conclusion from this SXRD study for the Cu(4 1 0)–O surface is that 0.5 ML of O atoms are adsorbed according to the overlayer model in Fig. 1. The structure has an equal dis-tribution of O in the two adsorption sites, al-though the bonding arrangements differ. This model was first considered by Perderau and Rhead [5], although without direct evidence. Mention was made in the Introduction for the two earliest at-tempts to quantify this surface by using low energy ion scattering [18] and X-ray photoelectron dif-fraction [19]. These two early studies were directed to a determination of the heights of the O atoms
above the neighbouring Cu atoms, assuming the overlayer model in Fig. 1 to be correct. The pre-sent study, like that of the recent SXRD analysis of the Cu(4 1 0)–O surface by Walko and Robin-son [21], considered a variety of structural models and also attempted to quantify the structure in considerably more detail; it is the observations from these more recent analyses that are compared in this section.
Even with the basic overlayer model in Fig. 1, there are still two significant aspects to be dis-cussed in relation to the detailed structure. One concerns the question of the relaxations of Cu atomic positions at the surface; this is a particu-larly interesting question for a stepped surface, as there is very little prior information, as least for chemisorption systems. Comparative values of the displacements from the various analyses are listed in Table 2. An overall assessment can be made by comparing differences from the DFT calculations. The average difference over all listed displacements is 0.13, 0.10, 0.06 and 0.11 AA for the uncon-strained, LJ1, LJ2 and Walko fits, respectively, providing further confirmation that the LJ2 model agrees most closely with the DFT results. A com-parison of individual parameter values also shows only three displacements differ by more than 0.1AA between the LJ2 and the DFT structures.
The second aspect concerns the local Cu–O distances. These have chemical importance, yet present a challenge in the present study since X-ray diffraction is more sensitive to the location of the Cu atoms than of the less strongly-scattering O atoms. Indeed, this is reflected in the need to apply constraints to the X-ray diffraction structural op-timisation because it is the O–Cu bondlengths which were found to be unphysical in the uncon-strained optimisation.
The expectation for O adsorption at the mid-terrace site of Cu(4 1 0) is that the four main bonds should average out at close to 1.90 AA [15]. Some distortions are inevitable, but the individual O–Cu bonds should maintain at least comparable lengths. The data available from the various analyses allow this to be checked. The average of these four bond lengths, followed in parentheses by the range of values in each case, are: unconstrained 1.93 AA (1.53–2.25AA); LJ1 1.92AA (1.71–2.11 AA); LJ2 1.87
(1.79–1.93AA); Walko 1.85 (1.84–1.85AA); and DFT 1.97AA (1.90–2.03 AA). The unconstrained distances are clearly unsatisfactory, and were the reason for investigating the constrained solutions. The Walko model meets expectation well in this regard, as do the results from the DFT, LJ1 and LJ2 analyses. Of the latter two, the results from LJ2 may again be preferred over LJ1 since the range of O–Cu distances is reduced.
For the O atom in the step site, it is reasonable to expect bonds of similar lengths to the three neighbouring Cu atoms in the topmost layer, and one slightly longer to the second layer Cu, where the metallic coordination number is increased. The results from the different analyses (Table 1) are again summarised by stating the O–Cu bond length in each case followed by the range of values in parentheses: unconstrained 2.09 AA (1.86–2.55
A
A); LJ1 2.04 AA (1.86–2.49AA); LJ2 1.88 AA (1.82– 1.99 AA); Walko 2.17 AA (1.86–2.55 AA); and DFT 1.95 AA (1.85–2.21 AA). The O–Cu bond lengths from the LJ2 analysis, for this particular site, are most consistent with our prior expectation (in-cluding the fact that the longest bond is to the second metal layer).
While the DFT calculations indicate that the model LJ2 is to be preferred over that from the LJ1 analysis, we may also ask whether we can pick out features in the two structures that help add plausibility to this conclusion. Given that the ac-tual O/Cu(4 1 0) surface structure must be strongly influenced by the nature of the O–Cu chemisorp-tion bonding, we may test the reasonableness or otherwise of the two models in relation to basic valence considerations. It is well-known that mea-sured covalent bond lengths follow trends that are dictated by valence theory [50]. For example, fol-lowing ideas developed for bulk compounds [51], the lengths of surface bonds between metal atoms M and electronegative atoms X often follow pre-dictions of a Pauling-type relation
r¼r00:85 logs ð3Þ
for the interatomic separation between M and X for bond valences, where r0 is the corresponding
distance for a bond of unit valence. A value for the latter parameter can be assessed by comparison with an appropriate bulk compound (e.g. that
formed by M and X atoms with M in its lowest oxidation state for such a compound) [15].
For O/Cu systems, the appropriate reference bulk compound is Cu2O, where each O atom
bonds to four Cu atoms at 1.85 AA [52], yielding a value for r0 of 1.59AA. Eq. (3) can then be applied
to each adsorption site, within each structure given by the SXRD analysis, and the four bond valences summed to yield an effective valence for the O. When that is done for the LJ1 structure, the ef-fective valence values are 1.78 for the mid-terrace site and 1.45 for the step site. The corresponding values for LJ2 are 1.91 and 1.89, respectively. It is clear that the O atoms in the LJ2 structure, with an average discrepancy of 5% from the ideal valence value of 2, are more consistent with the expected basic O–Cu bonding than is the case for the LJ1 structure, where the average discrepancy is con-siderably larger (19%).
We therefore conclude that the bond valence considerations provide further support for the conclusion from the DFT calculations, namely that of the two solutions provided by the SXRD analysis, that designated LJ2 is likely to provide the best account of the Cu(4 1 0)–O surface struc-ture.
At this point it is worth summarising the key results from the present SXRD study, as repre-sented by the LJ2 analysis. With reference to the overlayer model in Fig. 1, the O atoms adsorbed at the step-edge sites are essentially co-planar with the topmost Cu atoms, and these O atoms bond to four Cu atoms at 1.88AA on average. For adsorp- tion on the mid-terrace hollow site, the O atoms are about 0.6 AA above the four local Cu atoms, with an average O–Cu bond length being close to 1.87AA. In all regards, results from the LJ2 analysis fit extremely well with conclusions from the DFT analysis, as well as with the broader chemical ex-pectations discussed.
5.2. Comparisons with Cu(1 0 0)–O
For O on Cu(1 0 0), a missing row reconstruc-tion occurs at 0.5 ML coverage, and this ar-rangement is clearly more stable than the alternative of a simple overlayer with O atoms occupying the hollow sites of the unreconstructed
surface. The situation for Cu(4 1 0)–O is that the O atoms adsorb not only at the step-edge sites, as in reconstructed Cu(1 0 0)–O, but also in mid-terrace hollow sites. As noted in the Introduction, a po-tential objection to this model, in the absence of other information, concerns whether adsorption at the simple hollow sites is likely given the situation for Cu(1 0 0)–O at 0.5 ML. However, a very recent quantitative structural study of low coverages of O on Cu(1 0 0) [16] reveals that under these circum-stances the O atoms do occupy 4-fold coordinated hollow sites, but with a Cu–O layer spacing of approximately 0.6 AA. As noted above, both the constrained and unconstrained fits to our SXRD results, as well as the DFT results, are consistent with these most recent observations on Cu(1 0 0). In all cases the O atoms which are mid-terrace (in row 3) are displaced outwards from the surface by approximately 0.6 AA whereas the O atoms at the step-edge are almost coplanar with the terraces, as in the reconstructed (1 0 0) surface.
Notice too that the much smaller lateral relax-ation of the step-edge O atom in the LJ2 model, for which the LJ2 and LJ1 solutions differ signifi-cantly, also appears to favour this solution. In this regard, a comparison with previous quantitative studies of the Cu(1 0 0)(2p2p2)R45°-O missing
row structure and the associated values of the lateral relaxations of the Cu and O atoms along the step-edges is potentially relevant. Curiously, the earlier SXRD study of this surface also yielded two alternative solutions for which differences in these values were the main distinguishing feature [7], but a comparison of the values [15] obtained from SXRD, LEED and PhD seems to indicate that the common solutions involve displacements that are much smaller than the 0.56AA of the LJ1 solution. Of course, on the (1 0 0) surface one ef-fectively has two closely-spaced opposing steps (on either side of the missing row); this may constrain the lateral distortions more, so making the two situations less similar.
The O bonding leads to significant changes in the Cu–Cu interatomic distances, in particular for rows 1, 2 and 3. Some values for these distances are quoted in Table 4. The general trend is an in-crease in the interatomic distances beyond the bulk value (2.556AA), in contrast with the contractions to be expected at the clean metallic surface. The implication is that they are a clear consequence of the bonding of the oxygen to the surface, pre-sumably a result of a weakening of the Cu–Cu bonding. The step structure at the (4 1 0) sur-face apparently allows these relaxations to be
Table 4
Comparison of Cu–Cu near-neighbour distances (inAA) for the different structural solutions within the outermost (1 0 0) terrace or between the outermost two (1 0 0) terrace layers
Row number Row number Unconstrained LJ1 LJ2 DFT DFT-LJ2 (%)
1 2 2.77 2.76 2.74 2.69 )1.9 1 4 2.51 2.56 2.58 2.56 )0.6 1 5 2.78 2.71 2.74 2.61 )4.9 1 6 2.63 2.76 2.68 2.67 )0.7 2 3 2.57 2.58 2.57 2.57 )0.2 2 5 2.93 2.83 2.91 2.80 )3.9 2 6 2.65 2.72 2.70 2.73 0.9 2 7 2.86 2.77 2.80 2.75 )1.8 3 4 2.53 2.54 2.51 2.54 1.2 3 6 2.55 2.62 2.61 2.61 0.0 3 7 2.71 2.66 2.70 2.65 )2.0 3 8 2.43 2.54 2.54 2.58 1.8 4 5 2.59 2.56 2.56 2.53 )1.3 4 7 2.63 2.58 2.59 2.57 )0.8 4 8 2.44 2.50 2.50 2.53 1.1
Note that in terms of (1 0 0) layers Cu atoms rows (i.e. (4 1 0) layers) from 1 to 4 are in the outermost layer (i.e. they are at the solid/ vacuum interface and have missing nearest-neighbours relative to the bulk) while atoms in rows 5–8 are in the second (1 0 0) layer. Also shown are the fractional difference between the LJ2 and DFT values.
accommodated without the necessity for the re-construction (with its associated energy penalty) which occurs on the (1 0 0) surface at 0.5 ML coverage. It is hypothesised that the stability of the O/Cu(4 1 0) system depends, at least in part, on the ability of the relatively narrow terraces to relax while maintaining the basic integrity of the origi-nal step structure. Clearly this idea requires eval-uation by more extensive total energy calculations, and further DFT calculations are underway to investigate the comparative energetics of these types of system.
5.3. Issues for the SXRD analysis
The SXRD analysis made here led to an un-constrained solution (with the lowest v2 value)
containing an O–Cu bond length that was clearly too short. In order to overcome this problem, a Lennard-Jones penalty function, designed to mini-mise the possibility of bond lengths being pro-duced that are outside of a reasonable range, was introduced into the SXRD analysis. This approach resulted in the SXRD analysis alone being unable to distinguish between two solutions (LJ1 and LJ2), with essentially equal v2 values, just a little
larger than that provided by the unconstrained analysis. While supplementary information has provided us with a reasonable means of distin-guishing between the LJ1 and LJ2 models, the ambiguity of the present SXRD study does open some important technical issues.
We have already remarked on the fact that solving the surface structure of a vicinal surface involves a very large number of structural pa-rameters, many of which might be expected to deviate significantly from the structure of ideal bulk termination. Clearly this raises the question of the size of the experimental dataset required to achieve a unique and meaningful solution. The data-set used here is large, with a particularly large number of in-plane diffracted beam intensities and several rod scans. The intensity values of the smaller dataset of Walko and Robinson [20] agree very well with the current measurements. Never-theless, the fitted parameters differ significantly from those found here, as Tables 1 and 2 demon-strate. The fit curves calculated from the Walko
parameters (not shown) agree well with the current data within the smaller range of the Walko data, but suddenly break away outside that range. This readily demonstrates the simple point that more data necessarily places additional constraints on the fit and allows a better determination of the structural parameters. Comparison of the changes of parameter values between the two fits, suggests that the error estimates of the earlier study [20] were too optimistic by about a factor of 5.
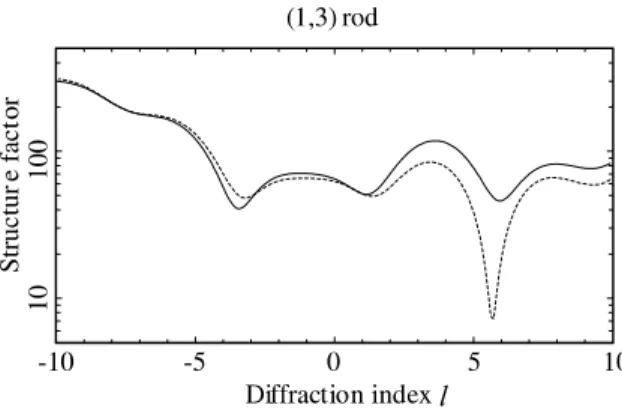
A posteriori calculations reveal that some ad-ditional measurements could resolve the specific ambiguity we have found. The (1,3) rod is found to be especially sensitive to the difference between the LJ1 and LJ2 models, as may be seen in Fig. 8. On this vicinal surface, the distance between the bulk Bragg peaks on the crystal truncation rods is 34 in units of the diffraction index l, much larger than for simple surfaces. In this case, with the available equipment, it was therefore not possible to mea-sure a full crystal truncation rod, i.e. a rod cov-ering the entire range between two bulk Bragg peaks. The part of the rod exactly between the bulk Bragg peaks is always the most surface-sen-sitive part, and this point is again demonstrated by the (1,3) rod, where the nearest Bragg peaks are at l values of )13 and 21. In hindsight, this (or a similar) rod should therefore also have been mea-sured. A largerl-range would have led to the same result. The present example further shows, some-what surprisingly, that the very large in-plane da-taset was not sufficient to distinguish between the
Fig. 8. Comparison of the computed (1,3) rod scan for the LJ1 (dashed line) and LJ2 (full line) structural models.
LJ1 and LJ2 models, even though the main dif-ference lies in the in-plane displacement of the oxygen atom in row 1. Note, however, that when calculating the agreement of the fully optimised parameter sets with the in-plane data alone, we find in fact a small preference for the LJ2 model: thev2 values are 2.4 and 2.1 for the LJ1 and LJ2
models, respectively. In summary, it remains of course true that acquiring a dataset that is as large as possible is the best guarantee to avoid ambi-guities. For structures as complicated as the pre-sent one, it is advisable to collect about four to five rods in addition to a full in-plane dataset.
6. Conclusions
Perhaps the most significant conclusion of the present study, which agrees with that of the earlier SXRD investigation of the Cu(4 1 0)–O surface, is that this low energy structure does not involve the creation of missing Cu atom rows but can be de-scribed by an overlayer model, thus resolving a long-standing debate. Oxygen atoms occupy two inequivalent sites on the surface, one at the step-edges where the O atoms are almost colinear with the [0 0 1] Cu step-edge atomic row, and a second site lying above the third Cu[0 0 1] row which is essentially a local 4-fold coordinated hollow site on the (1 0 0) terrace, approximately 0.6 AA above this hollow. These two local geometries are very similar to those found, under different circum-stances, on Cu(1 0 0). The near-coplanar step-edge sites are extremely similar to those occupied along the edges of the missing rows of the 0.5 ML Cu(1 0 0)(2p2p2)R45°-O reconstruction, and the O atoms in the mid-terrace hollow sites are like those found for low oxygen coverages on the Cu(1 0 0) surface. The Cu(4 1 0)/O surface also in-volves significant relaxations, relative to an ideally-terminated bulk structure, of the Cu atom sites closest to the step edges. This effect is well-estab-lished as a feature of the small number of clean metal vicinal surfaces which have been studied previously, but in the present case of the chemi-sorbed oxygen structure the changes are to significantly increase the nearest-neighbour inter-atomic distances of the surface metal atoms. We
suggest that the ability of the vicinal surface to accommodate large relaxations of this kind may be the key to the stability of the overlayer hollow sites which occur in the middle of the (1 0 0) terraces of the (4 1 0) surface which are not stable on extended (1 0 0) surfaces.
While the identification of the overlayer struc-ture as the proper description of this surface is in full agreement with the results of the previous SXRD study, the exact values of some of the structural parameters do differ, notably with re-gard to the O to Cu outermost layer spacings. Vicinal surfaces involve a challengingly large num-ber of unknown structural parameters because of the possibility of relaxations occurring over many layers, and while our new enlarged dataset has allowed us to optimise more of these parameters than in the earlier investigation, even in the present case there remains an ambiguity regarding the exact magnitude of the lateral displacement of the step-edge O atoms away from the ideal colinear site. Comparisons with the known behaviour of oxygen on Cu(1 0 0), however, allow us to argue quite strongly for one of the two solutions that are consistent with the new SXRD data. Moreover, the results of an independent determination of the optimum structural parameter values of the sur-face phase using DFT total energy calculations agree well with the preferred solution to the SXRD data analysis.
This study shows that very large unit cells can be analysed using SXRD. A larger dataset and/or a wider Q-range than used here could have re-moved some of the ambiguities of the results. Such widerQ-ranges are currently provided by the latest generation of surface X-ray diffraction instru-ments. There is a remarkable agreement between the experimental results and the DFT calculations, demonstrating that state-of-the-art surface science tools are able to successfully analyse complicated surface structures.
As a final comment, it is perhaps worth re-marking that this study provides an interesting example of the potential complexity of super-ficially simple surface structural problems. The three groups represented in this collaboration were each involved in investigations revealing the missing row reconstruction of the Cu(1 0 0)/O at a
time when this was widely regarded as being a simple overlayer system. This led us all to antici-pate that the Cu(4 1 0) terraces would also show missing rows in the presence of oxygen, but our new investigations shows clearly that this is not the case. With hindsight we can rationalise the result in terms of different local oxygen coverages and near-surface relaxations of the Cu atom positions, but it is the power of the experimental and theo-retical techniques used which has proved crucial in arriving at these conclusions.
Acknowledgements
We thank the Daresbury staff for assistance during the experiments, R. Koper for providing us with a high-quality Cu(4 1 0) crystal and H. Zajonz for bringing the adaptive simulated annealing method to our attention. WL, KARM and VM acknowledge support for this research provided by the Natural Sciences and Engineering Research Council of Canada. SMD, PJK, JL and DPW acknowledge the support of the Engineering and Physical Sciences Research Council (UK). EV, PG and SAV acknowledge support of the Foundation for Fundamental Research on Matter (FOM), The Netherlands.
References
[1] J.M. Blakely, Introduction to the Properties of Crystal Surfaces, Pergamon, Oxford, 1973.
[2] D.P. Woodruff, J. Phys.: Condens. Matter 6 (1994) 6067. [3] W. Berndt, Z. Naturf. A 22 (1967) 1655.
[4] L. Trepte, C. Menzel-Kopp, E. Menzel, Surf. Sci. 8 (1967) 223.
[5] J. Perderau, G.E. Rhead, Surf. Sci. 24 (1971) 555. [6] J.C. Boulliard, J.L. Domange, M. Sotto, Surf. Sci. 165
(1986) 434.
[7] I.K. Robinson, E. Vlieg, S. Ferrer, Phys. Rev. B 42 (1990) 6954.
[8] M. Sotto, Surf. Sci. 260 (1992) 235.
[9] G.W. Lloyd, D.P. Woodruff, Surf. Sci. 285 (1993) L503. [10] P.J. Knight, S.M. Driver, D.P. Woodruff, J. Phys.:
Condens. Matter 9 (1997) 21.
[11] P.J. Knight, S.M. Driver, D.P. Woodruff, Surf. Sci. 376 (1997) 374.
[12] M.C. Asensio, M.J. Ashwin, A.L.D. Kilcoyne, D.P. Woodruff, A.W. Robinson, Th. Lindner, J.S. Somers, D.E. Ricken, A.M. Bradshaw, Surf. Sci. 236 (1990) 1.
[13] H.C. Zeng, R.A. McFarlane, K.A.R. Mitchell, Surf. Sci. 208 (1989) L7.
[14] A. Atrie, U. Bardi, G. Casalone, G. Rovida, E. Zanazzi, Vacuum 41 (1990) 333.
[15] W. Liu, K.C. Wong, H.C. Zeng, K.A.R. Mitchell, Prog. Surf. Sci. 50 (1995) 247.
[16] M. Kittel, M. Polcik, R. Terborg, J.-T. Hoeft, P. Baumg€aartel, A.M. Bradshaw, R.L. Toomes, J.-H. Kang, D.P. Woodruff, M. Pascal, C.L.A. Lamont, E. Rotenberg, Surf. Sci. 470 (2001) 311.
[17] F. Jensen, F. Besenbacher, E. Lægsgaard, I. Stensgaard, Phys. Rev. B 42 (1990) 9206.
[18] A.J. Algra, E.P.Th. Suermeijer, A.L. Boers, Surf. Sci. 128 (1983) 207.
[19] K.A. Thompson, C.S. Fadley, Surf. Sci. 146 (1984) 261.
[20] D.A. Walko, I.K. Robinson, Phys. Rev. B 59 (1999) 15446. [21] D.A. Walko, I.K. Robinson, Surf. Rev. Lett. 6 (1999)
851.
[22] K.W. Jacobson, J.K. Norskov, Phys. Rev. Lett. 65 (1990) 1788.
[23] E.A. Colbourn, J.E. Inglesfield, Phys. Rev. Lett. 66 (1991) 1411.
[24] K. Tanaka, T. Fujita, Y. Okawa, Surf. Sci. 410 (1998) L407.
[25] T. Fujita, Y. Okawa, Y. Matsumoto, K. Tanaka, Phys. Rev. B 54 (1996) 2167.
[26] E. Vlieg, A. van ’t Ent, A.P. de Jongh, H. Neerings, J.F. van der Veen, Nucl. Instrum. Methods A 262 (1987) 522.
[27] M. Lohmeier, E. Vlieg, J. Appl. Cryst. 26 (1993) 706. [28] J.S.G. Taylor, C. Norris, E. Vlieg, M. Lohmeier, T.S.
Turner, Rev. Sci. Instrum. 67 (1996) 265.
[29] C. Norris, M.S. Finney, G.F. Clark, G. Baker, P.R. Moore, R. van Silfhout, Rev. Sci. Instrum. 63 (1992) 1083. [30] E. Vlieg, J. Appl. Cryst. 30 (1997) 53.
[31] R. Feidenhans’l, Surf. Sci. Rep. 10 (1989) 105.
[32] I.K. Robinson, in: G.S. Brown, D.E. Moncton (Eds.), Handbook on Synchrotron Radiation, vol. 3, North-Holland, Amsterdam, 1991, p. 221.
[33] E. Vlieg, J. Appl. Cryst. 33 (2000) 401.
[34] G. Kresse, J. Hafner, Phys. Rev. B 48 (1993) 13115. [35] G. Kresse, J. Hafner, Phys. Rev. B 49 (1994) 14251. [36] G. Kresse, J. Furthmuuller, Comput. Mater. Sci. 6 (1996)€
15.
[37] G. Kresse, J. Furthm€uuller, Phys. Rev. B 54 (1996) 11169. [38] D. Vanderbilt, Phys. Rev. B 41 (1990) 7892.
[39] J.P. Perdew, J.A. Chevary, S.H. Vosko, K.A. Jackson, M.R. Pedersen, D.J. Singh, C. Fiolhais, Phys. Rev. B 46 (1992) 6671.
[40] H.J. Monkhorst, J.D. Pack, Phys. Rev. B 13 (1972) 5188. [41] M. Methfessel, A.T. Paxton, Phys. Rev. B 40 (1989)
3616.
[42] L. Ingber, J. Math. Comp. Model. 12 (1989) 967. [43] S. Chen, B.L. Luk, Signal Process. 79 (1999) 117. [44] M. Bader, A. Puschmann, C. Ocal, J. Haase, Phys. Rev.
[45] S.R. Parkin, H.C. Zeng, M.Y. Zhou, K.A.R. Mitchell, Phys. Rev. B 41 (1990) 5432.
[46] H. Duurr, Th. Fauster, R. Schneider, Surf. Sci. 244 (1991)€
237.
[47] G. Dorenbos, M. Breeman, D.O. Boerma, Phys. Rev. B 47 (1993) 1580.
[48] W. Liu, K.C. Wong, K.A.R. Mitchell, Surf. Sci. 339 (1995) 151.
[49] E. Vlieg, A concise ROD manual, available from: www. esrf.fr/computing/scientific/joint_projects/ANA-ROD/index. html (2001).
[50] L. Pauling, The Nature of the Chemical Bond, Cornell Univ. Press, Ithaca, 1960.
[51] I.D. Brown, D. Altermatt, Acta Crystallogr. B 41 (1985) 244. [52] R.W.G. Wyckoff, in: Crystal Structures, vol. 1, Wiley, New