University of Rhode Island University of Rhode Island
DigitalCommons@URI
DigitalCommons@URI
Open Access Dissertations 2016Development and Validation of the Assessment of Racial
Development and Validation of the Assessment of Racial
Microaggressions in Academic Settings (ARMAS) Scale
Microaggressions in Academic Settings (ARMAS) Scale
Yarimar Ortiz-FronteraUniversity of Rhode Island, [email protected]
Follow this and additional works at: https://digitalcommons.uri.edu/oa_diss
Recommended Citation Recommended Citation
Ortiz-Frontera, Yarimar, "Development and Validation of the Assessment of Racial Microaggressions in Academic Settings (ARMAS) Scale" (2016). Open Access Dissertations. Paper 492.
https://digitalcommons.uri.edu/oa_diss/492
This Dissertation is brought to you for free and open access by DigitalCommons@URI. It has been accepted for inclusion in Open Access Dissertations by an authorized administrator of DigitalCommons@URI. For more information, please contact [email protected].
DEVELOPMENT AND VALIDATION OF THE ASSESSMENT OF RACIAL MICROAGGRESSIONS IN ACADEMIC SETTINGS (ARMAS) SCALE
BY
YARIMAR ORTIZ-FRONTERA
A DISSERTATION SUBMITTED IN PARTIAL FULFILLMENT OF THE REQUIREMENTS FOR THE DEGREE OF
DOCTOR OF PHILOSOPHY IN
PSYCHOLOGY
UNIVERSITY OF RHODE ISLAND 2016
DOCTOR OF PHILOSOPHY DISSERTATION OF
YARIMAR ORTIZ-FRONTERA
APPROVED:
Dissertation Committee:
Major Professor Charles E. Collyer Paul Bueno de Mesquita Annemarie Vaccaro
Nasser H. Zawia
DEAN OF THE GRADUATE SCHOOL
UNIVERSITY OF RHODE ISLAND 2016
ABSTRACT
Racial Microaggressions (RM) in academic settings can have pervasive effects on students of color, specifically in graduate programs. A national sample (N = 289) was collected from programs approved by APA in order to validate a newly developed Scale called Assessment of Racial Microaggressions in Academic Settings (ARMAS). An exploratory factor analyses was conducted which yielded eight factors: (1)
Ascription of Intelligence, (2) Assumptions of being a foreigner, (3) Multicultural issues seen as not a priority and being treated differently (4) Invisibility/Felt ignored, (5) Assumptions about me and my work with clients/representing entire race, (6) Colorblindness, (7) Assumptions of professional advantage because of race/ethnicity, and (8) Stereotypical assumptions about my race/ethnicity. Reliability along with discriminant and convergent validity was analyzed. Results of the study suggest that the ARMAS is a valid and reliable measure of RMs in academic settings.
Additional results indicate that half of the sample considered dropping-out more frequently during the first three years of their programs. Higher scores in the ARMAS were in factors that are unique of this study of RMs in academic settings (Assumptions about me and my work with clients, and Assumptions of professional advantage because of race/ethnicity). Participants’ main reasons for dropping out included: lack of support from faculty, lack of confidence, overwhelmed about academic demands and RMs. Microinvalidations was one of the top three reasons for dropping out for Black, American Indian/Alaska Native, and Multiracial graduate students. Practical implications to support graduate students of color and future directions for research are discussed.
iii
ACKNOWLEDGMENTS
I would like to express my gratitude to my major professor, Charles
Collyer. Your guidance and feedback has helped me in this endeavor. In addition, I would like to thank my committee members, Paul Bueno de Mesquita, Annemarie Vaccaro, and Kristin Johnson for their time and thoughtful feedback.
Finally, I would like to give a special thanks to my friends and family for their support. I would like to express my gratitude to my husband Rafael for his moral support and encouragement throughout this process.
iv TABLE OF CONTENTS ABSTRACT ... ii ACKNOWLEGEMENTS ... iii TABLE OF CONTENTS ... iv LIST OF TABLES ... vi
LIST OF FIGURES ... vii
CHAPTER 1: INTRODUCTION ... 1
Racial Microaggressions ... 1
Clash of Racial Realities ... 6
Racial Microaggressions in Academic Settings ... 9
Retention and Attrition of Students of Color ... 11
Campus Climate and Attrition ... 13
Measuring Racial Microaggressions ... 14
CHAPTER 2: SCALE DEVELOPMENT AND PILOT STUDY ... 18
Item Development ... 18
Expert Panel Review ... 19
Pilot Study ... 19
Method ... 20
CHAPTER 3: SCALE VALIDATION ... 25
ARMAS Scale Validation ... 25
v
Results ... 30
CHAPTER 4: RACIAL MICROAGGRESSIONS ASSESSMENT USING ARMAS ... 40
One-Way ANOVA ... 42
Using ARMAS to to assess drop-out considerations ... 44
CHAPTER 5: GENERAL DISCUSSION ... 50
APPENDIX A: Racial Microaggressions categories and themes ... 55
APPENDIX B: Demographics Questionnaire ... 56
APPENDIX C: ARMAS-71 Version One ... 58
APPENDIX D: ARMAS Scale Evaluation Open-ended Questions ... 62
APPENDIX E: Drop-out Consideration Questions ... 63
APPENDIX F: Racial and Ethnic Microaggressions Scale (REMS) with items by subscales ... 64
APPENDIX G: Buss-Perry Aggression Scale ... 66
APPENDIX H: Buss-Perry Aggression Scale Subscales ... 67
APPENDIX I: ARMAS-47 Final Version factors and items ... 68
vi
LIST OF TABLES
TABLE PAGE
Table 1. Parallel analysis with random order eigenvalues ... 33 Table 2. Factor loadings for exploratory factor analysis with Promax rotation of the ARMAS Scale ... 35 Table 3. Pearson correlations between ARMAS factors and the REMS subscales .. 39 Table 4. Summary of significant multiple comparisons between ARMAS factors and race groups ... 43 Table 5. Summary of significant multiple comparisons between ARMAS factors and race groups of participants who considered dropping out (n = 145) ... 47
vii
LIST OF FIGURES
FIGURE PAGE
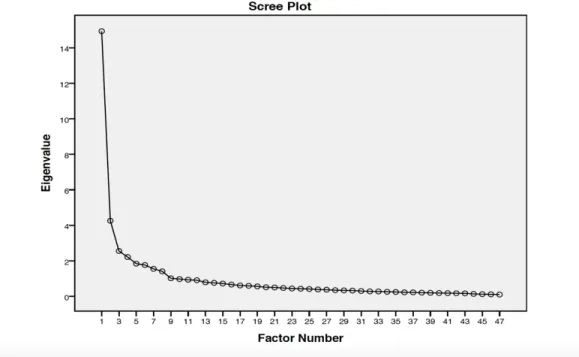
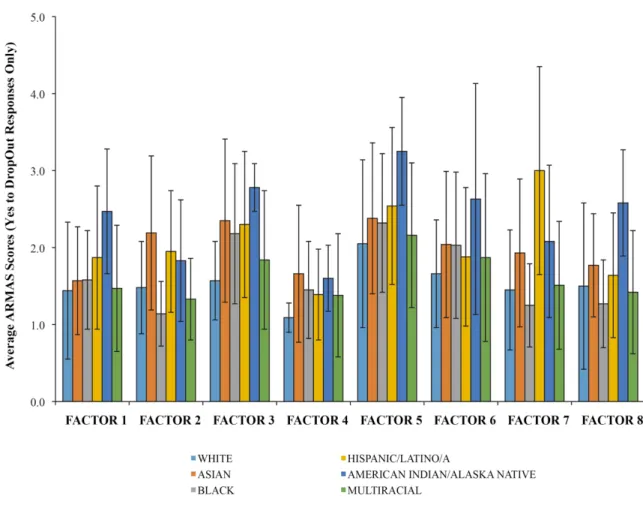
Figure 1. Scree Plot for ARMAS extracting factors between 8 and 9 ... 32 Figure 2. Average ARMAS scores of factors by race. In this analysis, data from the entire sample was utilized (N = 289). Standard errors are represented in the figure by the error bars attached to each column ... …...41 Figure 3. Average ARMAS scores (Yes to drop out responses only, n = 145) of factors by race. Standard errors are represented in the figure by the error bars attached to each column ... …...45 Figure 4. Percentage of the reasons to dropout by race groups ... …...47
1 CHAPTER 1 INTRODUCTION
Racial Microaggressions (RMs) adversely affect the mental health and academic engagement of students of color in various academic settings. Specifically, RMs include communications that consciously or unconsciously convey a derogatory message to a person of color and can adversely affect the mental health (Sue et al, 2008), self-esteem (Nadal, Griffin, Wong, Hamit, & Rasmus, 2014), and self-efficacy (Blume et al., 2012) of students of color. RMs also negatively affect the academic engagement of students of color (Clark et al. 2012). Due to their adverse impacts, RMs could depress retention and graduation rates of people of color in graduate programs in psychology, which in turn could contribute to the shortage of ethnic minority
professionals in fields such as Psychology (Ortiz-Frontera, 2013). Racial Microaggresions
Racism is a delicate topic in many social contexts. Since the Civil Rights movement, society has tried to have a more egalitarian view of races (Dovidio & Gaertner, 2000; Sue et al., 2007). As a consequence, racism in its blatant or overt form is prohibited by law, to the extent that nowadays many can argue that racism does not exist and that it is not a problem in the US. However, contemporary researchers contest that idea by presenting studies that suggest the existence of forms of modern racism that are covert and subtle (Dovidio, Gaertner, Kawakami & Hodson, 2002). Pearson, Dovidio and Gaertner (2009) developed the theory of aversive racism, which is defined as “a form of prejudice characterizing the thoughts, feelings, and behaviors
2
of the majority of well-intentioned and ostensibly non-prejudiced White Americans (p.315).”
Among these forms of racism, racial microagressions deserve special consideration. The term racial microaggressions (RMs) was first introduced by
Chester Pierce in 1978 and was defined as “subtle, stunning, often automatic, and non-verbal exchanges which are ‘put downs’” (Pierce, Carew, Pierce-Gonzalez & Willis, 1978, p. 66; as cited in Sue et al, 2007, p. 273).
Given their subtle nature, the occurrence and prevalence of RMs should be of special importance to mental health professions because of interactions with people of color who are clients and/or service providers. It is particularly important to
investigate how racial microaggressions affect the daily life of Psychologists of color who serve a diverse population in the US and those who are currently in graduate school training about to join the field.
There are several studies that have evaluated RMs on university campuses, in the counseling process, and among faculty in university environments. For example, a study conducted by Sue and colleagues (2007) discusses what racial microaggressions are as well as their clinical implications. Specifically, they analyzed the literature in social and counseling psychology and analyzed personal narratives provided by both White psychologists and psychologists of color that described examples of RMs experienced in everyday life. Following their review of the literature, the authors defined RMs as “brief and commonplace daily verbal, behavioral, and environmental indignities, whether intentional or unintentional, that communicate hostile, derogatory, or negative racial slights and insults to the target person or group (p.273).” Based on
3
their literature review, the authors classified RMs into three distinct forms: microassaults, microinsults, and microinvalidations.
Microassaults are conscious and intentional discriminatory actions
characterized by a verbal or non-verbal attack with the intention of hurting the victim. Examples of microassaults include using racial epithets, displaying White supremacist symbols (e.g. swastikas) or preventing one's son or daughter from dating outside of their race. Microinsults are verbal, nonverbal, and environmental communications that slightly convey rudeness and insensitivity aimed at demeaning a person's racial heritage or identity. An example of a microinsult is when an employee asks a co-worker of color how she got her job, implying she may have landed it through an affirmative action or quota system. Microinvalidations are communications that subtly exclude, negate, or nullify the thoughts, feelings or experiential reality of a person of color. For example, a White person asking a Latino/a where they were born,
conveying the message that they are perpetual foreigners in their own land. The collection of personal narratives helped the researchers to code the information from the narratives and classify it into nine different categories of
microaggressions with distinct themes; these are: (1) alien in own land, (2) ascription of intelligence, (3) color blindness, (4) assumptions of criminality or criminal status, (5) denial of individual racism, (6) myth of meritocracy, (7) pathologizing cultural values/communication styles, (8) second-class citizen and (9) environmental microaggressions. While this study provided a lot of the initial foundation for the study of RMs, it had some limitations. First, the study only focused on clinical implications of RMs in the context of the therapeutic relationship between a White
4
therapist and client of color. Second, it was qualitative and provided no means to characterize the effect of RMs on mental health in a quantitative fashion. The authors mentioned the importance of doing more research in this area on how
microaggressions are manifested in society and ways to eventually eliminate them. Several studies have explored how racial microaggressions are experienced by different minority groups, including African Americans (Sue et al., 2008), Latina/os (Rivera, Forquer & Rangel, 2010), Asian Americans (Sue, Bucceri, Lin, Nadal, & Torino, 2010), indigenous people (Hill, Kim, & Williams, 2010, Clark et al., 2011), and students of color (Sue, Lin, Torino, Capodilupo, & Rivera, 2009). These
researchers found that people of color experiencing different RMs in their everyday lives are subject to pervasive and negative impacts on their mental health (Nadal, 2011, Sue et al., 2008).
People of color who experience microaggressions in their everyday lives are subject to pervasive and negative impacts on their mental health (Nadal, 2011; Sue et al., 2008). Previous studies confirm that perceived discrimination by African
Americans is related to poor psychological outcomes (Clark, Anderson, Clark, & Williams, 1999). Specifically, a study by Kessler, Mickelson and Williams (1999) reported that 25% of African American participants in their study sample reported frequent day-to-day discrimination experiences. This finding suggests that African Americans dealing with discrimination experiences (such as RMs) on a daily basis are susceptible to negative influences on their psychological well-being (Torres, Driscoll, & Burrow, 2010). More recently, another study confirmed that RMs affect negatively the mental health of people of color (Nadal, Griffin, Wong, Hamit, & Rasmus, 2014a).
5
In the 2014 study Nadal and colleagues found that higher frequencies of RM events negatively predicted the mental health of participants. They also found a significant correlation between RMs and depressive symptoms and negative affect (Nadal et al., 2014a).
The literature suggests that the ambiguous and unconscious nature of RMs (sometimes for both the victim and the perpetrator) produces more pervasive effects on the psychological well-being of people of color than overt forms of discrimination (Solórzano, Ceja, & Yosso, 2000). Sue and colleagues (2007) suggest that the
accumulation of daily RMs has an adverse effect on the psychological functioning of ethnic minorities. Moreover, these experiences would add to the stresses of other, normal life demands (Torres, Driscoll, & Burrow, 2010), compounding the negative effects of RMs on the mental health of people of color. Graduate students of color who are dealing with RMs, besides the pressure and regular demands of graduate school, might be at greater risk to have mental health problems, in which RMs can act insidiously to cause such problems.
A report written by the The Graduate Assembly (2014) about the well-being of graduate students from the University of Berkeley, found that 47% of PhD students and 37% of Master’s students scored as depressed. Furthermore, in the social sciences degree programs 28% of the graduate students reported depressive symptoms (The Graduate Assembly, 2014). In general, graduate students experience a lot of stress and are susceptible to develop depressive symptoms. In addition, for graduate students of color the risk for mental health concerns is exacerbated due to not feeling welcomed and their culture not being valued (Solórzano, Ceja & Yosso, 2000; The Graduate
6
Assembly, 2014, Yosso, Smith, Ceja & Solórzano, 2009). Therefore, the frequent exposure to RMs could, in turn, affect their retention and the completion of their graduate degrees.
Self-esteem is another area in which RMs are reported to have a negative impact. A study found that RMs negatively predicts lower self-esteem in people of color (Nadal, Wong, Griffin, Davidoff, & Sriken, 2014b). In other words, the more RM experiences the participants had, the lower they reported their self-esteem. The study also found that the RMs occurring in educational and workplace environments were particularly harmful to the participant’s self-esteem.
Clash of Racial Realities
The racial realities of students of color are different from what their White counterparts experience. Studies have found that, for example, African Americans believe that racism is something they constantly have to deal with, while most White Americans tend to minimize and say that racism is a thing of the past (Sue, 2010). For example, when African Americans are asked how much discrimination still exists against them today most say “a lot”, while only 10% of Whites said “a lot”. Another study found that over 50% of Whites believe that people of color have gained equality and think that they are doing better than they really are, which is contradictory to the perceptions of people of color in areas such as employment, education, and housing opportunities (Harris Poll, 1994; as cited in Sue, 2010). Studies suggest that the gap between Black and White perceptions are astounding (Sue, 2010). Across African Americans, Asian Americans, and Latino/Hispanic Americans, there is agreement that White Americans believe they are superior, entitled to control others and insensate to
7
race issues (Harris Poll, 1994; as cited in Sue, 2010, p. 45). In regards to racial discrimination and bias, there is a big gap in the perception of its existence between Whites and people of color. Only 6% of White people have reported racial
discrimination and unfair treatment from the police versus 92% of Black people (Ranskin & Reason, 1998; as cited in Watkins, 2012). In this same line, recent incidents involving the shooting of black men by the police has provoked many protests around the country, suggesting bias against black men. When Mr. Philando Castile was stopped by an officer he informed him that he carried a permit for a firearm. When the officer asked for identification, Mr. Castile was reaching for his wallet, but the officer proceeded to shoot him three times. A recent article by the New York Times explained that the victim, Mr. Castile, was disproportionally stopped by the police for minor traffic infractions, a total of 49 times in 13 years, about once every three months (LaFraniere & Smith, 2016). The article mentioned that a study found that “African Americans and Native Americans in Minneapolis were eight times more likely than Whites to be charged with a low-level infraction” (LaFraniere & Smith, 2016). Due to the subtleness and ambiguity of RMs, there is a conflict about their actual existence. When there is discussion about RMs the perpetrator, imposing his racial reality, oftentimes invalidates the experiences of people of color (Watkins, 2012).
Although research suggests that the perceptions of people of color about race issues are different, there are some notable criticisms against RMs. For example, Thomas, (2008) argued that RMs are portraying minorities as weak and overly sensitive, and that analysis of situations in terms of RM is one-sided in blaming the
8
perpetrators. Thomas, (2008) suggested an “interpersonal complementarity” process where both parties could discuss and contribute to the outcome. Moreover, he refers to RMs as nonsense not worthy of the hand-wringing reactions that people of color are having (Sue, 2010). Additionally, he criticizes RMs by stating that everyone
experiences verbal, behavioral or environmental indignities regardless of their race. Even though all groups experience insult and slights in their lives, it is important to note that equating the experience of a political conservative with the experiences of racism is wrong (Sue, 2010). Thomas is imposing the race reality of White
Americans, who historically have had more power, on those who have less power and have been marginalized. These realities are completely different with respect to choice. Whereas everyone can choose their political affiliation and decide or not to expose themselves to being offended, people of color cannot escape their realities; they are born with them and cannot change the color of their skin to avoid these experiences. In general, the perception by others of RMs as doing minimal harm is something people of color face frequently when deciding to discuss it (Sue, 2010). Even though RMs vary in severity, and some may seem innocent, each one
nevertheless contributes to the accumulation of racial indignities that can cause harm to people of color (Sue, 2010).
Another area where there is gap in perception in an academic interaction is between the faculty advisor and the graduate student of color. A qualitative study found that there was a difference in perceptions of professional advantage because of the race or ethnicity of the student. The study analyzed race as currency, which “referred to the social value placed on one’s race,” whether it was a benefit or a
9
disadvantage (Barker, 2011, p. 393). In this case, the faculty advisors, who identified as White Europeans, viewed their students’ race mostly as an advantage. However, some advisors expressed concerns for their students that in their future jobs they might not be taken seriously because of assumptions that they got the job because of their race. Conversely, graduate students of color (African American) perceived their race as only a liability and not a benefit for their future academic careers (Barker, 2011). In other words, students of color felt that they constantly have to prove themselves in their academic careers more than does a student from the majority race. The perceptions of the majority race faculty and peers on this issue are dramatically different and sometimes invalidating.
Racial Microaggressions in Academic Settings
A study of RMs in academic settings found that African American participants experienced different forms of RM in the classroom and other social spaces, inflicted by White peers, faculty and members of the administration and staff of their campus (Watkins et al., 2010; as cited in Nadal, Wong, Griffin, Davidoff, & Sriken, 2014). Similar findings were found in the study of RMs in school psychology, where RMs were experienced by graduate students of color in classrooms, field and practicum settings, and social events sponsored by the department/university; perpetrators were White peers and faculty in the classroom, mainly staff and supervisor in field and practicum settings, and mainly White peers in social events (Ortiz-Frontera, Vaccaro, & Collyer, 2014).
Frequent RMs in academic settings contribute to the perception of an unwelcoming and hostile campus climate. Many students of color have reported
10
feeling invisible, due to their experiences as African Americans being omitted, distorted and stereotyped in their classes (Solórzano, Ceja, & Yosso, & 2000, p. 65). The African American participants in the study also felt that faculty maintained low expectations of them, and that regular negative interactions have made them doubt their own abilities and intelligence. Participants also felt isolated, especially when others did not consider them to be part of study groups. The effects of dealing with all these RM experiences left them feeling drained and mentally exhausted because they have had to constantly prove themselves in the academic setting. The study also found that in social spaces within and around the campus, participants experienced more overt racism, rather than more covert and subtle forms of racism in academic settings (Solórzano, Ceja, & Yosso, & 2000). Thus, frequent experiences with RMs of students of color could produce negative perceptions of the campus racial climate. The effects of RMs in students of color are deleterious, affecting their mental health, self, esteem, and interfering with their academic performance.
RMs also affect the academic engagement and sense of belonging of students of color (Clark, Mercer, Zeigler-Hill, & Dufrene, 2012). In one study, Clark and colleagues (2012) evaluated the factors that could be barriers to the success of ethnic minority graduate students in the field of School Psychology. Specifically, these researchers assessed academic achievement and social and emotional experiences (belongingness and emotional distress). They found that ethnic minority students experienced a higher level of emotional distress, a lower level of belongingness and more negative race-related experiences with lower perception of belongingness (Clark et al., 2012). Therefore, if students feel that professors and peers do not socially
11
support them, RMs could negatively affect their psychological adjustment.
Furthermore, these negative consequences could hinder the necessary efforts aimed at promoting academic achievement and, consequently, retention within the graduate program/university (Clark et al., 2012; Solórzano et al., 2007).
Retention and Attrition of Students of Color
The US is becoming more diverse and there is a need for more psychologists and other mental health professionals of color to represent this growing diversity. According to the American Psychological Association (APA) Office of Ethnic Minority Affairs report on the status of ethnic minority persons in psychology fields, there is a shortage of psychologists from ethnic minority backgrounds at all levels of education and in the field generally (APA, 2008). For instance, in 2004, only 5.8% of regular members in APA were from ethnic minority backgrounds. In the same year, there were 27.2% ethnic minority students in APA approved Masters programs. Meanwhile, doctoral ethnic minority students comprised 20.1% of students in APA programs. This contrast between APA student and regular memberships could suggest that ethnic minority graduate students are either leaving graduate programs or that some of them might not necessarily choose to join the field following graduation. Also, there is a notable decline in the participation of ethnic minorities in postdoctoral fellowships that might signal a decline in the number of future ethnic minority
psychology faculty and researchers (APA, 2008). Therefore, there are fewer ethnic minorities in doctoral programs, postdoctoral programs, and faculty/research positions. Consequently, this difference could suggest that there is a problem with retention of graduate students of ethnic minority backgrounds in psychology. The higher
12
percentages of ethnic minority students in graduate programs may also predict a higher percentage of regular APA members in the future (APA, 2008). Although, a greater recruitment does not necessarily mean a substantive increase of ethnic minorities completing their degrees (Griffin, Muniz, & Smith, 2016). On the other hand, even 25 or 30% people of color representation in psychology may quickly fall short of the corresponding percentage in the general population.
While it is important to continue the efforts of increasing recruitment of ethnic minorities in graduate programs, there is a great need to also promote equity in their education outcomes and the quality of their experiences, as well as their retention (Griffin, Muniz, & Smith, 2016). For this reason, it is critical to increase and retain graduate students of color in psychology and other mental health fields who could better serve the evolving population of children in the schools and clients generally.
Generally, graduate student retention is problematic, especially in doctoral programs with only 57% of students completing their degree across disciplines (Council of Graduate Schools, 2008). The report by the Council of Graduate School (2008) showed that the rate of completion of doctoral programs in social sciences is 56%. More specifically, the same report found that in psychology doctoral programs only 65% of students complete their degree. Thus, 35% of students who enter a doctoral program did not attain the degree. The main reasons for dropping included student-program mismatch, program difficulty, absence of financial support, and lack of community support within departments and campuses (Wojcik, 2012).
Unfortunately, there was no specific data from APA available to me that depicts the number of students of color who might have dropped down to a master’s degree or
13
decide to leave their graduate programs altogether. However, The Council of Graduate Schools (2008) found that within the area of social sciences, the lowest rate of doctoral degree completion was among Asian students (44%), followed by African American students (47%), Hispanic students (55%) and White students (57%). At a glance, the numbers suggest that all racial groups complete their degree at comparable rates, however, it is important to reiterate that the rate of recruitment is much less for
students of color. Another study by Maton, Kohout, Wicherski, Leary, and Vinokurov (2006) found no growth in the percentage of PhD degrees received by students of color since 1999, and that the growth of African American and Hispanic/Latino(a) students showed little to no growth since 1997. Similarly, they found that faculty of color in psychology is low and this trend has not changed considerably (Maton et al., 2006). Thus, the recruitment of graduate students of color has not changed much in almost 20 years, and these students also are more likely to leave their programs than their counterparts (Rogers & Molina, 2006).
Campus Climate and Attrition
Racial and ethnic minority students are at greater risk for attrition due to higher negative experiences with departmental integration and socialization, access to
financial resources, interactions with faculty, and racial climate, among other variables (Griffin, Muniz, & Smith, 2016). A constant variable in the study of persistence and attrition of students of color is the campus racial climate, particularly in predominantly white institutions (PWI). Students of color have reported feelings or perceptions of discrimination, stereotypes, and prejudice on campus, including beliefs about how the
14
PWI addresses racial diversity issues on campus (Hurtado, Milem, Clayton-Pedersen, & Allen, 1999; as cited in Johnson, Wasserman, Yildirim, & Yonai, 2014).
Consistently, research has found during 20 years that students of color perceive campus climate more negatively than do White students, suggesting that indeed, students of color have negative race-related experiences in PWI (Harper & Hurtado, 2007; as cited in Johnson et al., 2014). In turn, these negative race-related experiences, including RMs, affect psychological processes and persistence in their degree
programs (Johnson et al., 2014). In other words, the decision to stay in a program is negatively affected by the hostile campus climate. Additionally, a study by Wei, Ku, & Liao (2011) and Johnson et al., (2014) reported that for students of color at PWIs a unique form of stress that they experience with more frequency was race-related stress in their academic environment, which had negative effects on their degree persistence decisions. Thus, if a campus climate is supportive and positive towards students of color it can lead to better student outcomes and persistence. In contrast, a negative campus climate towards students of color may be associated with poor academic performance and high dropout rates, particularly among African Americans students (Solórzano, Ceja, & Yosso, 2000). For this reason, it is important to pay attention to the racial campus climate and take steps to monitor the frequency of RMs and create interventions.
Measuring Racial Microaggressions
The majority of the research examining the occurrence and prevalence of RMs is qualitative, given that RMs are a relatively recent topic of study. Recently, there has been a move for more quantitative studies, mostly in the field of scale development, to
15
measure RMs. Currently, there are three scales published in peer-reviewed journals. The first published scale was the Inventory of Microaggressions against Black
Individuals (IMABI) (Mercer, Zeigler-Hill, Wallace, & Hayes, 2011). The IMABI was developed and validated using a university sample, where Black or African American undergraduate students answered a 14-item scale capturing both microinsults and microinvalidations, but highly focused on the latter (Mercer et al., 2011). The measure was associated with general distress and perceived stress and had good reliability (r = .79).and validity. Another measure that was developed shortly after by Nadal (2011) is the Racial and Ethnic Microaggression Scale (REMS). In the
development and validation of the REMS, Nadal (2011) used a community and university sample representing several racial groups. The REMS reports having an overall Cronbach’s alpha of .91 and subscales ranging from .78 to .87. The validity of the REMS was assessed by analyzing correlations with scales that measure modern racism such as the Racism and Life Experiences-Self-Administration Version (RaLES-S; Utsey, 1998, as cited in Nadal, 2011). The high correlations obtained suggest that the REMS is a valid measure of racial microaggressions. Similarly, Torres-Harding and colleagues (2012) developed and validated a measure of RMs called the Racial Microaggressions Scale (RMAS) using a community and university sample including several racial groups. The scale had a very good internal consistency with an overall Cronbach’s alpha of .945 for all of the 52-items. The RMAS is a reliable and valid measure of RM in people of color.
The scales described above appear to have good reliability and validity to measure RMs for both general community sample and college samples. However, to
16
the best of my knowledge, there is no RM scale that measures the occurrence or prevalence of microaggressions in academic settings and addressing academic-related activities for students of color, particularly in psychology. The literature has found that the most frequent setting where people of color experienced more RM was in the school setting or the workplace (Nadal et al., 2014a). Thus, a special focus should be provided and for that reason a specific measure of RM in the school setting and workplace is needed. The lack of such a scale is a major limitation to academic
achievement efforts since RMs could pose a serious menace to retention and academic success. For that reason, the purpose of this study is to develop and validate a scale measuring RM experienced by graduate students of color in psychology and other related fields that have a required practicum or field component. The present study will extend prior work by the author on RMs by developing and testing a quantitative measure to assess the themes found in previous research (Ortiz-Frontera, 2013, see Appendix 1). Most importantly, the goal of developing this scale is to assist university programs or departments in psychology and related fields in assessing the types of RMs and settings where RMs may occur, and consequently begin prevention and intervention efforts. In order to obtain a clear description of the problem, there is a need for a measurement tool that assesses the specific and unique RM experiences among graduate students of color in academic settings. The results of this study provides valuable information that could assist in the creation of interventions tailored by race to support graduate students through the completion of their graduate degrees. The new scale, ARMAS, can be utilized by departments to monitor RMs across time and evaluate progress or problems in the racial climate.
17
For the current study, the following research questions have been developed: (1) What are the psychometric properties of the newly developed measure ARMAS? And, (2) are RM experiences a factor in graduate student consideration of leaving their graduate programs?
18 CHAPTER 2
SCALE DEVELOPMENT AND PILOT STUDY Scale Development
The purpose of this stage of the study was to develop items that would create the Assessment of Racial Microaggressions in Academic Settings (ARMAS) scale. The following discussion provides a description of the item creation process, including a discussion of the previous study the author conducted where written responses of students of color in psychology were utilized to assist in creation of items for the ARMAS scale (Ortiz-Frontera, 2015). In addition, the process of an expert review of the items, and a small pilot study are described.
Item Development
The instrument development process started with an in-depth review of the construct and the content of the scale based on theory. In this case, the studies have been based on the RM theory proposed by Sue and colleagues in 2007 (Sue et al., 2007). Having a clear understanding of the theory is important to achieve the clarity the scale warrants (DeVellis, 2012).
A previous study conducted by the author investigated whether graduate students of color in school psychology programs around the US experienced RMs, and if so, how they coped with these experiences (Ortiz-Frontera, 2013). Part of the study included open-ended questions where participants described their RM experiences on three different settings: classrooms, practicum/field experiences and in social events sponsored by programs (Ortiz-Frontera, Vaccaro & Collyer, 2015). Next, the open-ended questions also asked participants to describe the ways they coped with their RM
19
experiences in the specified settings. Then, participants’ responses were qualitatively coded into themes based on Sue’s RM theory (Ortiz-Frontera, 2015). The specific responses and the themes that arose from this data assisted in the creation of 47 items for the ARMAS. The initial items were then reviewed by an expert panel to assess item quality, face validity and content validity.
Expert Panel Review
The expert panel consisted of faculty who are the committee members of the author. The expert panel included three faculty members. One was a female professor and researcher, an expert on human development and multicultural issues on college campuses. She has studied RM and is very knowledgeable of the theory proposed by Sue and colleagues (Sue, 2007). Another was a male professor with research expertise on peace and nonviolence and social psychology. The third member was a male professor expert on nonviolence training and school psychology. The panel reviewed all items of the ARMAS to assess item quality, face validity and content validity. After receiving panel feedback related to the need for more items, 25 more items were added. Also, the existing items were clarified and modified. This process happened again to review the new items. Based on the final feedback, a total of 72 items were created.
Pilot Study
A small pilot study (N = 17) was conducted in order to have a better idea of how the newly developed measure would fare with a sample from local state graduate programs in Psychology and Social Work. The purpose of this pilot study was to assess the items’ wording and clarity, decide upon scale length, and delete weak items.
20
Also, the pilot study provided feedback on the format of the Likert categories. Even though six items were deleted at first, with changes in phrasing the researcher decided to keep three of those items. Then, two more items were added based on the feedback provided by participants and consistent with themes based on theory. This resulted in 71 items on the ARMAS for the validation phase. More details about the
characteristics of the sample are provided below. Method Participants
The sample of the pilot study consisted of N = 17 participants (NMales = 1, 6% and NFemales = 16, 94%), all from local graduate programs. The participants’ ages fell into the following age ranges: 22-25 (41%), 26-30 (41%), and 31-35 (17.6%). The sample included graduate students of color (n = 12, 70.6%), and international graduate students as well (n = 3, 17.6%). In the study, the percentage of participants by race is as follows: Hispanic or Latino/a (n = 7, 41.2 %), Black (n = 5, 29.4%), White (n = 3, 17.6%), Asian (n = 1, 5.9%), and Multiracial (n = 1, 5.9%).
The majority of the participants spoke English as their first language (n = 14, 82.4%). The three remaining participants spoke another language as their primary tongue; these included Icelandic (n = 1, 5.9%), Turkish (n = 1, 5.9%) and Spanish (n = 1, 5.9%). The highest degree completed from participants was a Master’s degree (n = 10, 58.8%), followed by Bachelor’s degree (n = 7, 41.2%). Most of the pilot study participants were enrolled in a Doctoral program (n = 12, 70.6%), followed by a Master’s program (n = 5, 29.4%). Participants were mostly in the first (n = 6, 35.3%)
21
and fourth year (n = 5, 29.4%) of their programs; the remaining participants were in second and fifth year, each representing 17.6% of the sample.
The number of faculty of color in the participants’ programs ranged from zero to “four or more.” The largest group (47.1%) reported that in their program there were no faculty of color; 23.5% reported two faculty of color; and 17% reported one. Only one participant reported having four or more faculty of color in their graduate
program. Similarly, students reported the number of graduate students enrolled in their programs. The majority of participants (64.7%) reported having between four and six graduate students of color in their programs, followed by 17.6% each reporting having from seven to nine or 10 or more graduate students of color in their programs.
Measures
The pilot study measures consisted of a packet of questionnaires including a consent form, the newly developed ARMAS, open-ended questions evaluating ARMAS, questions about considering dropping out of the graduate program, a demographic questionnaire and three additional measures to assess validity. The measures to assess validity are the Racial and Ethnic Microaggressions Scale (REMS), and The Buss-Perry Aggression Scale. More information about these scales will be provided below.
Demographic Questionnaire. A demographic questionnaire was provided to the participants to identify their sex, age, race, ethnicity, level of education, program in psychology or related field (specialist, masters or doctoral level), year in
22
ARMAS Scale. The newly developed scale containing 71 items was administered to the pilot study sample. The pilot study version of the ARMAS can be found in
Appendix C. The responses were on a Likert scale of six points. The Likert responses were meant to indicate the number of times RM occurred in the past year. These are the six Likert points, 0 = I did not experience this event in the past year, 1 = I experienced this event 1 time in the past year, 2 = I experienced this event 2 times in the past year, 3 = I experienced this event 3 times in the past year, 4 = I experienced this event 4 times in the past year, and 5 = I experienced this event 5 or more times in the past year.
ARMAS Scale Evaluation Open-ended Questions. The package will include
three open-ended questions with the purpose of evaluating the scale (Appendix D). The questions were adapted from Nadal (2011), and are the following: “(1) Please describe what you believe these questions were trying to measure, (2) Please write three keywords or key phrases that can be used to label the various experiences that are described above., and (3) Do you remember any questions or experiences that were not written in a clear or concise manner? If so, please list them.” (adapted from Nadal, 2011).
Consideration of Dropping Out. The questions on this section asked participants if they have ever considered dropping out of their graduate programs, in what year of the program they considered it, and possible reasons for considering dropping out. The open ended questions asked participants to describe instances where they had considered leaving their graduate program and how they coped with
23
these thoughts, in addition to including what made them stay in their programs. (See Appendix E).
Racial and Ethnic Microaggressions Scale (REMS). This scale, developed by Nadal (2011), is a 45-item scale that uses dichotomous answers (1 and 0). The REMS was included in the package for the purpose of evaluating convergent validity with the new developed scale ARMAS. For this study, only five of the six subscales were tested, yielding a 38-item version of REMS (See Appendix F).
The Aggression Questionnaire. The scale was developed by Buss and Perry (1992). The Aggression Questionnaire has 29-items that were included in the measure package for the purpose of evaluating discriminant validity with the new scale
ARMAS. The Buss-Perry Aggression questionnaire and its subscales can be found in Appendices G and H.
Procedure
The development of the items of the new scale ARMAS was based on the theory and taxonomy proposed by Sue and colleagues (2007), as well as the findings from Ortiz-Frontera, Vaccaro & Collyer (2015) (See Appendix A). To develop the ARMAS scale, the author created items from each category or theme found in her 2015 study. A committee member reviewed the items and approved final copy for IRB review and then pilot study. An invitation to participate in the pilot study was sent to the psychology and social work graduate programs in Rhode Island via email asking participants to access the survey through Survey Monkey. The data collection spanned six weeks (January to mid-February 2016) with most participation during the last week of January and first two weeks of February coinciding with the beginning of
24
spring semesters in most programs. Participation criteria included: (a) Participants must be graduate students in Psychology or Mental Health related fields with a practicum component, (b) from a racial/ethnic minority background, and (c) at least have completed two months of graduate school work. Next, participants filled out the survey ARMAS along with the other measures in the packet to assess validity and reliability.
25 CHAPTER 3
ARMAS SCALE INITIAL VALIDATION
The purpose of this study was to validate an instrument that would measure RM experiences of graduate students of color and international students in academic settings in a systematic way. An Exploratory Factor Analysis (EFA) was conducted to determine the underlying factor structure, as well as initial psychometric properties of the ARMAS scale. The psychometric properties were analyzed by conducting
reliability and validity analyses. Based on the theory and previous studies, I hypothesized that the scale would have a multidimensional structure.
Method Participants
For this validation study, a national sample was utilized and consisted of N = 289 participants (NMales = 38, 13.2% and NFemales = 248, 86.4%). This sample
represented about 4% of the total population of graduate students of color (N = 7, 108) in psychology (APA, 2004). The participants’ ages were represented in the following age ranges: 18-21 (1%), 22-25 (33.7%), 26-30 (45.1%), followed by the 31-35 age range (11.4%) and 36 or older (8.7%). There were participants who identified as transgender or questioning (3.8%). The sample included international graduate
students as well (n = 32, 11%). In the study, the proportion of participants by race is as follows: Blacks (n = 84, 29.2%), Hispanic or Latino/a (n = 59, 21%), Asian (n = 53, 18.4%), Multiracial (n = 43, 15%), White (n = 37, 13%), and American Indian or Alaska Native (n = 7, 2.4%), additionally there were one percentage of not identified race. The participants who identified as White were mostly White Americans from
26
European ascendency or ethnicity (n =31), international students from Morocco and North African ethnicities respectively (n = 2), Middle Eastern/Arab Americans (n = 2), Serbian/Yugoslavian American (n = 1), and one Filipino American (n = 1).
Few participants decided not to disclose their race (n = 5, 1.7%). In the validation sample, the majority of participants spoke only English (n = 147, 62%). Only 43.1% reported speaking a language other than English as their primary language.
The sample also had participants of color who graduated from their programs less than a year previously (n = 14, 5%). In the sample, there were also first generation graduate students (n = 111, 39%). The highest degrees attained in the sample were a master’s degree (n = 150, 52%), a bachelor’s degree (n = 128, 44.4%), or a doctorate (n = 8, 2.8%). The majority of the participants were from doctoral programs (n = 194, 67.4%), master’s programs (n = 84, 29.2%), and specialist level programs (n = 10, 4%).The sample had graduate students represented across different years in their program; first year (n = 84, 30%), second year (n = 68, 24.2%), third year (n = 39, 44.4%), fourth year (n = 36, 12.8%), fifth year (n = 46, 16.4%), and in sixth year or more (n = 16, 6%). The participants in this sample reported the number of faculty of color in their programs as follows; zero (n = 58, 20.1%), one (n = 55, 19%), two (n = 53, 18.3%), three (n = 38, 13%), 4 or more (n = 60, 21%), not sure (n = 20, 7%). They also reported the approximate number of graduate students of color in their programs; these include: zero (n = 3, 1%), one to three students (n = 56, 19.4%), four to six (n = 83, 29%), seven to nine (n = 46, 16%), 10 or more students of color (n = 80, 28%), and 25 participants or about 9% of the sample were not sure the number of graduate
27
students of color enrolled in their programs. The majority of participants reported that their program was located in an urban area (n = 210, 80%), followed by a rural area (n = 49, 17%), and suburban (n = 29, 10%).
Measures
Similarly to the pilot study, the measures used in this study consisted of a packet of questionnaires including a consent form, the newly developed ARMAS (after pilot revisions), open-ended questions evaluating ARMAS, questions asking participants whether they had considered dropping out of their graduate programs, a demographic questionnaire and two additional measures to assess validity. The two measures to assess validity were the Racial and Ethnic Microaggressions Scale (REMS), and The Buss-Perry Aggression Scale. More information about these scales will be provided below.
Demographic Questionnaire. A demographic questionnaire was provided to the participants to identify their sex, age, race, ethnicity, level of education, program in psychology or related field (specialist, masters or doctoral level), year in
psychology program, number of faculty and students of color in their program and the region where their program is located in the US.
ARMAS Scale. After the pilot revisions, the updated ARMAS scale containing 71 items, as shown in Appendix C, was administered to the new sample. For this study, the Likert scale changed to a five-point response format. For this study, participants indicated the frequency of RM experiences in the past year in the participant’s graduate program and/or practicum settings. These are the response options: 1= I never experienced this event in the past year, 2 = I rarely experienced
28
this event in the past year, 3 = I sometimes experienced this event in the past year, 4 = I often experienced this event in the past year, and 5 = I always experienced this event in the past year.
ARMAS Scale Evaluation Open-ended Questions. The study also included
three open-ended questions with the purpose of evaluating the scale. The questions were adapted from Nadal (2011), and are the following: “(1) Describe what you believe these questions were trying to measure, (2) Write three keywords or key phrases that can be used to label the various experiences that are described above, and (3) Do you remember any questions or experiences that were not written in a clear or concise manner? If so, please list them.” (adapted from Nadal, 2011).
Consideration of Dropping Out. The second part of the study aimed to investigate whether students experiencing RM have also considered dropping out of their graduate programs at some point in their graduate careers. Additionally, they were asked in what year in their graduate career they considered leaving their programs and the reasons. Closed and open-ended questions were used in this assessment, (Appendix E).
Racial and Ethnic Microaggressions Scale (REMS). The scale developed by
Nadal (2011) is a 45-item scale that uses dichotomous answers (1 and 0). For the purpose of this study, only five of the six subscales were tested. The Environmental Microaggressions Subscale within REMS was eliminated because the items were not applicable for RM in academic settings. The REMS was administered for the purpose of evaluating convergent validity with the new ARMAS scale.
29
The Aggression Questionnaire. The scale was developed by Buss and Perry (1992). The Aggression Questionnaire has 29-items and was administered to
participants in order to evaluate discriminant validity with the new scale ARMAS. Procedure
Similar to the pilot study, an invitation to participate in the validation study was sent to the psychology and social work graduate programs around the US. As a guide, the list of graduate psychology programs approved by the American
Psychological Association (APA) was used for all states. The email was addressed to program directors and faculty for them to distribute on their students’ email lists. Next, students who met the criteria for participation accessed a link to the survey via Survey Monkey. The participation criteria included: (a) Participants must be graduate students in Psychology or Mental Health related fields with a practicum component, (b) from a racial/ethnic minority background, and (c) have completed at least two months of graduate school. The email invitation can be found in Appendix B. The letter of consent was the first document, reminding students that participation is voluntary along with a description of potential risks and benefits of participating in the study. Then, participants filled out the ARMAS survey along with the other measures in the packet to assess validity and reliability, and the consideration of dropping out
questions. At the end of the survey, participants were given the option to participate in a raffle of four gift cards of $25.00 from www.Amazon.com as an incentive. The data collection time for the validation study was open for first three weeks during the month of March 2016. The collection of data was closed on March 24th.
30 Results
After the collection process, the data were downloaded from Survey Monkey and exported into the statistical analysis program SPSS Version 22. Descriptive statistics, exploratory factor analysis, Cronbach alpha reliability and Pearson correlations for validity assessment were performed. Primary interest was in the psychometric properties of the newly developed measure ARMAS.
Before the analyses, the data was cleaned, deleting participants with missing values. The missing values were attributed to those who only answered the
demographic questionnaire, or had an incomplete ARMAS. Based on these
characteristics, 25 entries were deleted. There were other missing values, most notably toward the end of the surveys, usually in the last assessment about aggression. The completion time of the packet of surveys was approximately 20-25 minutes. Exploratory Factor Analysis
The internal structure of a new scale is usually examined by conducting an exploratory factor analysis (EFA). This EFA helps the investigator to determine the number of latent variables on a set of items, explain the variability between the items that will later create factors, and assist in defining the meaning of the factors that are accounting for the variation in the new instrument (DeVellis, 2012).
First, to evaluate whether the data was suitable for a factor analysis the sample size had to be considered. It is noted that there is a lack of agreement in the literature regarding the right sample size (Williams, Brown & Onsman, 2010). However, studies have found that in the majority of cases, using a sample size of 150 participants should be adequate to assess EFA accurately (Guadagnoli & Velicer, 1988; as cited in Hinkin,
31
1995). The ARMAS scale had N = 289 observations, so the sample size is deemed suitable for factor analysis.
Before running the EFA, two tests were done to evaluate the suitability of the data for factor analysis (Williams, Brown & Onsman, 2010). These tests were the Kaiser-Meyer-Olkin (KMO), a measure of sampling adequacy, and the Bartlett’s Test of Sphericity (Williams, Brown & Onsman, 2010). The KMO index of 0.50 or larger is considered suitable for factor analysis (Williams, Brown & Onsman, 2010). For this study, the KMO had an index of 0.90, suggesting that the sample in this study is adequate for factor analysis. Moreover, it indicates that the extracted variables will account for a substantial amount of the variance. Then, the Barlett’s Test of Sphericity was significant (p < .0001), indicating suitability for factor analysis.
Next, the EFA was run specifying the extraction methods as Principal axis factoring (PAF). In addition, since the factors are correlated it was determined that Oblique rotation was an appropriate method, specifically Promax rotation (Furr & Bacharach, 2008). Choosing a rotation assists by providing a way of presenting the results in a manner that is easier to interpret (Williams, Brown & Onsman, 2010). This extraction method was chosen because Principal components analysis (PCA) is
usually recommended when no priori theory exists, and this validation study is based on the RM theory proposed by Sue and colleagues (2007).
Furthermore, the criteria utilized for factor extraction were based on Thompson and Daniel (1988), where multiple decisions or criteria were reviewed to reach a decision on the number of factors to extract. The first criterion that was analyzed was the eigenvalues that were greater than one. Based on this criteria, the ARMAS had 16
32
factors, (See Appendix J). Secondly, the Scree Test plot was analyzed (Tabachnick & Fidell, 1989). The Scree Test consists of identifying the point the slope starts to become flat (Furr & Bacharach, 2008). This test is subjective and it requires the researcher’s judgment. In this case, it was determined that the slope became flatter between factors eight and nine (see Figure 1). However, another extraction technique was used called Parallel Analysis (PA) to confirm the number of factors. This
technique is described as more thorough and one of the best methods for deciding amount of factors for extraction, although underused because of its limited availability on popular statistical programs (Williams, Brown, & Onsman, 2010). In PA,
sometimes called the Monte Carlo PA, the eigenvalues are tested and compared with other random order eigenvalues until the factors that are kept are those that are greater than the random ordered eigenvalues (Williams, Brown, & Onsman, 2010). Since SPSS did not have the automatic command, an online script with the code for PA was used to run it on SPSS (O'Connor, 2000). Results suggests that there is 95%
confidence that the eigenvalues extracted will be not due to chance; see Table 1 below. Based on this PA procedure, nine factors would qualify. However, the factor nine difference was very small and a decision to keep eight factors was confirmed. The final ARMAS-47 factor structure is shown in Table 2.
33
The PA determined with confidence that for the ARMAS eight factors will be extracted explaining 65% of the variance. In addition, to survive item deletion the items needed to have a loading of .40 or higher on one factor (Furr & Bacharach, 2008). Based on this criterion, 24 items were deleted. The process of item deletion was done deleting one item at a time to see carefully how deleting one affected the other items. After this process of item deletion, the final ARMAS consisted of 47 items (see Appendix I).
Table 1. Parallel Analysis with random order eigenvalues Factor
number
Actual Eigenvalue from EFA
Random order from PA Decision
1 21.618 1.6635 Accept 2 4.574 1.4410 Accept 3 2. 633 1.4336 Accept 4 2.380 1.3513 Accept 5 2.048 1.2886 Accept 6 1.775 1.2257 Accept 7 1.599 1.1679 Accept 8 1.339 1.1169 Accept
34
9 1.136 1.0686 Reject
10 1.003 1.021 Reject
Factor naming
It was found that the ARMAS had a multidimensional structure with eight factors (see Appendix I. Higher scores on any of these factors suggest that the participant is having higher frequency of RMs related to a specific area. The first factor is called Ascription of intelligence and consisted of nine items accounting for 32% of the total variance. The items described experiences where perpetrators were surprised by participants’ capabilities and/or their intelligence was questioned. Factor two, or Assumption of being a foreigner, consisted of nine items as well, accounting for 9% of the variance. The items were related to the assumption that an ethnic minority must be a foreigner, or an alien in own land issue. The third factor was called Multicultural issues seen as not a priority and being treated differently, which had eight items accounting for 5.4% of the variance. The items in factor three described instances where the multicultural issues were seen as a waste of time and other items related to being treated differently by faculty because of race/ethnicity. Factor four was named Invisibility/Felt ignored, with five items accounting for 4.7% of the variance in the sample. The items in factor four describe the experiences of participants’ feeling invisible and ignored in their programs, by being the last one picked to do something or not being invited to a study group or social event. Next, factor five is called Assumptions about me and my work with clients and representing entire race, which consisted of six items and accounting for 3.9% of the variance. The items described experiences of being constantly
assigned cases with clients from ethnic minority backgrounds, and/or being asked to provide examples or opinions about your race/ethnic group in a discussion. Then,
35
Factor six is called Colorblindness, which consisted of four items that accounted for 3.7% of the variance. The items in this factor describe experiences where perpetrators negate or nullify the fact of a person’s race and ethnicity by telling people of color that they do not see race or color. Factor seven was named Assumptions of professional advantage because of race/ethnicity, and had three items that accounted for 3.3% of the variance. These items describe comments and assumptions related to having an advantage when looking for jobs in psychology or mental health fields because of race and ethnicity characteristics, not because they are qualified as well. The eighth and last factor extracted is called Stereotypical assumptions about my race/ethnicity, with three items; it accounted for 2.9% of the variance in the sample. The items describe
experiences related to stereotypical assumptions about food, cultural dances, and religion.
Table 2
Factor Loadings for Exploratory Factor Analysis with Promax Rotation of the ARMAS Scale Factors Items 1 2 3 4 5 6 7 8 1 0.964 2 0.873 3 0.794 4 0.719 5 0.676 6 0.658 7 0.575 8 0.554 9 0.454 10 0.922 11 0.837 12 0.714 13 0.668 14 0.647 15 0.571 16 0.552
36 17 0.551 18 0.543 19 0.814 20 0.772 21 0.695 22 0.667 23 0.52 24 0.505 25 0.503 26 0.477 27 0.867 28 0.708 29 0.656 30 0.639 31 0.595 32 0.716 33 0.692 34 0.651 35 0.59 36 0.52 37 0.505 38 0.801 39 0.792 40 0.621 41 0.553 42 0.866 43 0.84 44 0.608 45 0.682 46 0.652 47 0.527
Note. Extraction Method used was Principal Axis Factoring and the Rotation method chosen was Promax.
Reliability
The Cronbach’s alpha reliability coefficients or internal consistency were analyzed for the ARMAS-47 and its factors. The reliability coefficient for all items on the ARMAS was (α = .95), a strong level of reliability as internal consistency. The reliability coefficients for the factors were as follows: Ascription of Intelligence (α =
37
.92), Assumptions of being a foreigner (α = .90), Multicultural issues seen as not a priority and being treated differently (α = .89), Invisibility/Felt ignored (α = .86),
Assumptions about me and my work with clients/representing entire race (α = .82),
Colorblindness (α = .86), Assumptions of professional advantage because of
race/ethnicity (α = .84), and Stereotypical assumptions about my race/ethnicity (α = .70). Each of these Cronbach’s alpha coefficients demonstrates acceptable to strong reliability of the factors/subscale scores.
Convergent Validity
The Racial and Ethnic Microaggressions Scale (REMS) (Nadal, 2011) was utilized to assess convergent validity. It was hypothesized that the REMS would be positively related to the ARMAS-47. The results suggest that the ARMAS factors were significantly and positively related to the REMS subscales in all correlations between their factors ranging from (r = .187 to r = .66, p < .001), see table 3. There were eight correlations that were below r = .30, which suggests that there was no linear relationship. The low correlations included: REMS_A and Factor 2 (r = .25, p < .05), REMS_B and Factor 2 (r = .20, p < .05), REMS_C and Factor 2 (r = .26, p < .05), REMS_C and Factor 4 (r = .24, p < .05), REMS_D and Factor 4, REMS_A and Factor 7 (r = .20, p < .05), REMS_F and Factor 7 (r = .19, p < .05), and REMS_B and Factor 8 (r = .25 p < .05). Apart from these correlations, the majority of the
correlations ranged from a weak to moderate positive relationships.
Only one association was not significant, the correlation between ARMAS factor seven, Assumptions of professional advantage because of race/ethnicity and the REMS_B Second-class citizen and assumption of criminality subscale (r = .032, p >
38
.05). This non-significant correlation could be due to the characteristics of the sample being graduate students in academic settings. Perhaps they experience less
assumptions of criminality due the nature of the academic setting, which could be different in this respect from a community setting.
Discriminant Validity
The Buss-Perry Aggression scale was utilized to measure discriminant validity with the ARMAS-47. The hypothesis was that there would be low correlations
between the factors from these measures. The Pearson correlation results found five significant correlations at p < .05, but these were low enough to suggest no linear relationship between the factors of the two measures. The significant low correlations were between the Buss-Perry-Hostility subscale and Factor two, Assumptions of being a foreigner, (r = .132, p < .05), Buss-Perry-Hostility subscale and Factor three,
Multicultural issues seen as not a priority and being treated differently (r = .131, p < .05), and between Buss-Perry-Hostility subscale and Factor four, Invisibility/Felt ignored(r = .16, p < .05). Also, there were significant low correlations between the Buss-Perry-Verbal Aggression subscale and Factor three, Multicultural issues seen as not a priority and being treated differently (r = .142, p < .05), and the Buss-Perry-Anger subscale and Factor three, Multicultural issues seen as not a priority and being treated differently (r = .144, p < .05). As expected, the statistically significant
correlations between factors from both measures were low. These results suggest that the ARMAS-47 is relatively independent of the Buss-Perry aggression measure, and this finding strengthens the case that ARMAS-47 is a valid and appropriate measure of RM in academic settings, as distinct from a measure of aggression.
39
Table 3
Pearson Correlations Between ARMAS Factors and The REMS Subscales
REMS ARMAS Factors
Subscales 1 2 3 4 5 6 7 8 REMS_A .653** .248** .467** .362** .454** .346** .197** .328** sig 0 0 0 0 0 0 0.001 0 REMS_B .450** .204** .433** .425** .381** .387** 0.032 .252** sig 0 0.001 0 0 0 0 0.601 0 REMS_C .319** .261** .531** .241** .415** .614** .315** .349** sig 0 0 0 0 0 0 0 0 REMS_D .297** .652** .389** .201** .401** .344** .510** .548** sig 0 0 0 0.001 0 0 0 0 REMS_F .656** .337** .661** .572** .439** .419** .187** .299** sig 0 0 0 0 0 0 0.002 0
40 CHAPTER 4
RACIAL MICROAGGRESSIONS ASSESSMENT USING ARMAS The purpose of this section is to evaluate how the ARMAS-47 performs as a measure of RM in academic settings and to compare it with a demographic variable, in this case race, to answer the following question: Is there any significant difference between the ARMAS-47 scores across racial groups? In addition, are these RM experiences impacting graduate student consideration of leaving their graduate programs?
The results on this section were analyzed by looking at average scores of the ARMAS-47 factors by race groups. This data is illustrated in Figure 2. These results suggest that for factor one (Ascription of Intelligence), American Indian and Alaska Natives scored the highest, followed by Black participants and those who declined to identify their race. Those participants who declined to identify their race, most were international students and identified their ethnicity (n = 5), African, Moroccan, Arab and two Arab Americans. For factor two (Assumptions of being foreigner),
participants who declined to identify their race had the highest scores, followed by Asian and Hispanic or Latino/a participants. On factor 3 (Multicultural issues seen as not a priority and being treated differently) have higher scores for American Indian and Alaska Native, then Asian and Black participants. Next, factor 4 (Invisibility/Felt ignored) showed higher scores of participants who chose to not disclose their race, followed by American Indian and Alaska Natives and Asians. For Factor 5
(Assumptions about me and my work with clients/representing entire race), the ARMAS-47 scores were higher for American Indian and Alaska Natives, and then