methods for sorting suppliers in industrial environments is presented. The MCDM methods correspond to Electre and FlowSort and both are applied to the classification of providers in an actual case of the local softdrink bottling industry in Chile. The results show that Electre as an outranking method it may well classify suppliers in a similar manner as FlowSort does. Nevertheless, due to the intrinsic underlying fuzzy multicriteria nature of the problem, FlowSort is found to be more suitable method for building a rule-based system based on preference functions for automating the process of suppliers clustering when developing strategies of relationship management in the sense of the Kraljic categories in supply chain management.
Keywords: Decision Support Systems, Supply Management, Electre, FlowSort.
1
Introduction
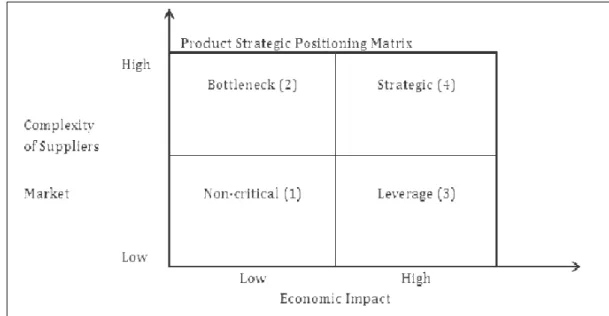
Supplier management is crucial in order to improve the benefits that a company can have at the operational, functional, economic, and financial levels and in terms of the supply chain it is embedded. Supplier evaluation is a regular process of operational management in many companies; the need arises from finding suppliers for new products, parts, or materials, or for assessing performance of the current supplier base in order to decide continuation of their services. However, in supplier management a more strategic task is classifying suppliers into categories for deciding the relational approach to be followed. Kraljic [1] in his pioneering work established categories of suppliers according to the economic impact for the purchasing company and the risks the suppliers may experiment in their respective market. As recently reviewed by Monczka et. al. [2] Kraljic’s categories are defined by a matrix of four quadrants, namely: routine, leverage, bottleneck and critical quadrant. Each category means different strategies ranging from automated transactions by the use of ERP and/or EDI of commodity items of low total purchasing expenses, i.e. routine category, up to the critical category in which for example the expenses are very high and the suppliers situation in its market is risky due to uncertainties, uniqueness or high dependence. See Figure 1 for an example of the Kraljic matrix. The number in parenthesis is a level in a scale from 1 to 4, as explained below.
Level 1: Many alternative products and processes; abundant sources of supply; low value-small individual transactions; routinary use, unspecified items; no specialized purchasing knowl-edge required.
Level 2: Complex specifications requiring complex manufacturing or service processes; few alternate production/sources of supply; big impact on operations / maintenance; new technology or untested processes.
Level 3: High expenditures, commodity items; large marketplace capacity, big inventories; many alternate products and services; many qualified providers; market/price sensitive demand. Level 4: Critical to profitability and operations; few qualified sources of supply; large expen-ditures; design and quality critical; complex and/or rigid specifications.
Figure 1: Kraljic Matrix 1 for strategic positioning
In this work the classification or categorization of suppliers in the case study, defines three categories: (a) transactional, (b) collaborative, and (c) integrated. These categories are specific for the company dealt with; however the method is general enough as to be applied to other similar situations.
A transactional supplier is understood as the profile of routine suppliers combining low pur-chasing expenses, easy-to-obtain commodity-type products or services, and with low mutual attraction in the relationship. A collaborative supplier is one of importance to the company due to high purchasing expenses. For this reason, close monitoring of performance is needed in order to assure the service level agreements and to control the costs. The logistics complexity is of medium range as well as the mutual attraction. An integrated supplier is a critical one, of such an importance that a strategic alliance is needed, such as the case of a third party fully man-ufacturing a component or a product for a given customer company’s brand (OEM strategy), as it occurs in the food, pharmaceutical, or car industries. It combines criticality in product positioning with high logistics complexity and high mutual attraction of the relationship.
Clearly, the three categories above can be understood as fuzzy sets where the implementation process of the method allows the identification of strengths and weaknesses of using formalized supplier selection models to tackle the supplier sorting problem. This highlights potential barriers preventing the adoption of these types of methods. For this purpose, the paper presents a number of relevant issues arising from the application and managerial implications for both customer and suppliers, concerning differentiated management practices according to their classification.
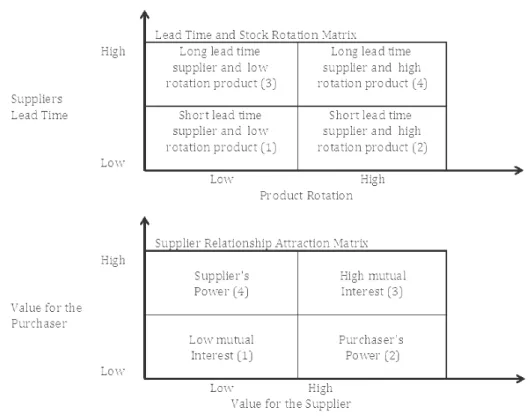
Besides Matrix 1, two other matrices are used to classify suppliers. Matrix 2 values the complexity of logistics, and Matrix 3 the mutual attraction of the SRM (supplier relationship management).
In Matrix 2 (Lead Time and Stock Rotation) the lowest level of logistics complexity is for supplies of fast replenishment and slow moving items. It the follows the case of suppliers of items with short lead time (hours, days, within a week) but of high consumption or inventory turnover. The third level is for slow moving items and long lead times (e.g. imported products); finally, the most complex logistics is for suppliers of items with high rotation and long lead time due the risk of inventory breakdown.
Figure 2: Matrices 2 and 3 for logistics complexity and SRM attraction level
provided by experienced purchasing executives, without loss of generality. In Matrix 3 (Supplier Relationship Attraction) the lowest level is assigned when both parties have little mutual interest. It follows when the purchaser is important to the supplier (level 2). For the specific case of the application, the managers gave the highest importance to suppliers with superior power in the relationship (generally due to size).
2
Strategies by category
With the suppliers being categorized, the organization can apply differentiated approaches to SRM. Next, a brief description of each category is given.
2.1 Transactional category
The transactional category has as main characteristics the existence of many alternative prod-ucts and services, many sources of supply, low value small individual transactions, commodity-type items, requiring little or no specialization of the purchasing executive. Hence, this category is non-critical and besides the logistics aspects are simple because lead times are short and ro-tation is low. The mutual relationship is of low level. The general strategy for this category is the simplification of the acquisition process. The tactics relate to increase the role of computer based systems and reducing the buying effort. Specific actions include rationalization of the supplier base, the automation of the purchasing process by the use of automated requisitioning, electronic data interchange, stockless procurement, minimization of administrative costs. Little negotiation is needed.
2.2 Collaborative category
The collaborative category has as main characteristics the existence of many alternative products and services, many sources of supply, commodity-type items, requiring little or no specialization of the purchasing executive. However, the purchasing expenses and volumes are higher. Hence, the optimization of operations serve as leverage for obtaining commercial advan-tage. Logistics may be more complex due to longer lead times and higher rotation of items. The type of relationship is of purchaser’s power. The general strategy for this category is maximizing the commercial advantage. The tactics involve concentration of purchasing to increase power and also to maintain competition. Specific actions involve the promotion of competitive bidding, procurement coordination, adoption of industry standards to reduce dependency.
2.3 Integrated category
This category has as main characteristics a heavy control of the providers performance, partnerships in the form of a strategic outsourcing, cooperation to optimize mutual benefits. For instance, a strategic supplier performing outsourced implant critical tasks of production and operations. The complexity of operations demands close control and information exchange. The importance of the purchaser and the criticality of the supplier calls for relations of mutual benefits. The attraction force of both parties is high.
3
Basics of the two methods
The ELECTRE methodology is based on the concordance and discordance indices. The simplest method of the ELECTRE family is ELECTRE-I. See Figueira et al. [3].
This method starts from the data in the decision matrix, and assumes that the sum of the weights of all criteria is equal to one. For an ordered pair of alternatives(Aj, Ak), the concordance index cjk is the sum of all the weights for those criteria where the performance score of Aj is least as high as that ofAk, as in formula (1). It can be seen thatcjk lies between 0 and 1.
cjk =
∑
i:aij≥aik
wi j, k= 1, .., n, j ̸=k (1)
The computation of the discordance index djk is more elaborated: djk = 0 if aij > aik , i = 1, ..., m, that is, the discordance index is zero if Aj performs better than Ak on all of the criteria. Otherwise, djk is calculated as in (2). That is, for each criterion whereAk outperforms Aj, the ratio is calculated as the difference in performance level between Ak and Aj and the maximum difference in score on the criterion concerned between any pair of alternatives.
djk =maxi=1,..,m
aik−aij
maxj=1,..,naij −minj=1,...,naij
j, k= 1, .., n, j ̸=k (2) The maximum of these ratios (which must lie between 0 and 1) is the discordance index. A concordance thresholdc∗ and discordance thresholdd∗ are then defined such that0< d∗ < c∗ <
1. Then, Aj outranks Ak if thecjk > c∗ and djk < d∗, i.e. the concordance index is above and the discordance index is below its threshold, respectively.
FlowSort is based on the Promethee ranking methodology (Figueira et al., 2005) [3], this new sorting method by Nemery and Lamboray [4] is utilized for assigning actions to completely ordered categories; these categories are defined either by limiting profiles (i.e., min and max values) or by central profiles (or centroids). This method has also been applied by (Sepulveda
R, are computed by equations (4) (5) (6) where Ri = R U {ai} is the extended set of profiles either for the limiting profile case or the central profiles. The rules for assigning actions ai to a category Ch are given by equations (7) and (8) in the case of limiting profiles.
π(x, y) = q ∑ j=1 wjP(x, y) (3) ϕ+˙ Ri = 1 R˙i−1 ∑ y∈Ri˙+ π(x, y) (4) ϕ−˙ Ri = 1 R˙i−1 ∑ y∈Ri˙− π(x, y) (5) ϕRi˙ =ϕ+Ri˙ −ϕ−Ri˙ (6) Cϕ+(ai) =Ch, if ϕ+˙ Ri(rh)≥ϕ + ˙ Ri(a1)> ϕ + ˙ Ri (7) Cϕ−(ai) =Ch, if ϕ−Ri˙ (rh)< ϕ−Ri˙ (a1)≤ϕRi−˙ (rh+1) (8)
4
Results of the two methods
First, the sorting will be made by the Electre method. Table 1 shows the score combination for six randomly chosen suppliers and the resulting category according to the values predefined for the combination by using Electre. The six cases are for illustrative purposes and show the type of results without loss of generality.
Table 2 shows the limiting profiles for the FlowSort method.
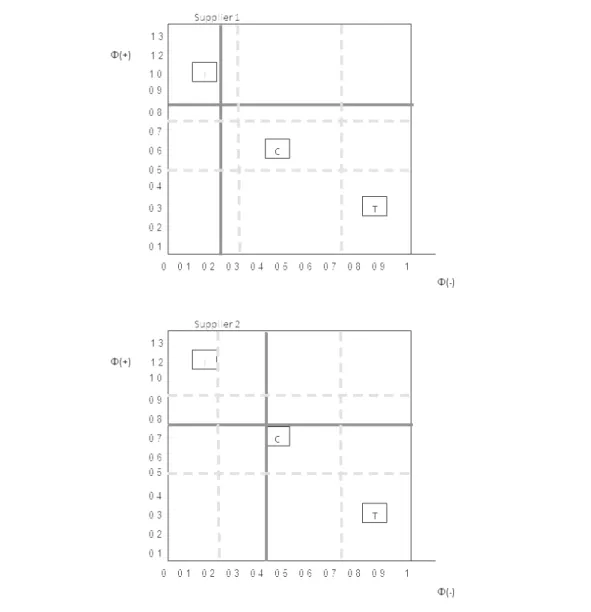
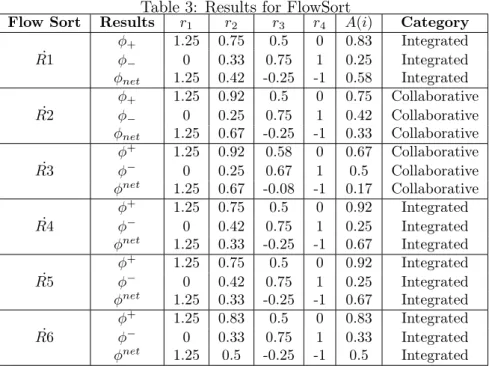
The scores for each criteria in FlowSort are the same as the combination values in Table 1. Table 3 shows the results for FlowSort. In the table, the six extended sets R correspond to suppliers A,B,C,D,E,F, respectively. The category is obtained by applying the rules defined by equations (7) and (8). It can be observed that for the six suppliers, with the exception of C, the assigned categories are the same.
This is encouraging since the basis of each method is very different. It can be said that in case C this provider was better classified by FlowSort. The difference obtained in one of the suppliers (Supplier C), is mainly because of the assessment data that show that this provider
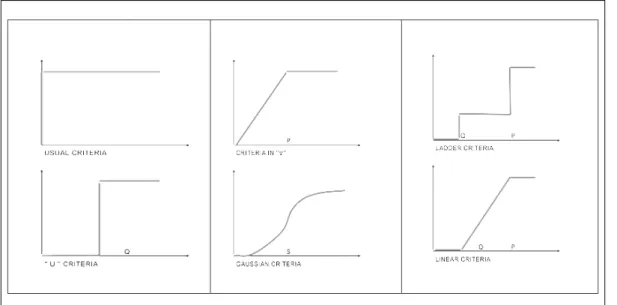
Figure 3: Types of Preference functions
Table 1: Results by Electre
Supplier Score combination Category
A "4-3-3" Integrated B "3-2-2" Collaborative C "1-2-3" Transactional D "4-3-4" Integrated E "4-3-4" Integrated F "4-3-2" Integrated
Table 2: Limiting profiles chosen for FlowSort
Profile C1 C2 C3
r1 4.5 4.5 4.5
r2 3.0 3.0 3.0
r3 1.5 3.0 3.0
Table 3: Results for FlowSort
Flow Sort Results r1 r2 r3 r4 A(i) Category
ϕ+ 1.25 0.75 0.5 0 0.83 Integrated ˙ R1 ϕ− 0 0.33 0.75 1 0.25 Integrated ϕnet 1.25 0.42 -0.25 -1 0.58 Integrated ϕ+ 1.25 0.92 0.5 0 0.75 Collaborative ˙ R2 ϕ− 0 0.25 0.75 1 0.42 Collaborative ϕnet 1.25 0.67 -0.25 -1 0.33 Collaborative ϕ+ 1.25 0.92 0.58 0 0.67 Collaborative ˙ R3 ϕ− 0 0.25 0.67 1 0.5 Collaborative ϕnet 1.25 0.67 -0.08 -1 0.17 Collaborative ϕ+ 1.25 0.75 0.5 0 0.92 Integrated ˙ R4 ϕ− 0 0.42 0.75 1 0.25 Integrated ϕnet 1.25 0.33 -0.25 -1 0.67 Integrated ϕ+ 1.25 0.75 0.5 0 0.92 Integrated ˙ R5 ϕ− 0 0.42 0.75 1 0.25 Integrated ϕnet 1.25 0.33 -0.25 -1 0.67 Integrated ϕ+ 1.25 0.83 0.5 0 0.83 Integrated ˙ R6 ϕ− 0 0.33 0.75 1 0.33 Integrated ϕnet 1.25 0.5 -0.25 -1 0.5 Integrated
has some lower scores in some criteria (matrix- criterion 1) and high in other ones ( 2 and 3 ) and the final class depends on the decision maker.
However, note that FlowSort is a method that reflects the in and out flows generated by the alternatives, while the classification made in the Electre is arbitrary at some extent by the threshold values chosen for each category. Nevertheless, both methods solve the problem and are suitable for automating the classification process as part of a decision support system for supply management.
Figure 4 shows a graphical representation of the sorting for Suppliers 1 and 2, as given by Table 3.
In Table 1 the category is chosen according to the values in Table 4. This shows the results of the Electre method for the 64 possible combinations of the three matrices with the aggregated dominance index (concordance minus discordance). The score values of Table 4 in columns Score Matrix 1,2,3 (indicated as SM1, SM2, SM3) for each supplier score combination (SC) were given by experienced supply managers same as in the FlowSort method. Current work is addressing the obtention of these numbers from the key performance indicators in the database of a business intelligence module connected to the ERP system.
The categories are obtained by sorting in increasing order of the aggregated dominance index (A.D.I.) and by defining thresholds for each category. The weights were chosen as 1/3 each matrix (w.l.g). For instance, as shown in Table 1, Supplier A with scores "4-3-3" corresponds to the combination "a60"in the Appendix, Supplier B with scores "3-2-2" corresponds to "a35", and so on. In this case, the same cases were used for both the Electre and FlowSort methods.
a12 2 2 1 3 Transactional a45 2 3 3 22 Integrated
a13 4 1 1 3 Transactional a44 4 4 1 27 Integrated
a14 1 2 3 6 Transactional a39 1 4 4 28 Integrated
a15 1 3 2 6 Transactional a42 4 1 4 28 Integrated
a16 2 1 3 6 Transactional a50 3 2 4 31 Integrated
a17 2 3 1 6 Transactional a53 4 3 2 31 Integrated
a18 3 1 2 6 Transactional a48 2 3 4 32 Integrated
a19 3 2 1 6 Transactional a49 2 4 3 32 Integrated
a23 2 2 2 7 Collaborative a51 3 4 2 32 Integrated
a20 1 2 4 10 Collaborative a52 4 2 3 32 Integrated
a21 1 4 2 10 Collaborative a54 3 3 3 35 Integrated
a22 2 1 4 10 Collaborative a56 4 2 4 43 Integrated
a24 2 4 1 10 Collaborative a57 4 4 2 43 Integrated
a25 4 1 2 10 Collaborative a55 2 4 4 44 Integrated
a26 4 2 1 10 Collaborative a58 3 3 4 45 Integrated
a27 1 3 3 11 Collaborative a59 3 4 3 45 Integrated
a28 3 1 3 11 Collaborative a60 4 3 3 45 Integrated
a29 3 3 1 11 Collaborative a61 3 4 4 55 Integrated
a32 2 2 3 12 Collaborative a62 4 3 4 55 Integrated
a33 2 3 2 12 Collaborative a63 4 4 3 55 Integrated
a35 3 2 2 13 Collaborative a64 4 4 4 63 Integrated
5
Conclusions and future works
In this article, the comparison of two methods for supplier sorting for determining the sup-plier management strategy in large organizations has been presented. Assigning a category to a supplier is an important task within supply chain management since many types of suppliers are commonly in place and differentiated management approaches are needed in order to accomplish the efficiency and service objectives. The sorted categories combined three main dimensions: strategic positioning (matrix 1), logistics complexity (matrix 2), and attraction of the mutual relation (matrix 3). While the original Kraljic’s matrix is concerned only with strategic position-ing, giving four categories of suppliers: non-critical or routine, leverage, bottleneck, and critical, the contribution in this work is that the analysis has been extended to other dimensions, such as logistics complexity (matrix 2) and the attraction of mutual relation (matrix 3).
By using the extended Kraljic’s matrix concept developed in this work, a portfolio of strategies may be identified according to the defined categories: transactional, collaborative, and integrated suppliers. Commonly, the analysis of suppliers is performed based on experienced managers over a restricted number of cases. In large organizations, however, because of the high number of suppliers, such manual method becomes difficult and prone to error. With multicriteria sorting
models it is possible to overcome this weakness and even automate this task. Flowsort was compared to ELECTRE. A good coincidence was obtained between these two methods. However Electre requires previously defined categories by using explicit enumeration and threshold values entered manually by experts. In this sense, Flowsort requires less human input being more adaptable for automated processing.
As direction for future works, further research is needed in order to examine the robustness of the results and the effects of the scales used in the assessment. Also, in order to minimize human data input, the scores in the matrices ideally should be obtained in a direct manner from the key performance indicators (KPI) obtained from the ERP system of the organization, or from a business intelligence (BI) module, among other aspects. Ongoing work of the authors is addressing these issues.
Acknowledgments
The authors are very grateful to DICYT (Scientific and Tecnological Research Office), Project Number 061117SS and the Industrial Engineering (IE) Department, both of the University of Santiago of Chile for their support in this work. Also to IE graduates Marcos Melin and Stephanie Sepulveda who helped in the data collection and model implementation.
Bibliography
[1] Kraljic, P. (1983); Purchasing must become supply management,Harvard Business Review, September-October, 1983.
[2] Monczka, R.M., Handfield, R.B., Giunipero, K.C., Patterson, J.L. (2011); Purchasing And Supply Chain Management, 5th Edition, Cengage Learning.
[3] Figueira, J., Greco S., Ehrgott M. (2005);Multiple Criteria Decision Analysis: State of the Art Surveys, Springer-Verlag.
[4] Nemery P.; Lamboray C. (2008); FlowSort: a flow-based sorting method with limiting or central profiles, TOP, 16, 90-113, Springer-Verlag.
[5] Sepulveda, J., Gonzalez, J., Alfaro, M. (2010); A Metrics-based Diagnosis Tool for Enhanc-ing Innovation Capabilities in SMEs, International Journal of Computers Communications & Control, 5(5):919-928.