04 August 2020
Deep learning for semantic segmentation of 3D point cloud / Malinverni, EVA SAVINA; Roberto, Pierdicca; Marina,
Paolanti; Massimo, Martini; Christian, Morbidoni; Matrone, F.; Lingua, A.. - In: INTERNATIONAL ARCHIVES OF THE
PHOTOGRAMMETRY, REMOTE SENSING AND SPATIAL INFORMATION SCIENCES. ISSN 16821750.
-ELETTRONICO. - XLII-2/W15:2(2019), pp. 735-742.
Original
Deep learning for semantic segmentation of 3D point cloud.
default
Publisher:
Published
DOI:10.5194/isprs-archives-XLII-2-W15-735-2019
Terms of use:
openAccess
Publisher copyright
No description
(Article begins on next page)
This article is made available under terms and conditions as specified in the corresponding bibliographic description in
the repository
Availability:
This version is available at: 11583/2769373 since: 2019-11-24T23:35:41Z
DEEP LEARNING FOR SEMANTIC SEGMENTATION OF 3D POINT CLOUD.
E.S. Malinverni1, R. Pierdicca1∗, M. Paolanti2, M. Martini2, C. Morbidoni2, F. Matrone3, A. Lingua31Universit´a Politecnica delle Marche, Dipartimento di Ingegneria Civile, Edile e dell’Architettura, 60100 Ancona, Italy
(r.pierdicca, e.s.malinverni)@staff.univpm.it
2Universit´a Politecnica delle Marche, Dipartimento di Ingegneria dell’Informazione, 60100 Ancona, Italy
(m.martini,m.mameli)@pm.univpm.it, (m.paolanti, e.frontoni)@staff.univpm.it
3Politecnico di Torino, Dipartimento di Ingegneria dell’Ambiente, del Territorio e delle Infrastrutture, 10129, Torino, Italy
(andrea.lingua, francesca.matrone)@polito.it
Commission II, WG II/8
KEY WORDS:Point Cloud, Segmentation, Classification, Deep Learning, Synthetic Dataset
ABSTRACT:
Cultural Heritage is a testimony of past human activity, and, as such, its objects exhibit great variety in their nature, size and complexity; from small artefacts and museum items to cultural landscapes, from historical building and ancient monuments to city centers and archaeological sites. Cultural Heritage around the globe suffers from wars, natural disasters and human negligence. The importance of digital documentation is well recognized and there is an increasing pressure to document our heritage both nationally and internationally. For this reason, the three-dimensional scanning and modeling of sites and artifacts of cultural heritage have remarkably increased in recent years. The semantic segmentation of point clouds is an essential step of the entire pipeline; in fact, it allows to decompose complex architectures in single elements, which are then enriched with meaningful information within Building Information Modelling software. Notwithstanding, this step is very time consuming and completely entrusted on the manual work of domain experts, far from being automatized. This work describes a method to label and cluster automatically a point cloud based on a supervised Deep Learning approach, using a state-of-the-art Neural Network called PointNet++. Despite other methods are known, we have choose PointNet++ as it reached significant results for classifying and segmenting 3D point clouds. PointNet++ has been tested and improved, by training the network with annotated point clouds coming from a real survey and to evaluate how performance changes according to the input training data. It can result of great interest for the research community dealing with the point cloud semantic segmentation, since it makes public a labelled dataset of CH elements for further tests.
1. INTRODUCTION
The Cultural Heritage (CH) of each nation is witness to the past history of the human activity, which is represented by objects of several nature, size and complexity. However, CH around the world suffers of natural disasters, wars, human negligence and damage caused by the passage of time for which the impor-tance of CH documentation is nationally and internationally rec-ognized. Especially in recent decades, technology has been much used as a new form of heritage documentation. Ranging from dif-ferent scales, historical buildings, ancient monuments, historical centers, archaeological sites, till small artifacts and museum ob-jects are more and more represented by 3D technologies. For example, the use of three-dimensional modelling and scanning of archaeological sites greatly increased in the last years (Re-mondino and Stylianidis, 2016). Lasers scanner tools, originally used for industrial applications, are today regularly employed for CH recordings. Recent advances in Terrestrial Laser Scanning (TLS) allow automatic, fast and efficient collection of 3D co-ordinates of cultural heritage objects. The variables that drive the choice of this data collection technique are countless, but for the majority of the application it can be considered a valid al-ternative to digital photogrammetry (Yastikli, 2007). In fact, it can be employed for many purposes: historical interpretation, planning interventions, monitoring and supervising, application of augmented and virtual reality, documentation, integration of Geographic Information Systems (GIS) and Building
Informa-∗[email protected]
tion Modeling (BIM) and more (L´opez et al., 2017). 3D point clouds are simply collection of points in a coordinate space. The information associated to each point can be augmented, by means of data coming from other sensors, as RGB colors, thermal and multispectral content. While they are useful to visualize a given scene (e.g. the interior of a church), they lack of structured in-formation about the single objects that are represented, such as surfaces, dimensions and semantics. For this reason, their man-agement is mainly entrusted on the usage of dedicated BIM soft-ware environments, in which the point cloud is used as a start-ing point for the creation of parametric objects (Logothetis et al., 2015), (Quattrini et al., 2017a), (Quattrini et al., 2017b). This way, the association of specific information (data enrichment) to the geometries composing a building are more reliable and ac-curate. To date, the process of transforming a point cloud to a structured 3D model is a time consuming task and is generally done manually by domain experts, involving different steps, such as:
• Visually inspecting the point cloud to identify architectural elements of interest;
• Appropriately representing each element as a 3D parametric object;
• Correctly positioning each element into a 3D scene; • Annotating elements to classify them according to domain
thesauri and/or ontologies, as well as to add additional in-formation of various type.
A big challenge in the CH domain is that of fully automatizing the previous workflow, enabling machines to ingest a 3D point cloud as input and to produce a meaningfully annotated 3D para-metric model as output. The first step in this direction is that of automatically segmenting a point cloud in order to identify and label the different architectural elements. This task is called se-mantic segmentation, that is the task of classifying each single 3D point with respect to predefined classes. In our case, the classes are different kinds of architectural elements (e.g. walls, doors, columns, stairs, etc.). The activity of segmentation is responsi-ble for grouping the point clouds into subsets, named segments, on the base of one or more common features, that are geometric, radiometric, and so on. The subsequent classification procedure classifies the segments to a class taking into account proper cri-teria (Grilli et al., 2017), (Liciotti et al., 2018). In other words, from the point of view of automatic recognition techniques, the segmentation process has the task to group point clouds in homo-geneous regions with the same properties, while the classification procedure labels the different groups. However, there are several issues related to segmentation and classification owing to irregu-lar sampling, variable density and multiple kinds of objects. This occurs, mostly with regards to CH, for data management, docu-mentation and preservation aspects.
In this context, with the advent of big data, traditional feature-based approaches have evolved into deep learning approaches, which are currently considered a more powerful and efficient way to manage huge amounts of data (Qi et al., 2017a, Qi et al., 2017b). According to (Zhang et al., 2018), deep learning tech-niques can automatically learn robust and discriminative feature representations from 3D point clouds. Authors proposed a frame-work for urban scene labeling and building modeling from out-door scenes point clouds and demonstrated that their ReLu-NN efficiently parses the outdoor scenes and is able to recognize dif-ferent classes of objects even if they have similar shapes. In (Hackel et al., 2017), Deep Convolutional Neural Networks (DCNNs) have been used for a wide range of applications con-cerning images analysis based on learning. Their success is mainly due to their parallel architecture and the wide availability of pub-lic dataset (e.g. ImageNet (Krizhevsky et al., 2012)). Notwith-standing, the use of DCNNs for segmentation and classification of 3D point clouds is very difficult, since 3D point clouds con-sist of millions of points, irregular, not grid-aligned and in places very sparse structure, with strongly varying point density; thus, they can not be easily processed by networks based on supervised learning. Moreover, it is also difficult to define common patterns of the same class of objects, since point clouds of the same ob-jects can have among them different properties. This problem occurs above all in the CH area, because the objects present very complex shape and even when repeatable, objects appear unique since they are handcrafted and did not derive by a serialized pro-duction. Without taking into account the aging process that these objects undergo over the years.
Given the above, the aim of this work is to propose a method to la-bel and cluster automatically a point cloud based on a supervised Deep Learning approach, using a state-of-the-art Neural Network called PointNet++ (Qi et al., 2017b). In PointNet++, the neigh-borhoods are statically defined by a metric distance, with their proposal that creates the neighborhood on the basis of the feature space. Despite other methods are known (e.g. (Ravanbakhsh et al., 2016, Klokov and Lempitsky, 2017, Ben-Shabat et al., 2017)), we have chosen PointNet++ as it reached significant results in classifying and segmenting 3D point clouds of indoor scenes (as it was evaluated on the ScanNet dataset (Dai et al., 2017)). This work shows that the deep networks are useful even in the
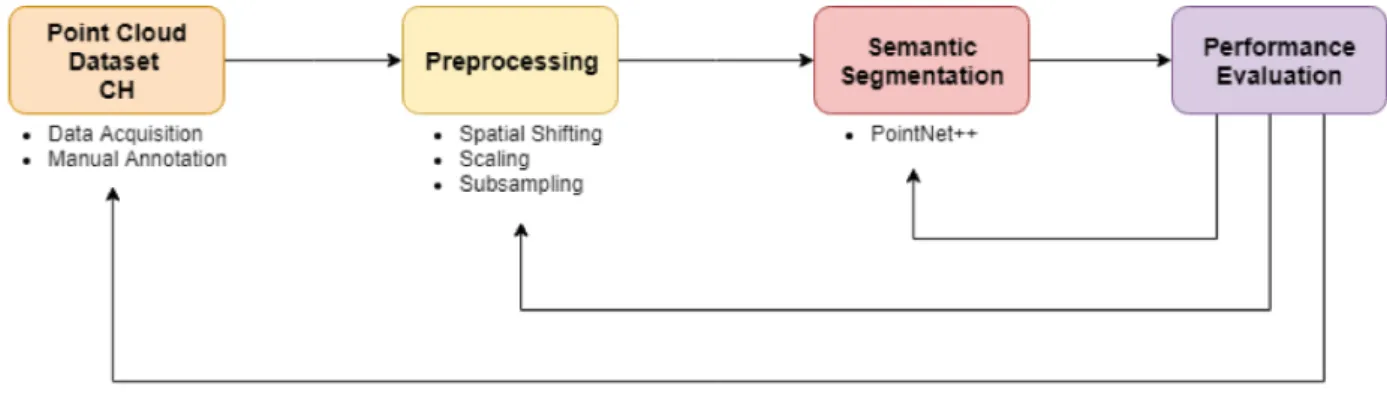
CH domain by evaluating the approach on a newly created CH dataset manually annotated by domain experts. Moreover, this work results of great interest for the research community deal-ing with point cloud segmentation, since it will make public a labelled dataset of CH elements for further tests. Besides this, our research attempts to outline a specific pipeline that, consid-ering the complexities state above, may result useful for other researchers dealing with Semantic Segmentation of point clouds with DL approaches. The workflow set up for our tests is reported in Figure 1:
The paper is organised as follows: Section 2 is an overview of the research status of 3D points cloud approaches for cultural her-itage field; Section 3 introduces more specifically our approach, describing the dataset purposely created and the implemented PointNet++; Section 4 discusses the results obtained and Sec-tion 5 introduces conclusions and future works.
2. RELATED WORKS
Mainly in the last years, the use of 3D modeling for documen-tation and interpredocumen-tation of archaeological and cultural heritage is considerably increasing. Given the high complexity and het-erogeneity of 3D data together with the diversity of heritage re-sources, many segmentation and classification methods are cur-rently being investigated.
According to (Grilli and Remondino, 2019), in the field of CH, it is important to identify the different components in point clouds and 3D mesh in order to make the study of monuments easier, by adding information and attributes. In literature there are several works that attempt at classifying CH images by employing differ-ent kinds of techniques, such as Naive-Bayes Nearest-Neighbor classifier (Mathias et al., 2011), Support Vector Machines(Oses et al., 2014), K-means algorithms (Shalunts et al., 2011), Latent Dirichlet Allocation (Zhang et al., 2014) and Deep Learning (Lla-mas et al., 2017).
In (Campanaro et al., 2016), the authors, combining 3D visu-alization and GIS analysis, realized a 3D management system for CH structures. They subdivided the elements in architectural sub-elements creating many different orthoimages. Similar to this work is the idea of (Grilli et al., 2018), even if to avoid the cre-ation of different orthoimages, they have produced the 3D model using textured UV maps. The authors use 2D segmentation of the texture of 3D models generated considering three archaeolog-ical case studies in Italy (Villa Adriana in Tivoli; Cavea walls of the Circus Maximus in Rome; Portico in Bologna). Supervised machine learning on UV maps is used for classification of the 3D cultural heritage models. The authors propose the use Deep Learning to get a better classification accuracy.
Sithole (Sithole, 2008) propose a semi-automatic segmentation method based on a weighted proximity segmentation for the de-tection of bricks in a masonry wall. The author, after a 3D tri-angulation of a 3D point cloud acquired by terrestrial laser scan-ner, associates to each point the reflectance values and an RGB triple. The proximity based segmentation uses the triangulation, reflectance and RGB triple.
In the work of (Brodu and Lague, 2012), the authors propose a new classification algorithm (named Canupo) based on a super-vised learning for 3D point clouds. The algorithm works directly on large point cloud datasets, is widely insensitive to shadow ef-fects or changes in point density, and moreover it allows a certain variability and heterogeneity in the characteristics of the classes. The same Canupo classification algorithm is also used in the work of (Farella, 2016) that elaborates 3D point clouds acquired by
This contribution has been peer-reviewed.
Figure 1. Workflow with the four main steps of semantic segmentation procedure. laser scanning of two different kinds of environments. This
ap-proach is also based on a manual segmentation method. A two-step classification approach based on point feature his-tograms and the bag-of-features method for automatic recogni-tion of similar objects in mobile lidar point clouds was proposed by (He et al., 2017). The proposed two-step classification ap-proach has the aim to considerably improve the conventional one-step classification approach with insufficient and unbalanced train-ing data.
The INCEPTION project concerns the development of tools and methodologies to obtain 3D models of cultural heritage assets, enriched with semantic information and integrated on a new (H)-BIM platform. As part of the project, the work of (Llamas et al., 2016) uses deep learning techniques, in particular Convolutional Neural Networks (CNNs) for classifying images of CH. They re-tain that the application of these techniques can give a significant contribution to the digital documentation of cultural heritage.
3. MATERIALS AND METHODS
In this section we describe the methodology used in the present study. The implemented workflow consisted of 4 main steps, al-ready mentioned in the introduction section and reported in the following sub-paragraphs.
In the following sections the 4 steps are described in detail.
3.1 Dataset creation
During theacquisitionphase, the point clouds can be acquired by different instruments and each instrument will generate clouds with a variable density of points. For example, the “Politecnico di Torino” has acquired the point clouds of 4 different monuments. These first case studies were chosen in order to have both indoor and outdoor scenes of CH and to develop a method suitable for the most of the historical architectural sites.
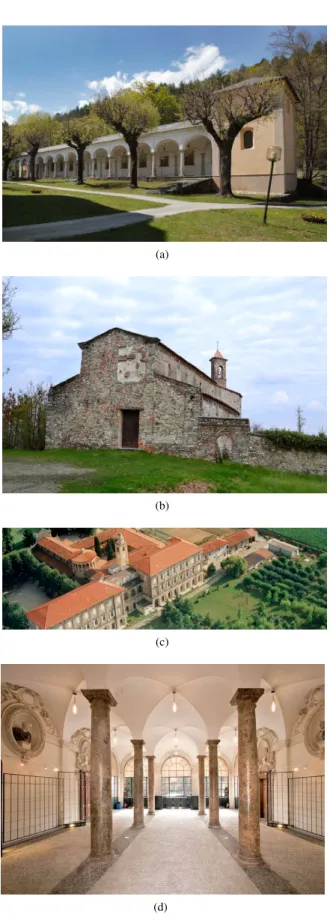
- The Sacro Monte di Ghiffa (VCO) (Figure 2a), together with other 8 Sacri Monti in the north of Italy, is a UNESCO site, in-serted in the World Heritage List in 2003. It dates back to the late XVI, mid XVII century and it is composed by a 30 meters open gallery with tuscanic columns and half pilasters. It was surveyed with both TLS (FARO CAM2) and UAV (Phantom 4 Pro): this allowed to integrate two different point clouds, the terrestrial one mainly for the walls and the aerial one for the roofs. On one side, this integration guaranteed a complete result, but on the other it combined two different point clouds, with different density and
metric, increasing the overall point cloud size. - The same ap-proach was followed for the survey of the second case study, the small rural Church of Santo Stefano in the town of Candia (Fig-ure 2b), near Turin, with totally diverse construction techniques and materials (e.g. the roof is composed by tiles, whereas in the previous one it is made of stone slabs typical of the vernacular architecture; the masonry is formed by stones, while in the other the walls are plastered and so on).
- The Sanctuary of Trompone (VC), compared with the formers, is a wider complex and it consists of a Church (about 40 x 10 m) and a cloister (Figure 2c), both surveyed with the aforemen-tioned TLS. The main nucleus of the Church dates back to the XVI century and nowadays the internal structure is composed of two rows of stone columns in Tuscan style, that divide the hall into three naves. There are also cross vaults in the side naves, set on columns and on pilasters leaning against the side walls of the building, object of pictorial decoration.
- Finally, the indoor scene of the Castello del Valentino (TO), to-tally surveyed with TLS, represents a stately room of the late XVI century (Figure 2d), with cross vaults on top of six sturdy breccia columns, large French windows and a series of oval niches dec-orated with stuccos, containing busts of Roman emperors. This room and the whole building are part of the serial site of the Savoy Residences in Piedmont, declared UNESCO site in 1997.
Table 1. Points cloud acquired by the “Politecnico di Torino” of 4 different monuments
Scene Classes Objects Points Points (milions)
SMG 9 98 25 623 151 25.6 M
CA 6 44 28 758 151 28.7 M
VAL 7 66 43 174 298 43.1 M
TR 10 589 569 035 066 569 M
Analyzing the table 1, we can see that the scenes consist of mil-lions of points, a high number of points to be processed in the fol-lowing phases. Furthermore, based on the instrumentation used, we can have different characteristics for each point. In addition to the georeferenced coordinates, we could have:
• RGB color; • XYZ normal;
• Reflectance (reply given by the material when it is hit by the laser)
In the labeling procedure, the first phase concerns determining the ground truth for each object of the acquired scene. Currently
(a)
(b)
(c)
(d)
Figure 2. The four case studies used for the dataset creation and labelling.
this phase is done by a human operator, using various software tools as, for example, Autodesk ReCap 360.
Each scene is segmented into various objects and each object be-longs to a class.
In order to develop a unified method for the architectural
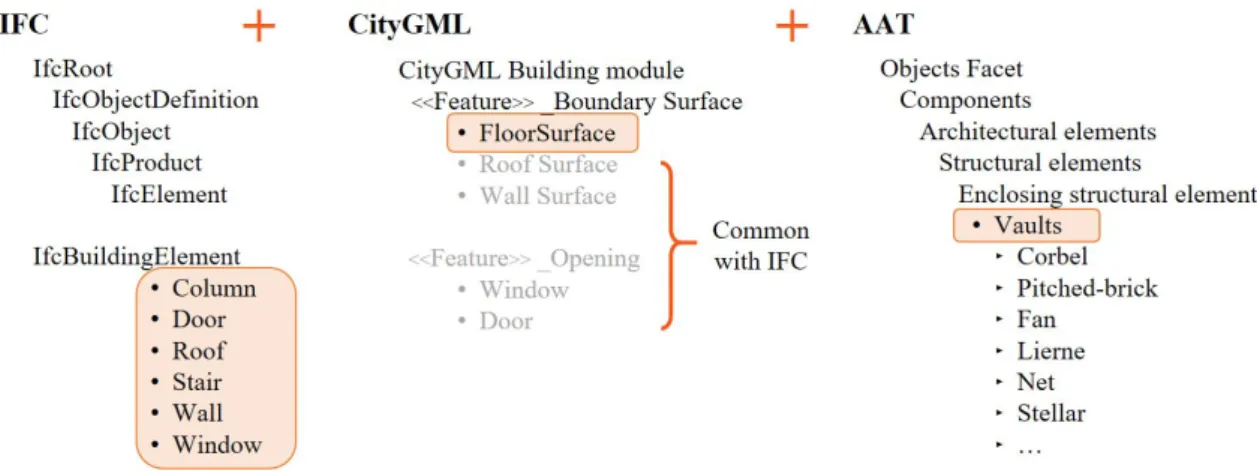
ele-ments classification, some existing standards have been exam-ined. In particular, the .IFC and CityGML standards were se-lected. The first one is meant for the AEC field (Architecture Engeneering Construction) with an architectural scale, while the second is mainly for urban and territorial data, but, as it is struc-tured on different Level of Detail (LOD) (Biljecki et al., 2016), it also foresees specific parts for building elements. In the early stage of this research it is established to segment the point clouds according to a CityGML LOD 3, hence not yet a part segmen-tation, but still different architectural elements. Moreover as the classes included in these two standards were not enough to de-scribe properly a CH , the AAT (Art & Architecture Thesaurus) by the Getty Institute was perused.
With this purpose, 9 classes have been selected (Figure 3), plus another one defined as ”other” with all the unclassified points, not belonging to the previous ones (e.g. paintings, altars, benches, statues...) .
It is therefore possible to create a folder for each class, and save objects of the same class. Even the name must be formatted in such a way as to recognize the type of object, the class, and per-haps subclasses that could be used in the future (Example: folder Door, file Door-Entrancedoor.txt). In each file all the information of the object are saved (coordinates, color, normal, and more) in such a way that the choice of which to use will occur only dur-ing segmentation. A more clear visualization of the procedure adopted for data labelling, as done for each case study, can be seen in Figure 4.
3.2 Pre-processing
In this phase, the original dataset is adapted to be used in the most efficient manner in the segmentation phase. Pre-processing techniques can be different: scaling, translation and subsampling. The first operation is the normalization which makes it possible to render the various scenes of the dataset as similar as possible to each other. Our intent is to make the scenes as similar as pos-sible to the ScanNet (Dai et al., 2017) dataset scenes, used by the authors of the PointNet++ network to train them in the semantic segmentation phase.
Concerningtranslation, since the scene coordinates are georef-erenced, we could have high coordinates for certain scenes and small coordinates for others. The scenes were thus spatially trans-lated into the cardinal point (0,0,0).
In thescalingprocedure, it is necessary to scale the scenes so that their dimensions are spatially similar. The ScanNet dataset has all the scenes in the same plane, while our scenes are monuments po-sitioned on different levels. Then appropriate proportions can be made to respect the dimensions of the ScanNet plane (max height = 7, looking at the previous performances).
Concerning thesubsampling, the original point clouds are, gen-erally, composed of millions of points. These are too heavy to be computed by a deep network, and surely they will also be very redundant, even considering the geometric characteristics of an object. So a downsampling of the point clouds was performed, even reducing the original data 100 times (at this stage, we are not able to provide a detailed vademecum for this step, and future tests will be performed in order to understand the right balance in term of number of points to be processed). There are several methods and software to use, an example is the CloudCompare software which can subsample in three different ways: i) Ran-dom; ii) By distance between points; iii) Octree method, selecting a level as a parameter. Low level means more subsampling. The latter method is better than the previous two. A further
prepro-This contribution has been peer-reviewed.
Figure 3. General schema of the unified method for the architectural element definition and classification. cessing operation that could improve performance is the ability
to balance the dataset classes. The balance could be done:
• By point, so trying to balance all the points of the classes. • By object, then balance the number of objects for each class.
The balancing can be done by going to further subsample the points-dense objects or eliminating those redundant objects.
3.3 PointNet++ segmentation
PointNet++ is a hierarchical neural network which process a set of points sampled in a metric space. The key idea is the following:
• It partitions the set of points into overlapping local regions by the distance metric of the underlying space;
Figure 4. Visualization of architectural classes definition. On the left the scanned object, on the right each specific class.
• Similar to Convolutional Neural Networks (CNNs), it ex-tracts local features capturing fine geometric structures from small neighborhoods;
• Such local features are further grouped into larger units and processed to produce higher level features.
This process is repeated until the features of the whole point set is obtained. In real scenarios, we can observe that point sets are usually sampled with varying densities, which results in greatly decreased performance for networks trained on uniform densities. To address this issue, a set of learning layers is used to adaptively combine features from multiple scales, generating a hierarchical structure. This structure is composed by a number of set abstrac-tion levels. At each level, a set of points is processed and ab-stracted to produce a new set with fewer elements. The network can work in 3 possible configurations, that is SSG, MSG, MSR:
• Each abstraction level contains grouping and feature extrac-tion of a single scale (SSG).
• Each abstraction level extracts multiple scales of local pat-terns and combine them intelligently according to local point densities. In terms of grouping local regions and combining features from different scales, we can choose two types of density adaptive layers as listed below:
1. Multi-scale grouping (MSG); 2. Multi-scale resolution (MSR).
PointNet++ network has 3 different implementations to carry out 3 different tasks: Classification, Part-Segmentation and Semantic Segmentation. In our study we experimented with the third type of network.
First we must choose which scenes will be part of our tests. We need to split the dataset into training and testing, possibly having both classes of objects. The optimal situation would be to have balanced classes, but this is not always possible. In the case study mattter of this work, we consider 3 sample scenes: in common they have only the classes Window, Wall, Floor, Roof. In fact, in the case in which the scenes have different types of objects, the classes intersect, leaving only the objects common to all. It is in this case that the subdivision of the objects in the various folders is useful, since in this way, thanks to a python script, the scenes can be generated in a personalized way.
• Training and testing scenes can be entered as lists of names. • In addition to the XYZ coordinates, we can also read the other features (color, reflectance, normal) from the scene files, simply by setting the initial parameters.
• The original version of PointNet++ did a training in which a sampler took only 8192 points for each training scene (each epoch). But in this way the training was unbalanced, be-cause the network was unbalanced only on the classes that were taken by this sampler. Instead we, at every age, sample the entire training scene (as happens also for the testing). • During training are saved:
– the weights of the network;
– the confusion matrix and the metrics (Precision, Re-call, F1-Score) of training and testing;
– the metrics based on points and metrics based on Vox-els;
– data inputs to the network and the outputs predicted by the network (i.e. point clouds with the aforementioned labels).
The described classification method is point-based, i.e. we have a predicted class for every point. To further evaluate the approach we performed a post processing phase to transform the predicted results into an object-based classification. We have used a Win-ner Take All (WTA) approach. As first step, we isolate the single objects from the test scene by using their bounding boxes previ-ously calculated. Then, we calculate the classification percentage of each predicted class for each individual object. If the clas-sification percentage exceeds a certain threshold, then we will associate that “winning” class with that object.
3.4 Performance evaluation
Thanks to all that saved during the training, it is possible to know if the network is training well or is unbalancing only on some classes. In this way the PointNet++ parameters can be modified in order to improve the results. Actually taking into account the workflow in figure 1, will be also possible to go back to the pre-vious steps and make changes to the preprocessing of the dataset, or even to the labeling. So, the workflow can be viewed as a cycle (with feedback), not necessarily as a sequential procedure.
4. RESULTS AND DISCUSSION
In our preliminary experiments to assess the use of Pointnet++ on our CH dataset, we selected two scenes, CA for training and VAL for testing, and we restricted the number of classes to 4 ba-sic architectural elements: Arc, Column, Wall and Window. Both scenes were shifted, scaled and subsampled as explained in the previous section. We used different combination of hyperparam-eters:
• batch size, with value: 1, 2, 4, 8, 16;
• learning rate: from 1−2to 1−9, using the SGD optimizer;
• scene sampler with different point combinations: 1024, 2048, 4096, 8192.
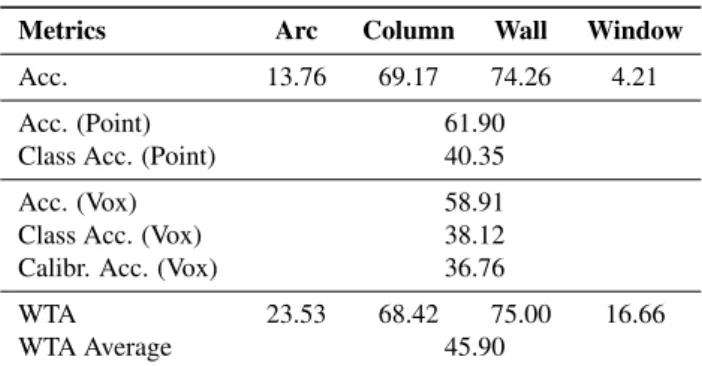
The combination with the best results was: batch-size=2, learn-ing rate=1−6and sampler=8192 points. In Table 2, we show the accuracy for each class, the whole accuracy (point-based) and the average accuracy for the 4 classes. The same metrics were also calculated on a voxel basis. We also report the calibrated aver-age accuracy, weighted based on the population of every class. In the last row of the table, we report the results of the object-based classification (using the WTA technique), both for each class and averaged.
Table 2. Accuracy for each class considering metrics based on points, based on Voxels and WTA technique.
Metrics Arc Column Wall Window
Acc. 13.76 69.17 74.26 4.21
Acc. (Point) 61.90
Class Acc. (Point) 40.35
Acc. (Vox) 58.91
Class Acc. (Vox) 38.12
Calibr. Acc. (Vox) 36.76
WTA 23.53 68.42 75.00 16.66
WTA Average 45.90
Moreover on the Table 3 we can see the standard metrics of the point-based classification: we show Precision, Recall, F1-Score for each class along with the mean averages of these metrics.
Table 3. Precision, Recall and F1-score for each class.
Classes Precision Recall F1-Score
Arc 63.12 14.65 23.55 Column 49.10 70.02 57.60 Wall 17.80 74.11 28.55 Window 17.51 05.67 07.89 Micro Avg 33.91 33.91 33.91 Macro Avg 36.12 41.88 29.12 Weighted Avg 51.76 33.10 30.80 5. CONCLUSIONS
This paper shows preliminary results of an ongoing, challeng-ing research. Albeit specific domains (e.g. indoor scenes) has reached good results in terms of semantic segmentation using state of art NN, the CH one still shows several bottleneck that, with the proposed workflow, we attemped to solve. In fact, whether for indoor scenes acquired with low cost (and low resolution) ac-quisition sensors, semantic segmentation performance are fine, for CH the same approaches cannot be applied from scratch; the reason of this lies, basically, on the complexity of the training scenes. To overcome this limitation, our work starts from a tidy process of labelling. This dataset, used to train PointNet++ and combined with the WTA in the final segmentation stage, seems promising. Future developments of this research will include the association to the NN of a structured ontology for the semantic parsing, in order to control and enhance the segmentation with some predefined constraints, and the further specification of more detailed classes (to be connected with an external object library for the automatic element reconstruction) Future experiments will be also devoted to the creation of a syntetic dataset (Pierdicca et al., n.d.). Thanks to this trick, we foresee to create ad-hoc datasets, overcoming the current bottleneck of very poor anno-tated training data.
This contribution has been peer-reviewed.
ACKNOWLEDGEMENTS
Thanks to: the VR Lab of Politecnico di Torino (DISEG), for the possibility to survey the Santuario del Trompone and for their collaboration as well as the kindness of the parsons; the Ente Ge-store dei Sacri Monti and their director dott. Elena De Filippis, for the availability and the help in surveying the Sacro Monte di Ghiffa; the G4CH Lab of Politecnico di Torino (DAD) for the indoor survey of the Castello del Valentino (TO) and for the dis-posability to use the point clouds they acquired for these tests and the Eng. Giosu´e Pier Carlo Bronzino for the historical research on the Trompone Sanctuary.
REFERENCES
Ben-Shabat, Y., Lindenbaum, M. and Fischer, A., 2017. 3d point cloud classification and segmentation using 3d modified fisher vector representation for convolutional neural networks. arXiv preprint arXiv:1711.08241.
Biljecki, F., Ledoux, H. and Stoter, J., 2016. An improved lod specification for 3d building models. Computers, Environment and Urban Systems59, pp. 25–37.
Brodu, N. and Lague, D., 2012. 3d terrestrial lidar data classifi-cation of complex natural scenes using a multi-scale dimension-ality criterion: Applications in geomorphology. ISPRS Journal of Photogrammetry and Remote Sensing68, pp. 121–134. Campanaro, D. M., Landeschi, G., DellUnto, N. and Touati, A.-M. L., 2016. 3d gis for cultural heritage restoration: A white boxworkflow.Journal of Cultural Heritage18, pp. 321–332. Dai, A., Chang, A. X., Savva, M., Halber, M., Funkhouser, T. and Nießner, M., 2017. Scannet: Richly-annotated 3d reconstructions of indoor scenes. In: Proceedings of the IEEE Conference on Computer Vision and Pattern Recognition, pp. 5828–5839. Farella, E. M., 2016. 3d mapping of underground environments with a hand-held laser scanner.
Grilli, E. and Remondino, F., 2019. Classification of 3d digital heritage.Remote Sensing11(7), pp. 847.
Grilli, E., Dininno, D., Petrucci, G. and Remondino, F., 2018. From 2d to 3d supervised segmentation and classification for cul-tural heritage applications. International Archives of the Pho-togrammetry, Remote Sensing & Spatial Information Sciences. Grilli, E., Menna, F. and Remondino, F., 2017. A review of point clouds segmentation and classification algorithms. The Interna-tional Archives of Photogrammetry, Remote Sensing and Spatial Information Sciences42, pp. 339.
Hackel, T., Savinov, N., Ladicky, L., Wegner, J. D., Schindler, K. and Pollefeys, M., 2017. Semantic3d. net: A new large-scale point cloud classification benchmark. arXiv preprint arXiv:1704.03847.
He, H., Khoshelham, K. and Fraser, C., 2017. A two-step classi-fication approach to distinguishing similar objects in mobile lidar point clouds.ISPRS Annals of Photogrammetry, Remote Sensing & Spatial Information Sciences.
Klokov, R. and Lempitsky, V., 2017. Escape from cells: Deep kd-networks for the recognition of 3d point cloud models. In:
Proceedings of the IEEE International Conference on Computer Vision, pp. 863–872.
Krizhevsky, A., Sutskever, I. and Hinton, G. E., 2012. Imagenet classification with deep convolutional neural networks. In: Ad-vances in neural information processing systems, pp. 1097–1105. Liciotti, D., Paolanti, M., Pietrini, R., Frontoni, E. and Zingaretti, P., 2018. Convolutional networks for semantic heads segmenta-tion using top-view depth data in crowded environment. In:2018 24th International Conference on Pattern Recognition (ICPR), IEEE, pp. 1384–1389.
Llamas, J., Lerones, P. M., Zalama, E. and G´omez-Garc´ıa-Bermejo, J., 2016. Applying deep learning techniques to cul-tural heritage images within the inception project. In: Euro-Mediterranean Conference, Springer, pp. 25–32.
Llamas, J., M Lerones, P., Medina, R., Zalama, E. and G´omez-Garc´ıa-Bermejo, J., 2017. Classification of architectural heritage images using deep learning techniques. Applied Sciences7(10), pp. 992.
Logothetis, S., Delinasiou, A. and Stylianidis, E., 2015. Build-ing information modellBuild-ing for cultural heritage: a review. ISPRS Annals of the Photogrammetry, Remote Sensing and Spatial In-formation Sciences2(5), pp. 177.
L´opez, F. J., Lerones, P. M., Llamas, J., G´omez-Garc´ıa-Bermejo, J. and Zalama, E., 2017. A framework for using point cloud data of heritage buildings toward geometry modeling in a bim context: A case study on santa maria la real de mave church.International Journal of Architectural Heritage11(7), pp. 965–986.
Mathias, M., Martinovic, A., Weissenberg, J., Haegler, S. and Van Gool, L., 2011. Automatic architectural style recognition.
ISPRS-International Archives of the Photogrammetry, Remote Sensing and Spatial Information Sciences3816, pp. 171–176. Oses, N., Dornaika, F. and Moujahid, A., 2014. Image-based delineation and classification of built heritage masonry. Remote Sensing6(3), pp. 1863–1889.
Pierdicca, R., Mameli, M., Malinverni, E. S., Paolanti, M. and Frontoni, E., n.d. Automatic generation of point cloud synthetic dataset for historical building representation.
Qi, C. R., Su, H., Mo, K. and Guibas, L. J., 2017a. Pointnet: Deep learning on point sets for 3d classification and segmenta-tion. In: Proceedings of the IEEE Conference on Computer Vi-sion and Pattern Recognition, pp. 652–660.
Qi, C. R., Yi, L., Su, H. and Guibas, L. J., 2017b. Point-net++: Deep hierarchical feature learning on point sets in a metric space. In: Advances in Neural Information Processing Systems, pp. 5099–5108.
Quattrini, R., Pierdicca, R. and Morbidoni, C., 2017a. Knowledge-based data enrichment for hbim: Exploring high-quality models using the semantic-web.Journal of Cultural Her-itage28, pp. 129–139.
Quattrini, R., Pierdicca, R., Morbidoni, C. and Malinverni, E. S., 2017b. Conservation-oriented hbim. the bimexplorer web tool.
International Archives of the Photogrammetry, Remote Sensing & Spatial Information Sciences.
Ravanbakhsh, S., Schneider, J. and Poczos, B., 2016. Deep learn-ing with sets and point clouds.arXiv preprint arXiv:1611.04500.
Remondino, F. and Stylianidis, E., 2016. 3D recording, docu-mentation and management of cultural heritage. Vol. 2, Whittles Publishing.
Shalunts, G., Haxhimusa, Y. and Sablatnig, R., 2011. Architec-tural style classification of building facade windows. In: Interna-tional Symposium on Visual Computing, Springer, pp. 280–289. Sithole, G., 2008. Detection of bricks in a masonry wall. The International Archives of the Photogrammetry, Remote Sensing and Spatial Information Sciencespp. 1–6.
Yastikli, N., 2007. Documentation of cultural heritage using digi-tal photogrammetry and laser scanning.Journal of Cultural Her-itage8(4), pp. 423–427.
Zhang, L., Li, Z., Li, A. and Liu, F., 2018. Large-scale urban point cloud labeling and reconstruction. ISPRS journal of pho-togrammetry and remote sensing138, pp. 86–100.
Zhang, L., Song, M., Liu, X., Sun, L., Chen, C. and Bu, J., 2014. Recognizing architecture styles by hierarchical sparse coding of blocklets.Information Sciences254, pp. 141–154.
This contribution has been peer-reviewed.