Efficient Mapping of Software System Traces
to Architectural Views
Robert J. Walker, Gail C. Murphy, Jeffrey Steinbok, and Martin P. Robillard
Department of Computer Science,
University of British Columbia,
201-2366 Main Mall,
Vancouver, BC V6T 1Z4, Canada
Abstract
Information about a software system’s execution can help a developer with many tasks, including software testing, performance tuning, and program understanding. In almost all cases, this dynamic in-formation is reported in terms of source-level con-structs, such as procedures and methods. For some software engineering tasks, source-level informa-tion is not optimal because there is a wide gap be-tween the information presented (i.e., procedures) and the concepts of interest to the software devel-oper (i.e., subsystems). One way to close this gap is to allow developers to investigate the execution in-formation in terms of a higher-level, typically archi-tectural, view. In this paper, we present an encoding technique for dynamic trace information that makes it tractable and efficient to manipulate a trace from a variety of different architecture-level viewpoints. To motivate the need for the encoding technique, we describe two tools that use the technique: a vi-sualization tool and a path query tool. We present the encoding technique to enable the development of additional tools that manipulate dynamic infor-mation at a higher-level than source.
Keywords
Dynamic information, execution information, paths, software integration testing, program under-standing, performance analysis, traces, encoding.
1
Introduction
Dynamic information—information about a soft-ware system’s execution—can help a developer with many different tasks, including software test-ing [9], performance tuntest-ing [4], and program
un-derstanding [1]. Since dynamic information is col-lected either by instrumenting the code or by mod-ifying the execution environment, the information is fine-grained, reporting on such items as instruc-tions and basic blocks. To help the developer inter-pret this information, tools typically take this fine-grained information and report it in terms of con-structs that the developer is manipulating in the source code, such as procedures.
For some software engineering tasks, source-level information is not optimal because there is a wide gap between the presented information and the concepts of interest to the software developer. For example, when performing some kinds of soft-ware integration testing or when reasoning about the impact of some program changes, it may be more natural for a developer to think in terms of subsystems rather than procedures. Manually maintaining the association of source-level infor-mation to more abstract concepts such as subsys-tems is, at best, time-consuming and error-prone. For large systems, manual maintenance of the as-sociation may be intractable.
Although tools to help developers manipulate static information at a higher level than source have been available for a number of years (e.g., [10, 6]), there has been less work focused on helping developers interpret and manipulate dynamic in-formation from an abstract, typically architectural, view. Those tools that do exist take one of two ap-proaches. The first is to annotate the code to report the dynamic information in terms of the system’s architecture (or other abstract concepts); this ap-proach was taken by Sefika and colleagues in a tool built to report performance information in archi-tectural terms [17]. However, this approach limits
both the architectural views that can be used and the means by which the information is collected. The second approach is to allow information to be col-lected at a fine-grained level and then to be mapped to the architecture-level; we have focused on the latter approach [13, 19].
Specifically, in this second approach, a developer provides a mapping specification that describes how the collected information relates to the abstract level. In the two tools we briefly describe in this paper, the mapping specification consists of an or-dered list of pairs of regular expressions and names of architectural components: an entity reported in the dynamic information is considered to be part of the first architectural component whose regular ex-pression it matches. This approach allows a devel-oper to alter the mapping to view the system from different architectural perspectives. Just as the na-ture of a task can vary rapidly, so too can the per-spective appropriate to that task.
If the dynamic information of interest is a sum-mary of the execution, it is generally reasonable and efficient to map the information after it is collected. For example, if the dynamic information is a sum-mary of the number of times each procedure has been entered, each procedure would only need to be mapped once. However, when the dynamic infor-mation is in the form of a trace,1it is costly to map
each element. In our approach, for instance, we would end up matching each trace element against a potentially large set of regular expressions, result-ing in a large number of costly comparisons. Fur-thermore, if a developer wants to manipulate the dynamic information from more than one architec-tural view, it may be necessary to duplicate large traces, which may be impractical.
In this paper, we describe an encoding technique for traces that makes it tractable and efficient to interpret and manipulate a trace from a variety of architecture-level views. This support enables a de-veloper to choose the most appropriate view for the task currently being performed. We present this technique to foster discussion and to enable the in-vestigation of the usefulness of manipulating dy-namic information at a higher level.
To motivate the encoding scheme, we describe two tools we have built upon scheme to aid the anal-ysis of systems at the architecture-level (Section 2). We then present the process we use to collect traces,
1A trace is an ordered sequence of events that occurred
dur-ing the execution of a system.
our encoding scheme, our approach to mapping en-coded traces, and an analysis of the benefits of the encoding scheme (Section 3). We conclude the pa-per with a comparison to other related approaches (Section 4), and a brief discussion on why we be-lieve architecture-level traces open new opportuni-ties to develop tools to aid developers in analyzing systems (Section 5).
2
Using Architectural Traces
To investigate whether architectural traces might help developers perform software engineering tasks, two tools have been built.The first tool visualizes dynamic information collected from an object-oriented system. Two small case studies have been conducted on the use of this tool. These studies provided some positive indications that this tool may help developers tune the performance of their system. A brief overview of this tool is provided in Section 2.1; further details are available elsewhere [19].
The second tool supports the extraction of paths between architectural components from trace data. We have not yet performed any studies on the use of this tool beyond applying it to some of the sys-tems we have developed. We describe briefly how this tool might help support integration testing ac-tivities.
2.1 Visualization Tool
Our visualization tool allows a developer to ana-lyze the execution of a system off-line. The visu-alization consists of a temporally-ordered series of pictures, each detailing information about a corre-sponding point in the execution of the system be-ing analyzed, and a summary of the execution to that point. Rather than displaying events between low-level entities in the source code, such as calls between particular methods or objects, events are mapped to architecture-level entities as chosen by the developer. Using the visualization tool, a devel-oper can navigate across the trace, either one event at a time or as an animation, seeing how objects mapped to the architectural entities call each other, as well as where objects are allocated and deallo-cated.
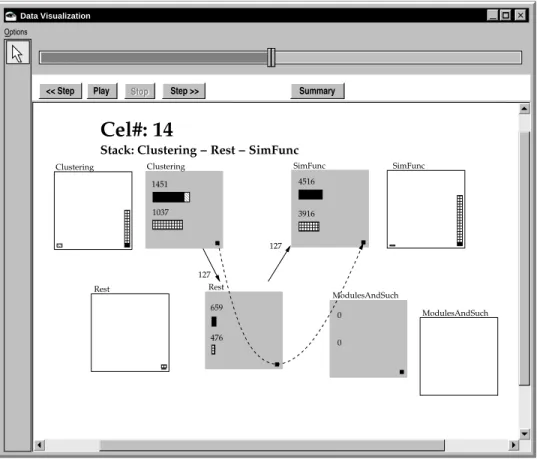
To clarify the architectural views provided by our visualization tool, Figure 1 shows a screen snap-shot of the tool in action. This snapsnap-shot shows a point about halfway through the execution of an
ModulesAndSuch
Stop Step >> Play
<< Step Stop Summary
0 0 1 1 00 11 00001111 0 0 0 0 0 0 1 1 1 1 1 1 00 11 0 0 1 1 0 1 00 00 00 00 00 11 11 11 11 11 0000 1111 00001111 Options 1037 3916 476 0 0 127 127 659 4516
Stack: Clustering − Rest − SimFunc
SimFunc Rest Rest Clustering ModulesAndSuch SimFunc 1451
Cel#: 14
Clustering Data VisualizationFigure 1: Architecture-level Visualization
implementation of a hierarchical agglomerative re-verse engineering algorithm [16]. This algorithm automatically clusters entities, such as procedures in a C program, based on a similarity function to determine a subsystem organization for the sys-tem. In the visualization, the classes implementing the algorithm are mapped to four architectural en-tities (the grey squares): Clustering, representing the class performing the clustering analysis; Sim-Func, representing the class containing methods for computing the similarity function; ModulesAnd-Such, representing the classes denoting the mod-ules whose similarity is being compared; andRest, representing all other classes involved in the algo-rithm. The solid arrows show the calls between ob-jects mapped to the separate architectural entities. The dashed arrow represents the current call stack. Object allocation and deallocation information is shown in two ways: the total number of objects al-located and dealal-located per architectural entity are shown within each grey square; and, the histograms provide a view on the memory usage over time by
an architectural entity. This particular visualization was used in a case study that discovered the source of an execution problem in the implementation of the reverse engineering algorithm; further details about the case study are available elsewhere [19].
The software developer using the visualization tool is in control of the particular architectural view used. Figure 2 shows the specification used to map the lower-level source code entities to the architec-tural entities chosen for the reverse engineering sys-tem. This specification uses regular expressions to identify classes in the system to map to a particular architectural entity. For instance, the first line states that any class namedArchClusteringAnalysis is to be associated with the architectural entity named Clustering. This association means that any event associated with the class ArchClusteringAnalysis will be associated with theClustering entity in the visualization. The last line indicates that any class whose name starts with the stringSchwanke is to be associated with theRest architectural entity.
in-category Clustering class "ArchClusteringAnalysis" category ModulesAndSuch class "Arch(Procedure|Symbol)" category SimFunc class "ArchSimFunc" category Rest class "Schwanke.*"
Figure 2: Map Specification for Figure 1
formation in perspective, providing insight into dif-ferent kinds of performance problems than might be evident with a standard profiler. For example, a de-veloper may be able to more easily determine when a subsystem is using more memory than expected and why that is happening.
A key property of our visualization tool is its de-pendence on fast, iterated mapping, or abstraction, to the higher, typically architectural, level. An abil-ity to quickly change the architectural view being used is important for two reasons. First, a devel-oper assigned to a task, such as tracking down a per-formance problem, may not initially have a good idea of how the system is designed. This situation can arise when an organization designates perfor-mance experts for solving such problems. Our tool allows the developer to posit a higher-level design for the system which might provide a useful view, and then to iterate that view as driven by the task. Second, developers performing different tasks may benefit from different views. For example, the ar-chitectural entities shown in Figure 1 were helpful in tracking down a caching problem with the im-plementation of the reverse engineering algorithm. However, a different view is likely needed to in-vestigate the performance of the input subsystem. Yet another view, or a set of views, might be bet-ter for helping a new developer understand the op-eration of the program. A developer can easily vi-sualize the system from multiple viewpoints at one time by running the visualization tool with different map specifications. This approach of using views that are “good-enough” for the task at hand has been successful in previous work on software reflexion models [12, 13].
If the process of specifying a map and perform-ing the abstraction is time-consumperform-ing, the usability of our tool suffers markedly. An efficient means of performing the mapping was thus needed, leading
to the development of the encoding technique de-scribed in Section 3.
2.2 Path Query Tool
Consider a software developer faced with the task of developing integration test cases for a large sys-tem. Hopefully, the developer will have access to various documents describing the system design and implementation that can be used to determine which cases need to be tested. The developer would then proceed to determine inputs and configurations to execute the desired cases. However, how can the developer determine if a particular test case, once executed, does indeed exercise the paths of interest? To the best of our knowledge, little support is available to help software developers answer this question. Existing coverage tools report informa-tion about such items as basic blocks, line, func-tions, files, directories, and sometimes, libraries and applications.2A developer might use this
cov-erage information to gauge which entry points to a subsystem were being exercised, but from this formation it would be difficult to determine path in-formation.
Path profile tools can provide more useful in-formation. Although early path profile tools were limited to reporting intra-procedural paths [2], a more recent tool reports inter-procedural path pro-files [8]. These inter-procedural path propro-files rep-resent a summary of the execution that could help determine path coverage. Summary information as found in these profiles, however, may not always be sufficient. Rather, it might be helpful to understand the relative ordering of paths in an execution and to have, as part of the path, additional events such as object allocations. For instance, in an object-oriented program, it may be important to have one path execute prior to another path to appropriately set the state of a series of objects.
To investigate whether detailed path information might help a software developer reason about a set of integration test cases, we have developed a path query tool that operates on trace data and that sup-ports queries at the architecture-level. Given a trace and a mapping specification (similar to that shown in Figure 2) describing how source-level compo-nents relate to architectural compocompo-nents, the tool will extract all paths starting in one named archi-tectural component and ending with an entry to a
2For example, Rational’s PureCoverage product can report
Controller
Parser AST
Type System
Jex Loader
Figure 3: Jex Architecture
second named architectural component. The paths extracted contain both call information and object allocation and deallocation information. Sub-paths are also reported.
To try out this tool, we applied it to analyze some test cases for the Jex static analysis tool [15]. Jex analyzes the flow of exceptions in JavaTM
programs and consists of over 100 classes. Jex is comprised of five main architectural entities: a Controller, a Parser, a Type system, an AST, and a Loader for reading intermediate files (Figure 3). In our trial use of the path query tool, we were interested in the paths exercised between the AST and the Loader component by three test cases. We formulated the map specification shown in Figure 4 to describe the relationship between the Jex source code and the ar-chitectural entities and then ran the tool, providing the map and the trace, and requesting the paths be-tween the AST and the Loader. The path query tool returned 534 paths. We analyzed these paths to de-termine if they were indeed the paths intended to be exercised. Our analysis showed that one of the test cases exercises a greater variety of paths than the other two test cases. Specifically, one case ensures that the Loader component is called in three dif-ferent situations: while processing method invoca-tion expressions, while processingthrow expres-sions, and while processing other Java expressions. The other test cases focus only on the latter situa-tion. This information may be useful to help assess and select test cases. Furthermore, one might care about invoking the Loader from a method invoca-tion prior to athrowexpression; the path query tool can help you determine if a test case meets this criterion.
The ability of our tool to understand the mapping between the source and architectural components makes it easy for a software developer to extract the paths of interest. Instead of having to translate the questions of interest for the software integra-tion testing task, a developer can express the
ques-category Parser class "jex\.parser.JavaParser.*" category Parser class "jex\.parser.JJTJavaParser.*" category Parser class "jex\.parser.JJCalls.*" category Parser class "jex\.parser.Token.*" category Parser class "jex\.parser.ParseException" category AST class ".*AST.*" category Type class "jex\.type\.TypeSystem.*" category Type class "jex\.type\.ClassInfo" category rest class "jex\.file\.ASCII_CharStream" category Loader class "jex\.file.*" category Controller class "jex\.Analyzer" category Parser class "jex\.type\.Resolver" category rest class .*
Figure 4: Map Specification for Jex
tions directly in terms of the components being in-tegrated. Once relevant paths have been extracted using this approach, a variety of further analyses can be performed. For instance, the paths could be viewed using a browser similar to the Hot Path Browser by Ball and colleagues [3], or could be an-alyzed using concept analysis as also described by Ball [1].3
As with our visualization tool, the developer may need to iterate the mapping specification to refine it to answer the test case question of interest. For in-stance, as the developer learns about the different possible courses of execution, the developer may wish to refine subsystem boundaries. As before, then, fast, iterated abstraction is a must here, hence the need for the encoding technique described in Section 3.
3
Mapping Traces
Both our visualization and our path query tool rely on trace information collected from a program’s
ex-3Our trace information does include timestamps so the
ecution. For the object-oriented systems we have been studying, these traces are comprised of in-formation about message sends, object allocations, and object deallocations. This information can be collected in one of three ways: by instrumenting source files, by instrumenting object files, or by al-tering the execution environment.4 The framework
we have developed encodes events of interest that occur during execution in the format described be-low.
In this section, we describe our trace representa-tion. First, we describe the events we are recording and how we encode these events in the trace rep-resentation. Next, we describe how the encoding facilitates the abstraction and summarization of the events. Finally, we describe the benefits of using this encoding scheme.
3.1 Events
The traces we are collecting describe the execution of an object-oriented system. Traces compose the following types of events:
class method entry and exit events,
instance method entry and exit events,
object allocation and deallocation events, and
thread start and stop events.
Each event carries particular information rele-vant to the system event it represents. Class method entry and exit events record the name of the class and the name of the method that was entered or ex-ited (class and method identifiers). Instance method entry and exit events record an additional identifier representing the object on which the method was called. Object allocation and deallocation events record a class identifier and an object identifier. All of these event types also record the name of the thread executing the event (thread identifier). Fi-nally, the thread start and stop events record a thread identifier.
4Our current set of tools works on Java
pro-grams. We are using AspectJTM from Xerox PARC
(http://www.aspectj.org/) to instrument Java source, and the Jikes Bytecode Toolkit from IBM Re-search (http://www.alphaworks.ibm.com/) to instrument bytecode. We have also created a translator to convert IBM Research’s Jinsight traces (http://www.alphaworks.ibm.com/), which are produced by a JVMPI implementation, to our trace format.
3.2 Encoding Events
As with any encoding scheme, the key lies in de-termining the patterns that can be used to encode the information of interest. Since our goal was to abstract each event, we needed to determine how to support the abstraction operation efficiently. The abstraction operation consists of testing an event to see whether it meets some set of properties associ-ated with the description of an abstract item. For instance, in the tools described above, the associa-tion between an event and an abstract item consists of a set of regular expressions; an event is associ-ated with the abstract item if it matches one of the regular expressions.
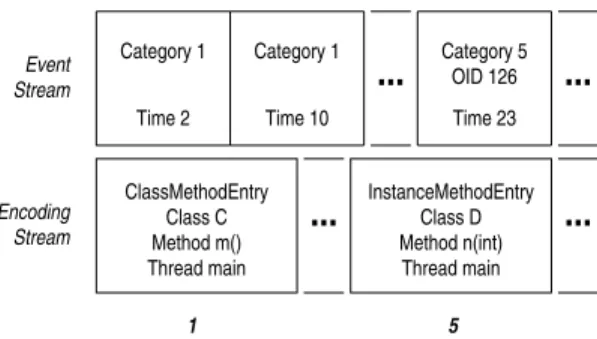
Our encoding scheme meets this goal by cate-gorizing events and then encoding the categories. Specifically, we record traces in two streams: an encoding stream, and an event stream. The en-coding stream consists of a sequence of records, each containing information about a given primi-tive category; primiprimi-tive categories cannot be subdi-vided. The event stream also consists of a sequence of records; in this stream, each record contains an index to a primitive category within the encoding stream, plus some additional information that de-pends on the specific type of event represented.
A primitive category consists of a unique combi-nation of class identifier, method identifier, thread identifier, and event type. Primitive categories do not include object identifier information because, in general, the number of events associated with a given object will be small, and therefore, the num-ber of primitive categories with which we would have to deal would increase dramatically. Events that contain object identifiers record them within the event stream.
Figure 5 demonstrates this encoding scheme. The event stream starts with a ClassMethod-EntryEvent. The details about this event, such as the class and method that were entered and the thread in which the method was executed, are recorded on the encoding stream. The record on the event stream specifies the ordinal number of the full information on the event encoding stream. When the second ClassMethodEntryEvent occurs, it is a call to the same class and method in the same thread as the first event; therefore, we reference the same encoded primitive category record, and nothing new is written to the encoding stream. The InstanceMethodEntryEvent that occurs later in the event stream is encoded
sim-Category 1 Encoding Stream Event Stream Category 1 Category 5 OID 126
...
ClassMethodEntry Class C Method m() Thread main InstanceMethodEntry Method n(int) Thread main Class D...
...
...
5 1Time 2 Time 10 Time 23
Figure 5: Encoding Scheme
ilarly to the first event. Unlike the ClassMeth-odEntryEvent, the record on the event stream for the entry of an instance method includes infor-mation about the object on which the method was invoked.
3.3 Abstracting Events
Interpreting a trace at an abstract level requires ap-plying an abstraction operation to each event in the trace. Encoding the event stream facilitates this interpretation. Instead of having to apply the ab-straction operation against each event, the abstrac-tion operaabstrac-tion need only be applied against each record in the encoding stream, i.e., each primitive category. The architecture-level entities to which the primitive categories are mapped are termed ab-stract categories.
For each tool, the developer using it specifies a mapping from a set of primitive categories to an abstract category through a partial, ordered speci-fication of matching criteria. For example, in Fig-ure 2, the developer specified that any events refer-ring to the class ArchClusteringAnalysis should be mapped to theClustering abstract cate-gory. This means that each encoding stream record has its class identifier (if any) compared against this matching criterion. If it matches, the event is placed in theClustering abstract category; if not, the event is then compared against the next mapping crite-rion. If the event matches none of the criteria, it is not mapped, and is not used further.
The abstraction operation produces an array of values: the primitive category number serves as an index into the array, which stores the abstract category to which each primitive category is to be mapped. In the example in Figure 2, we might have had hundreds of primitive categories, but only four abstract categories, so our array would have been
(identically) hundreds of elements in size, but each element would reference an abstract category as a number from 1 to 4, or 0 if it was not mapped at all. The larger event stream can then be traversed, and each individual event, which refers to its primitive category, can be mapped to the appropriate abstract category via anO (1)lookup in this array.
3.4 Summarizing Events
Software developers can also benefit from the sum-marization of events: sumsum-marization abstracts the events over time. For example, as described earlier in this paper, path profile tools summarize the paths taken during an execution [2, 8].
Summarization and abstraction of events are or-thogonal techniques. Although each is useful on its own, their combination can provide further ware analysis support. For example, to help soft-ware developers understand a trace, our visual-ization tool summarizes, throughout the trace, the number of objects allocated and deallocated that be-long to each abstract category.
Our encoding scheme facilitates the combination of these techniques by allowing the most costly part of summarization to occur once, prior to abstrac-tion. Summarization is performed with respect to individual primitive categories and recorded. Later, these recorded summaries can be abstracted by ap-plying the abstraction operation to the primitive categories in the summary, and then, for each ab-stract category, aggregating the summarizations of the primitive categories that map to it.5 Since many
events may map to a primitive category, this two-step process allows the abstraction to be altered much more cheaply than re-summarizing in a sin-gle step would.
For example, if we found that 32 instances of Stringand 14 instances ofStringBufferhad been allocated during a trace and the architectural view called for allStringandStringBuffer events to be grouped together into theStringOp abstract category, we would simply add the two counts to find that 46 objects were allocated in the trace that mapped toStringOp.
Without the notion of indivisible, primitive cate-gories, as found in our encoding scheme, each event could be mapped arbitrarily to an abstract category. This would prevent any partial summarization from
5This aggregative scheme assumes that the total
summariza-tion in quessummariza-tion is describable solely as a funcsummariza-tion of abstract cat-egory.
being performed prior to abstraction. Since sum-marization over a trace requires processing of the entire trace, if the architectural view of the system is to be changed frequently, as it is in our model, sum-marization can be a prohibitively expensive opera-tion.
3.5 Savings
The encoding strategy is only an advantage if two conditions are met: (1) primitive category informa-tion tends to be repeated in the trace, and (2) the ab-straction operation is costly to perform.
The first condition is important since we will only gain an advantage if the encoding stream is smaller than the event stream. This condition will typically hold: the number of events produced when running a system is large compared with the number of classes and methods in a system, upon which the encoding scheme is based. The total number of encodings possible for a given system is a small multiplier of the product of the number of classes and the number of methods and the num-ber of threads. As one example, for the Jex tool de-scribed in Section 2, Jex produced a trace compos-ing 510
5
events as it analyzed one simple Java class. Encoding this trace results in only 725 prim-itive categories.
The second condition matters because all events in the trace still require processing. When the ab-straction operation is cheap to perform, it may as well be applied as the events are traversed. How-ever, when the abstraction operation is expensive, it is an advantage to apply it only to the much smaller number of encodings. At first glance, our regu-lar expression-based comparison may appear cheap since an individual regular expression comparison is not necessarily costly. Although we do not yet have much experience with applying the reg-ular expression-based operation against trace data, when applying it to static data collected from the source code of Microsoft Excel to support an ex-perimental reengineering task, the map specifica-tion grew to be large, over 1000 regular expres-sions in total, leading to a large number of com-parisons [11]. Obviously in such a case, compar-ing against the primitive categories rather than the events results in a more efficient tool. This savings also provides an opportunity to try out more expen-sive abstraction operations, such as operations in-volving some inference.
To clarify the savings of the encoding scheme,
consider that the cost of abstracting a trace is on the order of P e i p i +a i where e i is the number
of events belonging to primitive category i, p i is
the cost of identifying that a given event belongs to primitive categoryi, anda
iis the cost of
apply-ing the abstraction operation to primitive categoryi.
Without the encoding scheme, we can still consider the set of events that would have belonged to prim-itive categoryi, for the sake of our analysis. In the
absence of the encoding, the abstraction operation has to be performed on each event instead of once for the entire primitive category for a total cost of
P a
i e
i.
6 The savings in using the encoding scheme
is on the order of P (a i ?p i )e i ?a i. The encoding
scheme will thus be an advantage when the condi-tions above are met.
4
Related Work
Program trace information has been used for many years and a number of techniques have been devel-oped for collecting and storing it [7]. These efforts have focused on the efficient collection and rep-resentation of detailed information about the pro-gram, such as the instructions executed and the data locations referenced. The code for a system is ana-lyzed before execution to determine the minimum amount of trace information that needs to be col-lected: a full trace can later be generated from the collected information. For example, only the first statement in a basic block needs to be recorded as being executed to know that all statements in the block were executed. These detailed traces help support the design of memory systems and help guide the behaviour of parallelizing compilers, amongst other uses.
In comparison, the traces we use support soft-ware engineering activities. We can support these activities using less detailed traces. For the object-oriented systems we have been studying, traces are comprised of information about message sends, ob-ject allocations, and obob-ject deallocations. Although this information is already at a higher-level than program instructions, we believe software devel-opers dealing with large systems can benefit from further abstraction of the information. Supporting the efficient abstraction of this information requires
6Abstracting an event directly to an abstract category will
cost the same as abstracting an event from a primitive category. The actual abstraction process is a regular expression matching that could be performed on either events or primitive category records identically.
a different approach to encoding than is typically used for the more detailed program traces. We need to exploit patterns of individual events rather than sequences of events.
There are two other approaches of which we are aware that explicitly support the abstraction of trace information to the architecture level. Sefika and colleagues have built a tool that provides a vari-ety of views of dynamic information correlated to the architecture-level, including bar charts, space filling diagrams, affinity diagrams, and ternary di-agrams [17]. In their on-line system, instrumen-tation is built into the the architecture of the sys-tem of interest; queries are used to turn various in-struments on and off as desired. One advantage of this approach is that the instrumentation run-time can take advantage of its architectural knowledge to pre-aggregate information to be displayed. In com-parison, our trace and encoding approach makes it easier to gather trace information from an arbitrary system and then to summarize and to manipulate the information through an architectural view cho-sen for a particular task.
Grundy and Hosking have built the SoftArch tool that enables a developer to describe the architec-ture of an object-oriented system and how it refines down to a set of classes [5]. When the system ex-ecutes, events associated with classes can then be remapped to the architectural view using the refine-ment links. Grundy and Hosking do not describe the performance characteristics of their approach. The SoftArch tool could potentially benefit from the encoding scheme described in this paper.
5
Summary
Can the abstraction and summarization of trace information enable new software analysis ap-proaches? Can it enhance existing approaches? Can it help software developers perform software engineering tasks more effectively?
There are no definitive answers to these questions—yet. To answer these questions, it is necessary to have the base technology to abstract and summarize traces efficiently. This technology allows tools to be built that can be applied to realistic systems and realistic scenarios.
This paper has presented an encoding scheme that provides this base technology. Traces com-posed of basic object-oriented execution events may be abstracted to different architectural views.
Trace information may also be intermittently sum-marized and then abstracted. There is nothing in-herent in our encoding scheme that limits its ap-plication to object-oriented execution events, such as calls between methods. The encoding scheme could also be applied to encode events exchanged between components, interactions between remote processes, and other similar execution events that occur more than once.
To date, we have only limited experience with applying this technology. However, we believe it holds promise for increasing the usefulness of dy-namic information in software engineering tools and techniques. As an example, in addition to the visualization and path query tools we have built, the approach may enable the determination of ar-chitectural dependences between pieces of existing systems [18]. This information could enable a new way to verify that a system adheres to its architec-tural goals.
Acknowledgments
This research was funded in part by the Natural Sci-ences and Engineering Research Council of Canada (NSERC) and in part by the Consortium for Soft-ware Engineering Research (CSER) in cooperation with Object Technology International, Inc. “As-pectJ” is a trademark of Xerox Corporation. “Java” is a trademark of Sun Microsystems.
About the Authors
Robert J. Walker is a Ph.D. candidate in the De-partment of Computer Science at the University of British Columbia. His thesis work concerns the use of dynamic contextual information for soft-ware evolution and reuse. He may be contacted at [email protected].
Gail C. Murphy is an assistant professor in the Department of Computer Science at the Univer-sity of British Columbia. Her research interests are in software evolution, software design, and source code analysis. She may be contacted at [email protected].
Jeffrey Steinbok is a recent graduate from the University of British Columbia. He currently works at Microsoft. He may be contacted at [email protected].
Martin P. Robillard is a Ph.D. student in the De-partment of Computer Science at the University of British Columbia. His research interests include
program understanding, evolution, and modulariza-tion. He may be contacted at [email protected].
References
[1] Thomas Ball. The concept of dynamic anal-ysis. In Nierstrasz and Lemoine [14], pages 216–234.
[2] Thomas Ball and James R. Larus. Efficient path profiling. In Proceedings of the 29th An-nual International Symposium on Microarchi-tecture, pages 46–57, Paris, France, 2–4 De-cember 1996.
[3] Thomas Ball, James R. Larus, and Genevieve Rosay. Analyzing path profiles with the Hot Path Browser. In Workshop on Profile and Feedback-Directed Compi-lation, Paris, France, 13 October 1998.
http://www.research.microsoft.com/
tball/abstracts.html.
[4] Susan L. Graham, Peter B. Kessler, and Mar-shall K. McKusick. gprof: A call graph execution profiler. In Proceedings of the SIGPLAN ’82 Sym-posium on Compiler Construction, pages 120–126, Boston, Massachusetts, USA, 23–25 June 1982. [5] John Grundy and John Hosking. High-level static
and dynamic visualisation of software architec-tures. In Proceedings of 2000 IEEE Symposium on Visual Languages, 2000. To appear.
[6] David R. Harris, Howard B. Reubenstein, and Alexander S. Yeh. Reverse engineering to the ar-chitectural level. In Proceedings of the 17th In-ternational Conference on Software Engineering, pages 186–195, New York, NY, April 1995. ACM. [7] James R. Larus. Efficient program tracing.
Com-puter, 26(5):52–61, 1993.
[8] James R. Larus. Whole program paths. In Proceed-ings of the ACM SIGPLAN ’99 Conference on Pro-gramming Language Design and Implementation, pages 259–269, Atlanta, Georgia, USA, 1–4 May 1999.
[9] Edward F. Miller, Jr. Program testing: Art meets theory. Computer, 10(7):42–51, July 1977. [10] Hausi A. M¨uller and Karl Klashinsky. Rigi—a
sys-tem for programming in-the-large. In Proceedings of the 10th International Conference on Software Engineering, pages 80–87, Singapore, 11–15 April 1988.
[11] Gail C. Murphy and David Notkin. Reengineering with reflexion models: A case study. Computer, 30(8):29–36, August 1997.
[12] Gail C. Murphy, David Notkin, and Kevin Sulli-van. Software Reflexion Models: Bridging the Gap between Source and High-Level Models. In Proceedings of SIGSOFT’95 Third ACM SIGSOFT Symposium on the Foundations of Software En-gineering, pages 18–28, New York, NY, October 1995. ACM.
[13] Gail C. Murphy, David Notkin, and Kevin Sulli-van. Software reflexion models: Bridging the gap between design and implementation. IEEE Trans-actions on Software Engineering, 2000. To appear. [14] Oscar Nierstrasz and Michel Lemoine, edi-tors. ESEC/FSE ’99, volume 1687 of Lecture Notes in Computer Science, Toulouse, France, 6–10 September 1999. 7th European Software Engineering Conference held jointly with the 7th ACM SIGSOFT Symposium on the Foundations of Software Engineering.
[15] Martin P. Robillard and Gail C. Murphy. Analyzing exception flow in JavaTM
programs. In Nierstrasz and Lemoine [14], pages 322–337.
[16] Robert W. Schwanke. An intelligent tool for re-engineering software modularity. In Proceedings of the 13th International Conference on Software Engineering, pages 83–92, Austin, Texas, USA, 13–17 May 1991.
[17] Mohlalefi Sefika, Aamod Sane, and Roy H. Camp-bell. Architecture-oriented visualization. In Proceedings of Object-oriented Programming Sys-tems, Languages, and Applications Conferences, pages 389–405, 1996.
[18] Judith A. Stafford and Alexander L. Wolf. Architecture-level dependence analysis in support of software maintenance. In Proceedings of the Third International Workshop on Software Architecture, pages 129–132, Orlando, FL, 1-5 December 1998. ACM.
[19] Robert J. Walker, Gail C. Murphy, Bjorn Freeman-Benson, Darin Wright, Darin Swanson, and Jeremy Isaak. Visualizing dynamic software system information through high-level models. In Proceedings of the ACM Conference on Object-Oriented Programming, Systems, Languages, and Applications, pages 271–283, Vancouver, British Columbia, Canada, 18–22 October 1998.