PAPER
Variable Data-Flow Graph for Lightweight Program Slicing and
Visualization
Yu KASHIMA†a),Nonmember, Takashi ISHIO†b),Member, Shogo ETSUDA†,Nonmember,
andKatsuro INOUE†c),Fellow
SUMMARY To understand the behavior of a program, developers of-ten need to read source code fragments in various modules. System-dependence-graph-based (SDG) program slicing is a good candidate for supporting the investigation of data-flow paths among modules, as SDG is capable of showing the data-dependence of focused program elements. However, this technique has two problems. First, constructing SDG re-quires heavyweight analysis, so SDG is not suitable for daily uses. Sec-ond, the results of SDG-based program slicing are difficult to visualize, as they contain many vertices. In this research, we proposed variable data-flow graphs (VDFG) for use in program slicing techniques. In contrast to SDG, VDFG is created by lightweight analysis because several approxima-tions are used. Furthermore, we propose using the fractal value to visualize VDFG-based program slice in order to reduce the graph complexity for vi-sualization purposes. We performed three experiments that demonstrate the accuracy of VDFG program slicing with fractal value, the size of a visual-ized program slice, and effectiveness of our tool for source code reading. key words: Static Analysis, Program Slicing, Variable Data-Flow Graph, Visualization
1. Introduction
Many software developers spend much of their time investi-gating source code [1]. Program understanding can be diffi -cult in part because a single functionality is typically imple-mented by a complex interaction of modules, e.g. methods and classes in Java. To investigate an interaction of mod-ules, developers often search code fragments related to their current task, using explicit dependencies including control-flow and data-control-flow among modules [2].
System-dependence-graph (SDG)-based program slic-ing technique [3] helps developers investigate data-flow paths. Program slicing on SDG extracts data and control-dependences related to a particular program point. This is typically sufficient information for developers to understand the program. However, there are two problems with us-ing SDG-based program slicus-ing on a regular basis. First, making SDGs requires heavyweight analyses, e.g. points-to analysis and side effect analysis. Although a developer’s typical working session time is between 30 minutes and two hours, making SDGs often consumes more than single ses-sion[4]. Second, existing research [5] shows that a straight
Manuscript received January 1, 2011. Manuscript revised January 1, 2011.
†
Graduate School of Information Science and Technology, Os-aka University, Yamadaoka, Suita-shi, OsOs-aka, 565-0871, Japan
a) E-mail: [email protected] b) E-mail: [email protected] c) E-mail: [email protected]
DOI: 10.1587/transinf.E0.D.1
graph visualization of program slices on an SDG for a typi-cal program is too large and too complicated for a human to understand. Therefore, the authors in [5] proposed a visual-ization method based on text highlighting in a source code editor. However, this visualization lost the direction, or edge information, of the control and data dependencies.
In this paper, we propose variable data-flow graph (VDFG)-based program slicing technique as well as robust methods for its visualization. VDFG represents approxi-mated control and data-dependencies among formal param-eters, actual arguments of method invocation, local vari-ables, predicate and field accesses.
In order to create VDFGs using lightweight analysis, VDFG is designed to flow-, object-, and context-insensitive. Flow-insensitivity is caused by the fact that VDFG simply connects data-dependence edges from all assignment state-ments of a variable to all reference statestate-ments of the same variable. Object-insensitivity is caused by the fact that a field is represented by a vertex that is distinguished by the field’s fully qualified name, but is not distinguished by a receiver object. Finally, context-insensitivity arises due to the backward/forward traversal method of program slicing. Owing to these insensitivities, constructing VDFG requires abstract syntax trees or byte code, and class hierarchy in-formation at minimum, but not intensive analyses such as points-to analysis and side effect analysis.
We visualize a program slice on a VDFG in the form of graph. In order to reduce the complexity of the visualized slice, we used thefractal value[6]. Fractal value, which cor-responds to the weight of a vertex, is reduced in accordance with the number of the siblings of the vertex. By filtering vertices using fractal value, we can automatically prevent visualization at vertices that have a large number of edges. As a result, a human operator will be capable of reading and comprehending the visualized graph. Naturally, edges excluded from visualization may include important one for program comprehension. However, in our experience, those edges often include many infeasible paths because of insen-sitivities employed by VDFG. We designed that the edges are visualized only when a human operator wants to investi-gate them.
The implementation of our visualizer for VDFG is an interactive graph viewer integrated into Eclipse. When a mouse button is clicked on a method name or a field name in a text editor, a program slice of the selected entity are visualized in the graph viewer.
We performed three experiments to evaluate our pro-posed program slicing and graph-viewing techniques. The first experiment compared our technique toImproved slicer
[7], which is the state-of-the-art program slicing technique. Although program slices from VDFGs without fractal val-ues will include many imprecise results, many of the pro-gram slices with fractal value are precise. These results indi-cate that our lightweight technique is sufficiently precise for visualization. The second experiment measured the size of a slice with fractal value. The results show that dozens of ver-tices are included in a slice from any applications, and that a slice includes the dependencies spanning several methods, on average. The third experiment evaluated the effectiveness of our visualization tool for program understanding as well as the performance of the tool. In this experiment, we as-signed two program understanding tasks to 16 participants using JEdit, a Java text editor. The results demonstrate that participants using Eclipse enhanced with our visualization tool were able to better investigate data-flow paths than the participants using Eclipse without our visualization tool.
This paper is an extended version of [8], and has been combined two additional contributions:
• Compare the precision of our proposed technique and state of the art program slicing technique. The preci-sion of the program slice using with VDFG and fractal value was surplysingly high.
• Measure the size of the visualized program slice using with VDFG and filtering by fractal values. The number of vertices in a slice is surpressed to dozens, besides a slice may include a distant vertex from criterion of program slice.
These contributions correspond to the first and the second experiments, respectively.
The remainder of the paper is structured as follows. In Section 2, we present related work. In Section 3, we de-scribe the concept of VDFG, the VDFG-based program slic-ing techniques, and its visualization. The results of the three experiments are shown in Section 4, and we present conclu-sions and future research in Section 5.
2. Related Work
2.1 Program Slicing
Program slicing [9] is a well-known technique used to ex-tract program slices, or a set of program statements related to slicing criteria selected by a developer. A program slice is computed by backward traversal of an SDG, based on a particular set of slicing criteria [3].
SDGs are directed graphs whose vertices represent the statements of a program. Its directed edges represent data and control dependencies. A data dependency is a relation between an assignment and a reference of a variable. A data dependency from statements1to statements2exists if all of the following conditions are satisfied:
1. s1assigns a value tov
2. s2refers tov
3. At least one execution path froms1tos2without re-defining v exists.
The third condition depends on a control-flow graph of a method containings1ands2.
A control dependency is a relation between a condi-tional statement and a control statement. A control depen-dency from statements1to statements2exists if:
1. s1is a conditional predicate
2. s1determines whethers2is executed or not.
The definition of control dependency relations also depends on a control-flow graph.
Program slicing can be effectively used to investigate the detailed behavior of a program for debugging [10]. SDGs are also employed to support source code reading, e.g., to locate features in source code [11] and to search sim-ilar code fragments [12].
Although SDGs include sufficient data-flow informa-tion for developers, there are two remaining challenges to applying program slicing to program understanding tasks. First, making SDGs requires several heavyweight prelim-inary analyses such as a points-to analysis and side effect analysis. In the present study, we use a flow, context and object-insensitive analysis to make VDFGs that do not re-quire heavyweight preliminary analyses.
Secondly, visualizing an SDG or a program slice for a typical program is difficult because of the large number of vertices [5]. In the study of [5], Krinke has used the follow-ing two techniques:
• Visualize control/data dependences in a program slice by text highlighting in the source code editor, without using graph representation. This drops edge directional information, but enable to visualize a program slice hiding a too large SDG.
• Employdistance-limited slicingtechnique for visualiz-ing locality since user probably interests near instruc-tions from the criteria than far away instrucinstruc-tions. The distance of instructions from the criteria is shown by highlighting color. However, if a vertex near crite-rion may connects to a lot of vertices, the size of the distance-limited slice may not be reduced significantly. On the contrary, we have used a graph representation in or-der to visualize the directional information of edges in an SDG. The issue of the explosion of the number of vertices and edges has been addressed byfractal value. Fractal value [6] is a weight of a vertex decided as the fractal value of the parent vertex per the number of sibling vertices. Our ap-proach filter out vertices which fractal values are smaller than a threshold. As a result, even if a vertex near criterion connects to many vertices, the size of the visualized slice will be suppressed as much as readable size.
2.2 Lightweight Analysis
anal-ysis. Previously, J´asz [13] proposed an alternative ap-proximation — Static Execute After/Before dependencies. That approach is a control-flow-based approximation with-out data-flow analysis, while our approach performs approx-imated data and control flow analysis. The weak point of J´asz’ approach is a handling loop that connects control paths among all functions, e.g., a message loop in the GUI. Our analysis can extract data dependencies in such applications. Nguyen [14] has proposed a flow-insensitive data-flow analysis for mining source code patterns. The analysis con-structs a directed acyclic graph namedgroumwhose nodes represent method calls and field accesses in a Java method. A data dependency edge between two nodes is generated if the two nodes share at least one common variable. Note that groum is an intra-procedural representation to extract a coding pattern in a method. On the contrary, our approach aims to visualize inter-procedural information, e.g. data-dependencies among methods.
2.3 Software visualization for Program Comprehension
Our approach along with several tools is able to visualize software for program comprehension, starting with the im-plementation detail. The relationships among source code fragments should be visualized so that developers can select an appropriate source code location to investigate.
Code Bubbles [15] is a unified viewer for source code and its related documents. The tool focuses on the user in-terface based on the bubble metaphor. The tool displays a number of source code fragments and their method call re-lationships so that developers can track the progress of their particular investigation. On the other hand, the tool does not analyze the implementation details of each code frag-ment. To investigate data-flow paths, developers must there-fore open and read source code fragments. Our research visualizes summarized dependencies in source code so that developers can efficiently choose source code fragments to be investigated and ignore irrelevant source code fragments. A visualization tool should reflect the structure of source code fragments. DA4Java [16] shows an overview of Java source code as a nested graph. Vertices in the graph represent source code entities that correspond to packages, classes, methods, and fields. Edges in the graph represent class inheritance/subtyping, method calls and field accesses. DA4Java represents a class as a node that contains vertices representing methods as well as fields belonging to that class. We make use of nested visualization as a technique for graph visualization.
Whyline [17] is a debug support tool. This tool an-swers developer’s questions of debugging which are “why?” or “why not?” about program bug. For example, if a devel-oper questions “Why this method was executed in the situ-ations?”, Whyline displays the causality of the method in-vocation, such as conditions, data flows, and control flows. Whyline uses both static analysis and dynamic analysis, while our approach uses static analysis.
3. VDFG-based Slicing Technique
3.1 VDFG
We have defined VDFG as a directed graph that represents data dependencies and control dependencies in a Java pro-gram. VDFG is built from either source code or Java byte code, and includes both variables and instructions as ver-tices. Variables are included because they are important to investigate data-flow paths. We have defined an approxi-mated data dependence as follows.
• If a statements1assigns a value tovand another state-ments2refers tov, thens2depends ons1viav. Compared with the definition of data dependence for pro-gram slicing described in Section 2.1, we have removed the third condition. Similarly, in the case of making a VDFG from source code, control dependence is approx-imated based on the syntax tree instead of control-flow graphs as follows:
• A statement is controlled by its enclosing control state-ment such asifandwhile.
In the case of making a VDFG from byte code, we performed traditional control-dependence analysis because syntax trees are lost in byte code. Although these approxi-mations may generate infeasible dependencies, they will not miss any traditional dependencies.
VDFG comprises three kinds of vertices and two kinds of edges, as follows.
A variable vertexcorresponds to a variable or a literal.
Variables include local variables, formal parameters, actual arguments, instance field variables, class variables, and lit-erals.
An operator vertexcorresponds to an operator of an
expression. An operator vertex has one or more incoming data-flow edges from vertices corresponding to operands. If the resulting value of an operator is assigned to a variable or used by another operator, the operator vertex has an out-going data-flow edge. We treat method calls, field access and array access as special operators whose operands, e.g. a receiver object and parameters, are represented by variable vertices.
A control vertexcorresponds to a control statement
such as if and while. A control vertex has an incoming data-flow edge representing the conditional expression and out-going control edges to call-site vertices and operator vertices controlled by the condition.
Data-dependenceandcontrol-dependenceedges
rep-resent approximated data dependencies and control depen-dencies, as mentioned above.
A VDFG is constructed by the following steps: 1. Create a variable vertex for each variable declaration. 2. Translate each statement into vertices and edges.
The first step processes fields, local variables, and liter-als. All instance fields and class fields in the target program
are translated into variable vertices.
The second step is an intra-procedural process of mak-ing vertices and edges that represent each statement. First, statements are parsed into vertices. Expressions are parsed into variable vertices and operator vertices. if,for, and whilestatements are parsed into control vertices and ver-tices that represent predicates. Method call statements are parsed into variable vertices that represent actual arguments and returned values. Field access instructions and array ac-cess instructions are treated as method calls. Each instruc-tion has an actual-in vertex representing the receiver object. Moreover, a field or array write instruction has an actual-in vertex representactual-ing the assigned value. A field or array read instruction has an actual-out vertex representing the read field or array element value. Each array instruction has an additional actual-in vertex representing the index value.
After making vertices, data-dependence edges and control-dependence edges are drawn according to the above definitions. Additionally, a vertex of a field read/write in-struction representing the field value is connected to the field vertex by a data-dependence edge. A vertex representing an array element is connected to other vertices representing ar-ray elements that have the same declaration type.
An inter-procedural data-dependence edge is drawn to represent a parameter data-flow related to method calls. Actual-in vertices to in vertices and formal-out vertices to actual-formal-out vertices are connected by data-dependence edges according to method calls. For virtual method call resolution, we use Class Hierarchy Analysis (CHA) [18]. VDFG ignores unanalyzable library classes for which source code is not available. A method call to a library class is not connected to the called method.
Our analysis does not support several aspects of Java language as follows:
• The statements in a catch block are simply translated into a VDFG without a special rule. We ignored data-flow paths for an exception object from a method call or a throwstatement to acatch block, although we could represent such a data-flow in VDFG. Developers who investigate exceptional control-flow can use an-other visualization tool such as Flow View specialized for exception handling [19].
• We did not take multi-threaded execution into account as regular control-flow paths. VDFG includes data de-pendencies between threads if the threads communi-cate by variables. A synchronized block is represented as a control vertex that takes as input an expression and controls statements in the block.
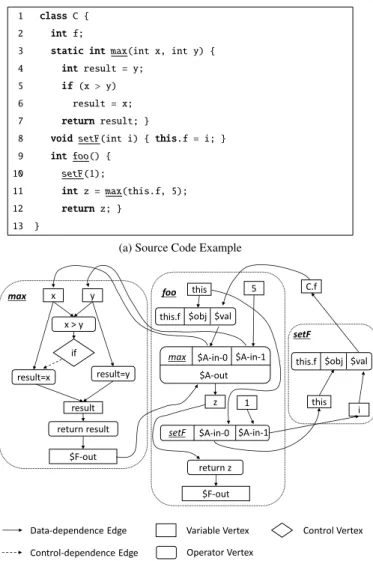
Figure 1 shows an example of source code and its VDFG. The code fragment in Figure 1a is a classCthat has a fieldfand methodsmax,setF, andfoo. The methodmax takes two parametersxandyand returns the larger of the two. The methodsetFtakes one parameteriand assignsi to fieldf. The methodfooexecutessetFwith argument 1, maxwith argumentfand5, and then returnsz, which is the value returned from a call to themaxmethod.
1 class C { 2 int f;
3 static intmax(int x, int y) { 4 int result = y;
5 if(x > y) 6 result = x; 7 returnresult; }
8 voidsetF(int i) { this.f = i; } 9 int foo() {
10 setF(1);
11 int z = max(this.f, 5); 12 returnz; }
13 }
(a) Source Code Example
x max y if result $F-out setF i foo 1 5 z setF $A-in-1 $A-out
max $A-in-0 $A-in-1 this.f $obj $val this.f $obj $val
$A-in-0 this this C.f $F-out Data-dependence Edge Control-dependence Edge
Variable Vertex Control Vertex Operator Vertex
result=x result=y x > y
return result
return z
(b) Variable Data-Flow Graph
Fig. 1: Example of Source Code and Variable Data-Flow Fraph
Figure 1b shows the VDFG for the example source code. The area enclosed by the dashed line includes the subgraph of the corresponding method.
In the VDFG, verticesxandyinmaxcorrespond to the local variables “int x” and “int y”, respectively. The ver-tex “x > y” represents a comparison operator in line 5. The vertex takes as inputs two edges fromxandy, and provides the resultant value to the following if statement. Assignment “result = x;” in line 6 is controlled by the enclosingif statement. Therefore, the “if” vertex has a control edge to operator vertex “result = x”.
The method call instruction in line 11 is translated to four vertices whose labels are “max”, “$A-in-0”, “$A-in-1”, and “$A-out” (the vertices are represented by a method call including four areas). The vertex labeledmaxis a pseudo-vertex representing the method call.$A-in-0and $A-in-1vertices represent the actual-in vertices. $A-out represents the actual-out vertex. The actual vertices con-nect to their corresponding formal vertices, i.e., the vertices
$A-in-0, $A-in-1and$A-outare connected to vertices x, y, and $F-out, respectively. These are formal-in and formal-out parameters of methodmaxinvoked by the call.
The field access instruction in line 8 is translated to three vertices labeled “this.f”, “$obj” and “$val” in setF. The vertex this.f is a pseudo-vertex represent-ing the field access. The vertices$objand$valrepresent the receiver object and field value, respectively. The vertex $objis connected to the vertex labeled “this”, which rep-resents the variable this. The vertex$valis connected to the vertices labeled “i” and “C.f”. The vertexirepresents the local variablei. The vertexC.frepresents the value of field fof classC. The instruction in line 8 sets the value off, so that$valvertex connects toC.f. TheC.fis connected to $valinfoobecause the field access instruction in line 11 uses the field valuef.
3.2 Program Slicing and Visualization
Program slicing using a VDFG is performed by simple backward/forward traversal from criterion designated by the developer. To reduce the complexity of the visualized graph corresponding to the program slice, we use fractal values.
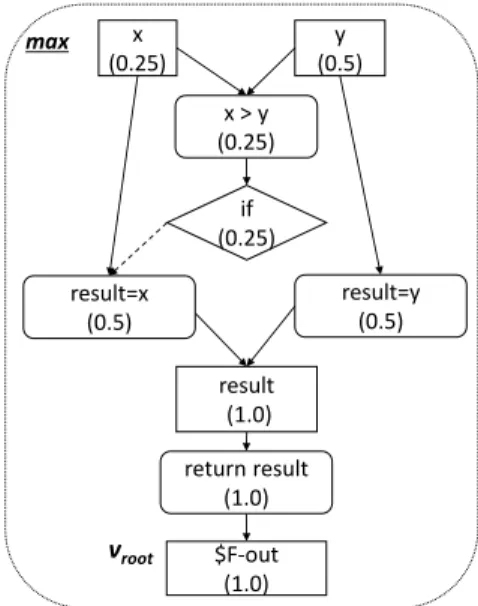
A fractal valuew(v) is a weight for a nodev. The fractal value for the root nodevrootis defined asw(vroot)=1.0. In
our technique,vrootnodes correspond to criterion of a
pro-gram slice. The fractal values of the other nodes are de-cided by the fractal value of a parent node and the number of children of the parent node. A child of a vertex means a vertex directly connected to the node by a traversal di-rectional edge. If a vertex has multiple parent vertices, the fractal value of the vertex is decided to the maximum value. The concrete definition in the case of backward traversal as follows:
w(v) =max{f(vp)| {v→vp}} f(vp) =
w(vp) |{v|v→vp}|
In the case of forward traversal, the directions of the arrows are reversed.
Figure 2 shows the example of fractal value using with the VDFG shown in Figure 1b. This figure shows the VDFG of methodmax. Thevrootis$F-out. The direction of a
pro-gram slicing is backward. The fractal value of each vertex is shown as digit in parentheses. The fractal values of the vertices of return resultandresult are 1.0, because the path fromvroothas no branch. In contrast, the values of
result=xandresult=yis 0.5, because both are children of result. Similarly, values of x andif are 0.25 since these are children ofresult=x. Note that fractal values of xandyare 0.25 and 0.5 respectively, despite these vertices are children ofx > y. The reason why is that our fractal value applies the maximum value if a vertex has multiple parents.
For the purposes of program slicing, the fractal value is used as a threshold, i.e., traversal in program slicing con-tinues until visiting a vertex whose fractal value is less than
max x (0.25) y (0.5) if (0.25) result (1.0) vroot $F-out (1.0) return result (1.0) result=x (0.5) result=y (0.5) x > y (0.25)
Fig. 2: An example of fractal value for backward traversal fromvroot
a threshold value. As a result, the slices with fractal values only include vertices whose fractal values are greater than this threshold. Theoretically, if the threshold fractal value is decreased, the size of the slices will increase.
An important feature of fractal value is that the frac-tal value of a node is the same as its parent if there are no sibling nodes. A graph traversal continues through a vari-able if the value of the varivari-able is determined by another single variable, e.g., a parameter that is incoming from a single caller. On the other hand, backward traversal stops at methods called by a large number of other methods, e.g., setter/getter methods. Similarly, forward traversal stops at return values and fields used by a large number of methods. In contrast to the distance limit [5], which limits a slice size according to the distance from the criteria, fractal value sup-presses the complexity even if a complicated portion exists near the criteria.
The results of program slicing are visualized on the screen using a graph viewer. In order to focus on the inter-procedural dependences, visualized vertices include only those that represent method calls, parameters, fields, local variables, and predicates. Edges are visualized if depen-dence existed between the visualized vertices.
At points where the backward/forward traversal is stopped because fractal value falls a certain threshold, a pseudo-node labeled “more ...” is added to the visualized graph, so as to indicate that the program slice has been ter-minated at the node. Developers can start another graph traversal from the method by selecting another method.
Our VDFG viewer is implemented as an Eclipse plug-in. To help developers investigate source code, the VDFG view interacts with a text editor; a mouse click on a method name or a field name triggers program slicing according to the following criterion:
method declaration provides backward program slic-ing criterion that include all parameters of the meth-ods and referenced fields in the method. Moreover, the mouse click also provides forward program slicing cri-terion that include the return value of the method and assigned fields in the method.
Criterion for Method Calls A mouse click on a method
call site provides forward program slicing criterion, in-cluding the actual parameters. Moreover, the click also provides backward slicing criteria that include the re-turned value of the method call.
Criterion for Fields A mouse click on a field declaration
or a field reference provides forward/backward pro-gram slicing criteria that include a corresponding field vertex.
Our visualization approach involves a hierarchical view, similar to DA4Java [16]. A class is represented by a rectangle that contains its methods and fields. Each method involved in the subgraph is also represented as a rectan-gle including vertices representing the instructions of the method. We have excluded the other methods and fields that are not involved in the subgraph from the graph view be-cause such methods and fields are irrelevant to the visualized subgraph. We have used Graphviz [20] for graph layout.
The graph view provides hyperlinks to Java source code so that developers can quickly confirm the implemen-tation details of methods that have been omitted in the graph view. Developers can move to a method declaration, a method call site, or a field declaration in a Java editor by selecting a vertex in the graph view.
4. Experiment
For evaluating our technique, we have defined the following three research questions:
RQ1: How accurate is VDFG-based program slicing us-ing fractal values as compared to state-of-the-art
program slicing? The VDFG-based program slicing
technique has several insensitivities. Therefore, for general use, it is important to know the accuracy of the visualized program slices that result from our methods.
RQ2: Is a slice extracted with fractal values an effective
size for supporting investigation of control and data
dependencies?A program slice should not be so small
that it cannot provide effective information to develop-ers. Additionally, the slice should not be too large so that it can actually provide understandable information to developers. Furthermore, it is desirable that the slice includes a portion that is distant from the developer’s focused point i.e. criterion.
RQ3: Is our tool effective for development tasks? Our
proposed tool aims to support development tasks; therefore, it is important to evaluate the effectiveness in practical usage.
The following subsections describe the three experiments
that we designed to answer these questions.
4.1 Experiment 1: Comparison with State-of-the-Art Pro-gram Slicing Techniques
In this experiment, we compared VDFG-based program slicing for visualization and state-of-the-art program slic-ing. For the target comparison, we selected the Improved Slicer (IMP), which is a context-sensitive, flow-sensitive, and object-sensitive SDG-based program slicing technique [7]. Since VDFG-based program slicing uses conservative approximations, a slice using VDFG may not be accurate but includes any portion in a slice by IMP. Therefore, we estimated the accuracy of vertices and edges in a slice using a criterioncas follows:
Accuracy(c)=|SV DFG(c)∩SI MP(c)|
|SV DFG(c)|
whereSV DFG(c),SI MP(c) refer to slice with VDFG toc, and
a slice with IMP toc, respectively As IMP requires points-to information, we used Spark [21] with Soot Framework [22]. In addition, we used the byte code analysis version of our VDFG-based slicing tool in order to be consistent with Spark and IMP both of which use byte code analysis.
As an SDG of IMP does not have corresponding ver-tices of a field vertex and a local variable vertex, we have defined corresponding vertices as follows:
• A vertex representing an instruction that accesses a field corresponds to a field vertex that represents the same field.
• A vertex representing an instruction that accesses a lo-cal variable corresponds to a lolo-cal variable vertex that represents the same local variable.
In addition, we defined the correctness of a vertex and edge as follows:
• A vertex of a slice from VDFG is correct if a corre-sponding vertex exists in a slice from IMP.
• An edgev1 → v2 of a slice from VDFG is correct if corresponding vertices forv1andv2exist in a slice from IMP, andv2is reachable fromv1in the slice from IMP. To evaluate the accuracy of a visualized slice, we com-pared VDFG-based slice visualization of target vertices and edges, as described in Section 3.2. Furthermore, to deter-mine the accuracy of a VDFG-based program slice with various fractal values, we tested nine configurations. Eight of the configurations use different minimum fractal values, ranging from 0.005 to 0.32. The ninth configuration does not use fractal value.
The experimental target applications are taken from Qualitas Corpus [23]. Table 1 shows the target applica-tions and their sizes. The columns CHA and Points-to show the number of reachable methods and instructions from a main method by CHA and Spark’s Points-to analysis, re-spectively. As performing program slicing requires criteria, we used three different types of criterion, as described in
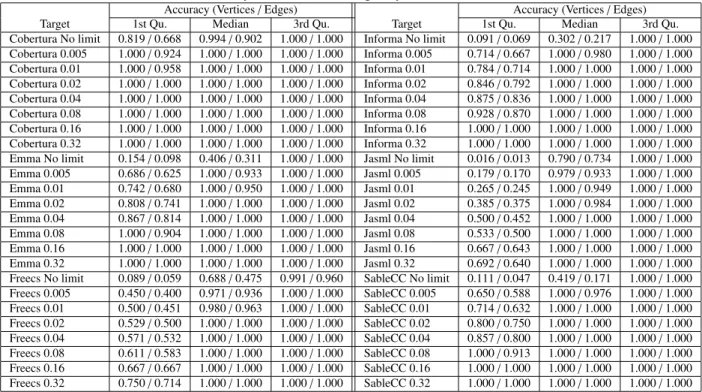
Table 2: Accuracy of Vertices and Edges by VDFG with Fractal Value
Accuracy (Vertices/Edges) Accuracy (Vertices/Edges)
Target 1st Qu. Median 3rd Qu. Target 1st Qu. Median 3rd Qu.
Cobertura No limit 0.819/0.668 0.994/0.902 1.000/1.000 Informa No limit 0.091/0.069 0.302/0.217 1.000/1.000 Cobertura 0.005 1.000/0.924 1.000/1.000 1.000/1.000 Informa 0.005 0.714/0.667 1.000/0.980 1.000/1.000 Cobertura 0.01 1.000/0.958 1.000/1.000 1.000/1.000 Informa 0.01 0.784/0.714 1.000/1.000 1.000/1.000 Cobertura 0.02 1.000/1.000 1.000/1.000 1.000/1.000 Informa 0.02 0.846/0.792 1.000/1.000 1.000/1.000 Cobertura 0.04 1.000/1.000 1.000/1.000 1.000/1.000 Informa 0.04 0.875/0.836 1.000/1.000 1.000/1.000 Cobertura 0.08 1.000/1.000 1.000/1.000 1.000/1.000 Informa 0.08 0.928/0.870 1.000/1.000 1.000/1.000 Cobertura 0.16 1.000/1.000 1.000/1.000 1.000/1.000 Informa 0.16 1.000/1.000 1.000/1.000 1.000/1.000 Cobertura 0.32 1.000/1.000 1.000/1.000 1.000/1.000 Informa 0.32 1.000/1.000 1.000/1.000 1.000/1.000 Emma No limit 0.154/0.098 0.406/0.311 1.000/1.000 Jasml No limit 0.016/0.013 0.790/0.734 1.000/1.000 Emma 0.005 0.686/0.625 1.000/0.933 1.000/1.000 Jasml 0.005 0.179/0.170 0.979/0.933 1.000/1.000 Emma 0.01 0.742/0.680 1.000/0.950 1.000/1.000 Jasml 0.01 0.265/0.245 1.000/0.949 1.000/1.000 Emma 0.02 0.808/0.741 1.000/1.000 1.000/1.000 Jasml 0.02 0.385/0.375 1.000/0.984 1.000/1.000 Emma 0.04 0.867/0.814 1.000/1.000 1.000/1.000 Jasml 0.04 0.500/0.452 1.000/1.000 1.000/1.000 Emma 0.08 1.000/0.904 1.000/1.000 1.000/1.000 Jasml 0.08 0.533/0.500 1.000/1.000 1.000/1.000 Emma 0.16 1.000/1.000 1.000/1.000 1.000/1.000 Jasml 0.16 0.667/0.643 1.000/1.000 1.000/1.000 Emma 0.32 1.000/1.000 1.000/1.000 1.000/1.000 Jasml 0.32 0.692/0.640 1.000/1.000 1.000/1.000 Freecs No limit 0.089/0.059 0.688/0.475 0.991/0.960 SableCC No limit 0.111/0.047 0.419/0.171 1.000/1.000 Freecs 0.005 0.450/0.400 0.971/0.936 1.000/1.000 SableCC 0.005 0.650/0.588 1.000/0.976 1.000/1.000 Freecs 0.01 0.500/0.451 0.980/0.963 1.000/1.000 SableCC 0.01 0.714/0.632 1.000/1.000 1.000/1.000 Freecs 0.02 0.529/0.500 1.000/1.000 1.000/1.000 SableCC 0.02 0.800/0.750 1.000/1.000 1.000/1.000 Freecs 0.04 0.571/0.532 1.000/1.000 1.000/1.000 SableCC 0.04 0.857/0.800 1.000/1.000 1.000/1.000 Freecs 0.08 0.611/0.583 1.000/1.000 1.000/1.000 SableCC 0.08 1.000/0.913 1.000/1.000 1.000/1.000 Freecs 0.16 0.667/0.667 1.000/1.000 1.000/1.000 SableCC 0.16 1.000/1.000 1.000/1.000 1.000/1.000 Freecs 0.32 0.750/0.714 1.000/1.000 1.000/1.000 SableCC 0.32 1.000/1.000 1.000/1.000 1.000/1.000
Table 1: The Sizes of Target Applications
CHA Points-To
#Method #Instructions #Method #Instructions
Cobertura 337 14,068 327 14,027 Emma 1,234 39,227 1,236 39,102 Freecs 1,327 57,324 1,147 51,671 Informa 485 16,368 458 15,586 Jasml 233 18,419 233 18,419 SableCC 1,949 54,373 1,898 54,143
Section 3.2. As some of the criteria for VDFG do not ex-actly correspond to IMPfs vertices, the criterion for IMP are defined as follows:
Criterion for Method Declaration Backward slicing
cri-terion include all parameters of the methods and field reference instructions in the method. Forward slicing criterion include the return value of the method and field assignment instructions in the method.
Criterion for Method Call Same as for VDFG (see
Sec-tion 3.2).
Criterion for Field Given a field, backward/forward
slic-ing criterion include all field access instructions ac-cessed to the field.
Table 2 shows the distributions of the accuracies ob-tained with the various configurations. In particular, the ta-ble shows the first, second, and third quartile values. The target columns show the target application as well as the configuration. Each cell contains the accuracies for vertices and edges. Note that “No limit” in the target column corre-sponds to the configuration that does not use fractal value.
The results show that VDFG-based program slicing
without fractal value leads to many inaccurate vertices and edges. For example, the median of vertex accuracy rates for “SableCC No limit” is 0.419; the median accuracy for edges is only 0.170. With the exception of the results of Cobertura and Jasml, the median for edge accuracy was less than 0.50. Unfortunately, this result indicates that using VDFG pro-gram slicing without fractal value yields highly inaccurate results.
On the other hand, the accuracy of VDFG-based pro-gram slicing with fractal values is surprisingly high. For ex-ample, the median for vertex/edge accuracies of “SableCC 0.005” is 1.0, despite the fact that “SableCC Nolimit” re-sulted in a quite low accuracy. All of the vertex/edge ac-curacies with a minimum fractal value threshold of 0.005 were more than 0.9. The result shows two things: First, if a vertex has many children, edges between the vertex and the children really include infeasible paths because of in-sensitivities. Secondly, fractal value succeeds to stop visu-alization of imprecise vertices which are connected by such infeasible paths.
The results shown in Table 2 also indicate that if the minimum fractal value is configured to larger value, then the quartiles of accuracies are also higher values. Increas-ing the minimum fractal value means that the slice excludes portions that are far from the criteria. Therefore, this re-sult indicates that the portion of the program slice near the criteria is accurate even if a graph including several known insensitivities is used. If the minimum fractal value is 0.04 or more, all of the vertex/edge accuracy medians are 1.0. These results show that VDFG’s program slicing with frac-tal values is accurate and the insensitivities of VDFG are
Table 3: The Distribution of the number of Vertices and Max Distance in the Slice with Fractal Value
#Vertices/Max Distance #Vertices/Max Distance
1st Qu. Median 3rd Qu. Max 1st Qu. Median 3rd Qu. Max
Cobertura 0.005 3/1 11/6 33/12 417/36 Informa 0.005 4/2 24/9 56/13 644/40 Cobertura 0.01 3/1 10/5 26/11 256/30 Informa 0.01 4/2 21/8 42/12 380/40 Cobertura 0.02 3/1 9/5 21/10 203/29 Informa 0.02 4/2 17/7 33/10 216/33 Cobertura 0.04 3/1 8/4 17/8 172/25 Informa 0.04 4/2 14/6 24/9 148/27 Cobertura 0.08 3/1 7/4 14/7 122/22 Informa 0.08 4/2 10/5 17/7 90/26 Cobertura 0.16 3/1 6/3 10/6 81/19 Informa 0.16 4/1 8/4 12/6 69/26 Cobertura 0.32 3/1 5/3 8/4 50/19 Informa 0.32 3/1 6/3 9/4 56/23 Emma 0.005 4/3 22/10 47/15 809/36 Jasml 0.005 4/1 16/8 36/11 734/22 Emma 0.01 4/3 19/9 38/13 497/31 Jasml 0.01 4/1 14/7 25/10 576/19 Emma 0.02 4/2 16/8 30/11 371/29 Jasml 0.02 4/1 13/7 19/9 468/18 Emma 0.04 4/2 13/7 22/10 280/27 Jasml 0.04 4/1 11/6 15/7 329/18 Emma 0.08 4/1 11/6 16.25/8 196/23 Jasml 0.08 4/1 8/4 13/6 234/18 Emma 0.16 4/1 8/4 12/6 140/21 Jasml 0.16 4/1 6/3 9/4 135/15 Emma 0.32 3/1 6/3 9/4 76/21 Jasml 0.32 4/1 5/2 7/4 90/14 Freecs 0.005 4/1 21/9 40/12 2,130/38 SableCC 0.005 4/1 14/7 34/12 1,058/25 Freecs 0.01 4/1 18/8 31/11 1,431/29 SableCC 0.01 4/1 12/6 26/10 496/25 Freecs 0.02 4/1 15/7 25/9 950/29 SableCC 0.02 4/1 11/6 20/9 364/25 Freecs 0.08 4/1 10/5 14/7 524/27 SableCC 0.08 4/1 8/4 13/7 146/22 Freecs 0.16 4/1 8/4 11/5 424/27 SableCC 0.16 4/1 7/4 11/5 131/19 Freecs 0.32 4/1 6/3 8/4 277/24 SableCC 0.32 3/1 5/3 8/4 88/16 therefore tolerable.
4.2 Experiment 2: Investigation of Slice Size
Experiment 1 showed that VDFG-based program slicing with fractal values extracts accurate slices. However, if the slice is too small, it may not be helpful for program under-standing because the slice will only visualize a narrow area. To address RQ2, we measured slice size as well as whether the distant portions are included in slices. To measure the former, we simply counted the number of vertices in each slice. To measure the latter, we measured the maximum dis-tance of vertices from the criterion in a slice. The configu-rations and targets were the same as for Experiment 1.
Table 3 shows the distribution of the number of ver-tices as well as the max distances. Similar to Table 2, the target column displays both the target and the fractal value configuration.
The results shown in Table 3 demonstrate that the num-ber of vertices may be as high as hundreds or thousands; however, in most cases, the number is several dozen. If the minimum fractal value is 0.005, the maximum median is 24, which corresponds to the case of Informa. The results show that fractal value prevents an explosion in the number of vertices and leaves a number of vertices that is human manageable.
Regarding the distance from the criterion, the data in Table 3 also indicate that the max distances typically range from three to ten. If the minimum fractal value is set to 0.005, the minimum median distance is six (in the case of Cobertura). As the slice is focused on revealing inter-procedural dependencies, the results suggest that a slice shows dependencies among several methods, on average. On the other hand, a slice may include several dozens of distant vertices in some cases, e.g., the max value is 40 in
the case of Informa 0.005. This indicates that the slice actu-ally includes distant locations that are connected by simply straight-dependence edges. Since these straight edges are easy to understand for users, the slice supports the investi-gation of long-range dependence paths.
From an alternative point of view, Table 3 shows the stability of the slice size against the target program. If the fractal value is the same, the medians of the results do not vary greatly. We think that this property is suitable for vi-sualization because a user does not confuse the variation of the size of the visualized slices.
4.3 Experiment 3: Case Study of Source Code Reading To evaluate the effectiveness of our visualization tech-nique, we had 16 participants work on program understand-ing tasks. Out of these, 12 participants were graduate stu-dents studying software engineering. They were familiar with Java, as they implemented tools for their research in Java. Four participants were software developers working in a software company. They developed package software or enterprise applications written in Java.
We selected JEdit, an open source text editor, as the target program as no participants had knowledge of or ex-perience with its source code. JEdit has a functionality that generates a beep sound when JEdit cannot execute an action specified by a user. Such a code fragment frequently appears in JEdit. We asked the participants to identify conditions in which the beep sound was generated and to explain how theifstatements are affected by the external environment, such as actions conducted by a user, the status of GUI com-ponents, and the status of a file system. The reason why we choseifstatements is that understanding preciseif condi-tions is important for debugging tasks [24].
lo-VFS boolean load(View,Buffer,String) JEditBuffer boolean isReadOnly() void setFileReadOnly(boolean) void setReadOnly(boolean) boolean isEditable() Buffer int checkFileStatus(View) void finishSaving(View,String,String,String,boolean,boolean) boolean checkFileForLoad(View,VFS,String) void setPath(String) called
true void setReadOnly ( boolean )
called readOnly readOnlyOverride return || readOnly || called boolean isReadOnly ( ) called readOnly = = called called
newReadOnly void setFileReadOnly ( boolean )
called
false void setFileReadOnly ( boolean )
called
void setFileReadOnly ( boolean ) called
true void setFileReadOnly ( boolean )
2 node more ... 4 node more ...
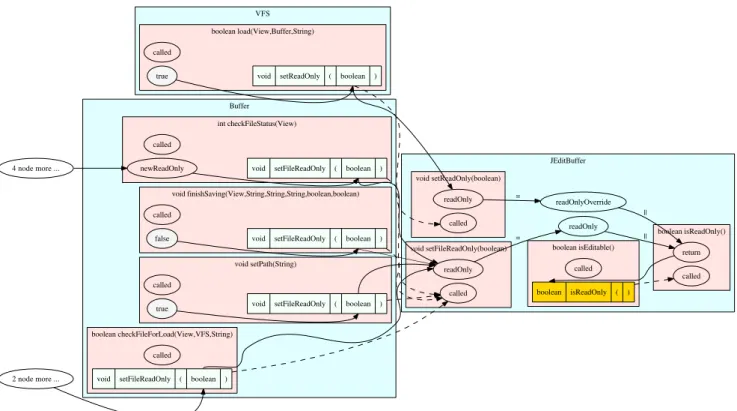
Fig. 4: A screen shot of a VDFG-based program slice for JEdit public void actionPerformed (...) {
...
if ( editor . getAbbrev () == null || editor . getAbbrev () . length () == 0) {
getToolkit () . beep () ; // 153
return; }
... }
(a) TaskA: EditAbbrevDialog.java, Line 153
public void undo ( TextArea textArea ) {
...
if (! isEditable () ) {
textArea . getToolkit () . beep () ; // 2038
return ; }
... }
(b) TaskB: JEditBuffer.java, Line 2038
Fig. 3: Program Comprehension Task Targets
cations in JEdit 4.3pre11. In Task A, a beep sound is gener-ated if a text input widget has no text that must be specified by a user to execute the command. In Task B, a beep sound is generated if file editing is not permitted by the file sys-tem. To explain the conditions for Task A and Task B, 8 and 13 methods in JEdit must be investigated, respectively. We asked the participants to write down their answers manually on paper.
We assigned two tasks to each participant; one task was performed using Eclipse enhanced with the VDFG plug-in and another task using the standard Eclipse 3.4, without our
plug-in. We compared the data-flow paths investigated by participants in a limited time slot. Note that the minimum fractal value is set to 0.04 in this experiment. Additionally, the VDFG tool is used in the source code analysis version because the API of Eclipse supports accessing abstract syn-tax tree of the source code.
Figure 4 shows a visualized slice of JEdit, corre-sponding to a point at which a developer clicked on a method call instruction isReadOnly() involved in the isEditable method. The highlighted (yellow) call site in Figure 4 has an incoming data-flow edge from the isReadOnly method. The return value depends on the readOnlyOverride and readOnly fields. The fields are assigned by thesetReadOnlyandsetFileReadOnly methods. ThesetReadOnlymethod is called by the load method of a file system class and the setFileReadOnly method is called by 4 methods in a buffer class. Using the graph, we can infer how the return value of theisReadOnly method is determined without reading the actual source code.
The time for each task was limited to 30 minutes. The time does not include VDFG construction, as we aimed only to determine the effectiveness of using the tool and not its efficiency. We observed the activities of each participant us-ing a video camera. The tasks were sequentially assigned. For each participant, we had a 30-minute session in which we explained the concept of VDFGs and gave a trial task so that participants could learn our tool. After the introduction, we assigned an experimental task. 30 minutes later, we
in-l o a d w e i g h t = 0 . 2 5 A n a r g u m e n t o f s e t P e r f o r m i n g I O ( b o o l e a n ) ( t r u e ) s a v e w e i g h t = 0 . 2 5 A r e t u r n v a l u e o f i s P e r f o r m i n g I O ( ) ( t r u e ) A r e t u r n v a l u e o f i s E d i t a b l e ( ) ( f a l s e ) c h e c k F i l e S t a t u s ( ) w e i g h t = 0 . 5 A n a r g u m e n t o f s e t F i l e R e a d O n l y ( b o o l e a n ) ( t r u e ) A r e t u r n v a l u e o f i s F i l e R e a d O n l y ( ) ( t r u e )
Fig. 5: An example of score computation. The graph is a simplified version of the answer of Task B.
terrupted the investigation activity and assigned the second task.
To evaluate the correctness of an answer, we deter-mined a correct answer for each task prior to the experiment. The correct answers are defined as data-flow paths. For ex-ample, Figure 5 is a simplified version of the correct answer for Task B. The graph has three data-flow paths from dif-ferent methods: load,save, andcheckFileStatus. We have computed aScorefor each answer using the following function:
Score(A)=X v∈V
w(v)|path(v,m)∩A|
|path(v,m)|
In this function, A is a set of data-flow edges included in the answer of a participant, V is a set of source ver-tices of data-flow paths in the correct answer,mis the tar-get method where beep sound is generated, andw(v) is a weight value for each vertex determined by fractal values [6], as described in Section 3.2. If an answer included a gray part of Figure 5, the answer included three of three edges for load, two of three edges forsave and one of three edges forcheckFileStatus. The resulting score was 0.25∗33 +0.25∗32+0.5∗13 =0.583.
Table 4 shows the assigned tasks and resulting scores for each participant. The average score of participants work-ing with VDFG was 0.79, while the average score of partic-ipants working with the standard Eclipse environment was 0.71. A Wilcoxon signed-rank test demonstrated that the difference between the two groups was statistically signifi-cant (p=0.03). The visualization of the VDFG enabled par-ticipants to more completely discover and interpret the data-flow paths implicated in the task.
We observed that a visualized VDFG is frequently used by participants. After the participants selected a method or a variable to obtain a VDFG, they repeatedly selected a re-turn value vertex or a method parameter vertex in the graph to read source code. Without VDFG, participants had to identify data-flow paths using a call graph view and several search functionalities provided by Eclipse.
We additionally observed that participants used VDFG to recognize where they investigated. When the value of a variable depended on two or more methods, participants had
Table 4: The resultant scores. “/VDFG” indicates that a participant used VDFG for the task.
Score
Participant 1st Task 2nd Task with VDFG w/o VDFG
P1 (Student) A/VDFG B 0.857 0.781 P2 (Student) A/VDFG B 1.000 0.723 P3 (Student) A/VDFG B 1.000 0.621 P4 (Industry) A/VDFG B 0.857 0.652 P5 (Student) A B/VDFG 0.875 0.857 P6 (Student) A B/VDFG 0.708 0.429 P7 (Student) A B/VDFG 0.621 0.571 P8 (Industry) A B/VDFG 0.760 1.000 P9 (Student) B/VDFG A 0.733 0.714 P10 (Student) B/VDFG A 0.858 1.000 P11 (Student) B/VDFG A 0.817 0.714 P12 (Industry) B/VDFG A 0.590 0.429 P13 (Student) B A/VDFG 0.714 0.590 P14 (Student) B A/VDFG 0.857 0.723 P15 (Student) B A/VDFG 1.000 0.908 P16 (Industry) B A/VDFG 0.429 0.671 Mean 0.792 0.711 Median 0.836 0.714
to investigate one of data-flow paths and come back to the variable. On the other hand, participants working without VDFG had trouble identifying their previous source code locations. Several participants lost their previous locations and had to restart their investigation from the starting points of the tasks.
Although 13 of 16 participants performed better us-ing VDFG, three participants (P8, P10, and P16) performed better using Eclipse. P16 has the worst score for VDFG because he did not write down several data-flow paths in his answer, even though he appears to have actually investi-gated those paths. On the other hand, P8 and P10 answered the correct data-flow using regular Eclipse. They were fa-miliar with Eclipse; thus, they often clicked on a variable name to highlight the variable and quickly scrolled the ed-itor using the mouse wheel to identify the data-flow paths related to the variable. P8 and P10 also frequently used key-board shortcuts to obtain method call and field access rela-tionships. Although our VDFG visualized the same infor-mation they obtained, the behavior of these two participants was much faster using the regular Eclipse without our plug-in.
Participants appeared to not be disturbed by the pre-cision of our data-flow analysis. As described in Section 3.1, VDFG may include infeasible edges because of the ap-proximations of control and data dependencies. Indeed, an infeasible path results from the following code fragment for Task A:
dialog = new EditAbbrevDialog (... , abbrev , ...) ; abbrev = dialog . getAbbrev () ;
Variableabbrev in the first line does not depend on the second line. Our VDFG visualized a summary data-flow edge from the return value of getAbbrevto a parameter of the constructor callEditAbbrevDialog. However, par-ticipants read the source code in a few seconds and simply
ignored the infeasible edge.
Our data-flow analysis ignores library classes. For example, a method call JTextField.setText has no data-flow path to the return value of a method call JTextField.getText. However, the participants never complained about the lack of such data-flow paths. Instead, they have investigated data-flow paths of theJTextField variable to find the caller methods of setText and getText.
4.4 Threats to Validity
In the first experiment, we approximated the correspondence relationships of a local variable vertex and a field vertex be-tween VDFG and IMP. We believe that the approximation is appropriate, but that the approximation may increase the accuracy of vertices and edges.
In the second experiment, we measured the number of vertices and distance from the instructions, and then evalu-ated the effectiveness of a slice for visualization. Unfortu-nately, the appropriate number of vertices and distance for effective visualization is unknown. However, we showed that the number of vertices is suppressed to only dozens and a slice may include distant points. In addition, the case study showed that our visualized slices were effective for de-velopers to achieve program understanding. Therefore, we believe that our fractal value technique provides a human-manageable but informative slice.
The targets of the first and second experiments in-cluded only six applications. However, these applications were practically used and were not toy programs. Addition-ally, there was not a large difference in the results of each application. Therefore, we believe that the results can be generalized.
In the case study, the analysis target consisted of just one application and two tasks. The results of the case study may be application-specific, i.e., VDFG is precise only in the case of the tested application. However, in the other experiments, we used six applications for evaluation. The results of the other experiments show that visualized sub-graphs from VDFG are precise when compared to the state-of-the-art program slicing technique.
Another possible criticism of our case study was whether it was appropriate or not. If the tasks were slightly different from practical work, the result does not truly demonstrate the effectiveness of VDFG in practice. How-ever, the study of Latoza et al. [1] showed that developers often face the question, “In what situations is this method called?”, which is essentially equivalent to our tasks. There-fore, VDFG should be useful in practical work.
The other possible criticism was that we did not com-pare our technique and the visualization technique proposed by Krinke [5]. However, as mentioned in Section 2, the traditional program slicing technique is too heavyweight to support daily tasks, which is the main goal of our proposed technique. Therefore, we think that this does not matter to the validity.
5. Conclusion and Future Work
We proposed a VDFG-based program slicing technique and its visualization using fractal value. We performed three ex-periments. The first experiment demonstrated the accuracy of our slicing technique compared to a state-of-the-art pro-gram slicing technique. The second experiment showed that a slice obtained using our technique included a dozen ver-tices and a portion spanning from the criteria. The third ex-periment indicated that our proposed technique was indeed helpful for source code understanding tasks. In addition, de-velopers did not consider the inherent systems’ limitations as a problem, as the developers knew that various features of Eclipse are also flow-insensitive, context-insensitive, and object-insensitive.
Future work includes the comprehensive comparison of our technique and other visualization tools, such as Why-line [17] and a tool proposed by Krinke [5]. In the com-parison, we need to investigate the effectiveness of the tools for not only data flow investigation task, but also the other practical program comprehension tasks, such as reachability questions [1]. Another direction of the future work includes applying our flow-insensitive data-flow analysis to approxi-mate slice-based software metrics [25].
Acknowledgments
We thank Mr.Takeshi Murayama and developers of Hi-tachi Government & Public Corporation System Engineer-ing, Ltd. for supporting our experiment. This work was supported by JSPS KAKENHI Grant Number 26280021.
References
[1] T.D. LaToza and B.A. Myers, “Developers ask reachability ques-tions,” Proc. ICSE, pp.185–194, 2010.
[2] A.J. Ko, B.A. Myers, M.J. Coblenz, and H.H. Aung, “An exploratory study of how developers seek, relate, and collect relevant informa-tion during software maintenance tasks,” IEEE Trans. Softw. Eng., vol.32, no.12, pp.971–987, Dec. 2006.
[3] S. Horwitz, T. Reps, and D. Binkley, “Interprocedural slicing using dependence graphs,” Proc. PLDI, pp.35–46, 1988.
[4] Y. Kashima, T. Ishio, and K. Inoue, “Comparison of backward slic-ing techniques for java,” IEICE, vol.98, no.1, pp.–, Jan. 2015. [5] J. Krinke, “Visualization of program dependence and slices,” Proc.
ICSM, pp.168–177, 2004.
[6] H. Koike, “Fractal views: A fractal-based method for controlling information display,” ACM Trans. Inf. Syst., vol.13, no.3, pp.305– 323, July 1995.
[7] C. Hammer and G. Snelting, “An improved slicer for java,” Proc. PASTE, pp.17–22, 2004.
[8] T. Ishio, S. Etsuda, and K. Inoue, “A lightweight visualization of in-terprocedural data-flow paths for source code reading,” Proc. ICPC, pp.37–46, June 2012.
[9] M. Weiser, “Program slicing,” Proc. ICSE, pp.439–449, 1981. [10] S. Kusumoto, A. Nishimatsu, K. Nishie, and K. Inoue,
“Experimen-tal evaluation of program slicing for fault localization,” Empirical Softw. Eng., vol.7, no.1, pp.49–76, March 2002.
[11] K. Chen and V. Rajlich, “Case study of feature location using de-pendence graph,” Proc. IWPC, pp.241–, 2000.
[12] X. Wang, D. Lo, J. Cheng, L. Zhang, H. Mei, and J.X. Yu, “Matching dependence-related queries in the system dependence graph,” Proc. ASE, pp.457–466, 2010.
[13] J. Jasz, A. Beszedes, T. Gyimothy, and V. Rajlich, “Static execute after/before as a replacement of traditional software dependencies,” Proc. ICSM, pp.137–146, Sept 2008.
[14] T.T. Nguyen, H.A. Nguyen, N.H. Pham, J.M. Al-Kofahi, and T.N. Nguyen, “Graph-based mining of multiple object usage patterns,” Proc. FSE, pp.383–392, 2009.
[15] A. Bragdon, S.P. Reiss, R. Zeleznik, S. Karumuri, W. Cheung, J. Ka-plan, C. Coleman, F. Adeputra, and J.J. LaViola, Jr., “Code bubbles: Rethinking the user interface paradigm of integrated development environments,” Proc. ICSE, pp.455–464, 2010.
[16] M. Pinzger, K. Graefenhain, P. Knab, and H.C. Gall, “A tool for visual understanding of source code dependencies,” Proc. ICPC, pp.254–259, 2008.
[17] A.J. Ko and B.A. Myers, “Designing the whyline: A debugging in-terface for asking questions about program behavior,” Proc. CHI, pp.151–158, 2004.
[18] J. Dean, D. Grove, and C. Chambers, “Optimization of object-oriented programs using static class hierarchy analysis,” Proc. ECOOP, pp.77–101, 1995.
[19] H. Shah, C. G¨org, and M.J. Harrold, “Visualization of exception handling constructs to support program understanding,” Proc. Soft-Vis, pp.19–28, 2008.
[20] “Graphviz project.”http://www.graphviz.org/.
[21] O. Lhot´ak and L. Hendren, “Scaling java points-to analysis using spark,” Proc. CC, pp.153–169, 2003.
[22] R. Vall´ee-Rai, P. Co, E. Gagnon, L. Hendren, P. Lam, and V. Sun-daresan, “Soot - a java bytecode optimization framework,” Proc. CASCON, pp.13–, IBM Press, 1999.
[23] E. Tempero, C. Anslow, J. Dietrich, T. Han, J. Li, M. Lumpe, H. Melton, and J. Noble, “Qualitas corpus: A curated collection of java code for empirical studies,” Proc. APSEC, pp.336–345, Dec. 2010.
[24] K. Pan, S. Kim, and E.J. Whitehead, Jr., “Toward an understanding of bug fix patterns,” Empirical Softw. Eng., vol.14, no.3, pp.286– 315, June 2009.
[25] T.M. Meyers and D. Binkley, “An empirical study of slice-based co-hesion and coupling metrics,” ACM Trans. Softw. Eng. Methodol., vol.17, no.1, pp.2:1–2:27, Dec. 2007.