REAL TIME AIRCRAFT POSITION ESTIMATION UTILIZING APACHE STORM
By
JOSEPH RAYMOND HOUDE Bachelor of Science in Computer Science
Southern Methodist University Dallas, Texas
2003
Submitted to the Faculty of the Graduate College of the Oklahoma State University
in partial fulfillment of the requirements for
the Degree of MASTER OF SCIENCE
ii
REAL TIME AIRCRAFT POSITION ESTIMATION UTILIZING APACHE STORM
Thesis Approved:
Dr Johnson P. Thomas Thesis Adviser Dr. K. George
iii Name: JOSEPH RAYMOND HOUDE Date of Degree: May 2017
Title of Study: MASTER OF SCIENCE Major Field: COMPUTER SCIENCE
Abstract: Each year, the amount of data that is produced in the digital universe is continuously increasing, so much so that some sources claim that the amount of data is doubled every two years. This type of data can be characterized as a form of Big Data in which it is described as containing the 3V’s properties: Volume, Velocity, and Variety. In terms of data processing, technologies like Apache Storm have emerged to provide a distributed real time computation system. Being able to process and provide insightful meaning of Big Data in a timely manner has become quite challenging. In some intended environments where seconds matter, real time processing might not be good enough and only provides an operator minimal time to react. This thesis proposes the use of Apache Storm’s real time processing engine that uses a Kalman Filter to provide estimation. The proposed approach provides a flexible architecture that leverages the real time processing engine for quick response but also provides an additional layer for estimation. By
providing estimation, this allows for an operator to have more time to react based on trends seen within the data. Specifically, this thesis focuses on providing estimation to a location of an aircraft. One use case of this estimation solution could be utilized in preventing air traffic collisions. The estimation algorithm presented in this thesis is suited for predicting locations; however the architecture presented allows for the customization of different estimations for desired use case. Various test cases were executed to evaluate the overall system performance and determine if the proposed system would be viable to provide real time situational awareness and estimation. For the tests cases focused on the performance of Apache Storm, overall there was no degraded performance that present limitations on the proposed architecture. As for the estimation performance, the further out that the estimation was to predict the location there was an increasing associated error in estimating that location. An additional factor in
iv TABLE OF CONTENTS Chapter Page I. INTRODUCTION ...1 Background ...1 Problem Specification ...3 Solution ...4 Contributions...4 Outline...5
II. REVIEW OF LITERATURE...6
Big Data ...7
Data Processing ...8
Hadoop ...8
Yahoo! S4 ...9
Apache Storm...10
Kalman Filter Algorithm...12
Existing Literature ...13 III. METHODOLOGY ...16 Architecture...17 Setup ...17 Apache Storm...18 Spout ...19 Data Source ...20 Bolt ...20 Kalman Filter ...21 Test Cases ...23
Apache Storm Performance ...24
Spout to Bolt Performance ...24
Kalman Filter Processing Time ...25
v
Chapter Page
IV. FINDINGS ...27
Apache Storm Performance Results ...27
Record Input Frequency ...28
Spout to Bolt Performance Results ...32
Kalman Filter Processing Time Results ...34
Predicted vs Actual Location Results ...35
V. CONCLUSION ...39
Thesis Contribution ...40
vi
LIST OF TABLES
Table Page
Table 1 Expected Record Emittance Rate ...28
Table 2 Summary of Varying Emittance Rates Results...32
Table 3 Spout to Bolt Performance ...33
Table 4 Kalman Filter Bolt Performance ...34
Table 5 Predicted vs Actual Location ...35
vii
LIST OF FIGURES
Figure Page
Figure 1 Twitter Data Trends ...1
Figure 2 Storm Topology ...11
Figure 3 Kalman Filter ...13
Figure 4 Single Aircraft Topology ...18
Figure 5 Redundant Aircraft Topology...18
Figure 6 Example Source Code – Single Aircraft Topology ...19
Figure 7 Example Source Code – Redundant Aircraft Topology ...19
Figure 8 Example Source Code – Kalman Filter Instance ...23
Figure 9 Storm Topology Timers ...24
Figure 10 Spout to Bolt Test Case ...25
Figure 11 Kalman Filter Processing Time Test Case ...25
Figure 12 Test Case 30 Hz Emittance Rate ...29
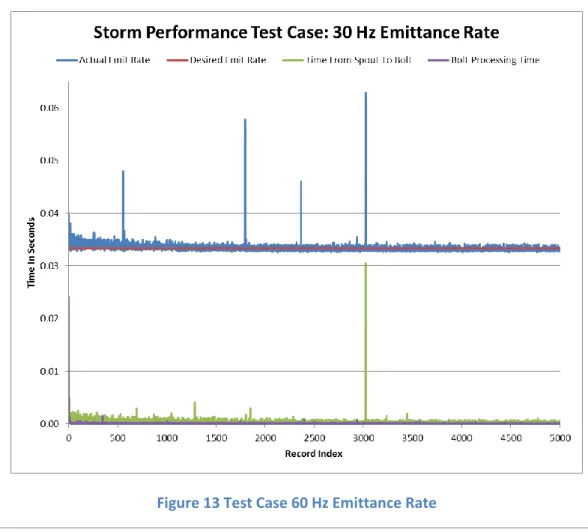
Figure 13 Test Case 60 Hz Emittance Rate ...29
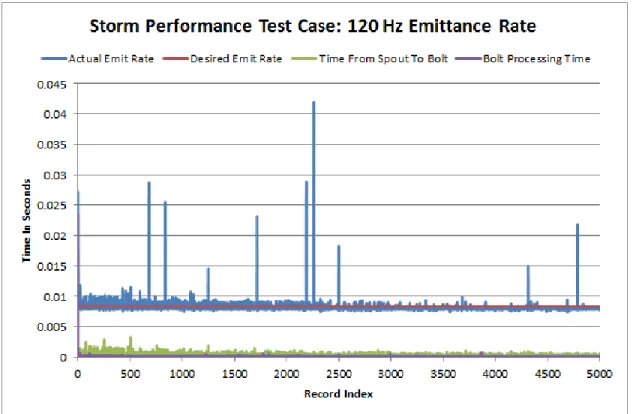
Figure 14 Test Case 120 Hz Emittance Rate ...30
Figure 15 Test Case 240 Hz Emittance Rate ...30
Figure 16 Test Case 480 Hz Emittance Rate ...31
Figure 17 Test Case 960 Hz Emittance Rate ...31
Figure 18 Average Time from Spout to Bolt ...33
Figure 19 Actual Flight Path ...36
Figure 20 Predicted vs Actual Location – 30 Cycles ...37
1 CHAPTER I
INTRODUCTION
1.1 Background
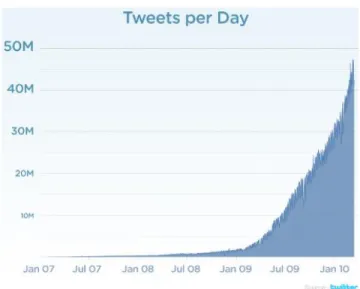
Every year, the amount of data that is produced in the digital universe is continuously increasing. Take for instance the data that is created by the social media website Twitter. In 2007 about 5,000 tweets were occurring each day whereas in 2013 the number of tweets had increased to around 500 million each day [10].
Figure 1 Twitter Data Trends
This type of surge in the amount of digital data has gained a lot of focus from a variety of industries and can be characterized as a form of Big Data.
2
Big Data is used to describe data sets that are so large and complex that traditional tools and applications have a difficult time processing. Back in 2001 Doug Laney coined the three properties (3 V’s) of Big Data: Volume, Velocity, and Variety [11]. Volume is described as the amount of data that is produced. Velocity is the speed in which the data is being produced at. Variety is the various formats of incoming data. While
understanding the importance on the growing trend of Big Data, the Obama
administration announced the “Big Data” Initiative of $200 million in 2012. One of the Department of Defense’s goals in this initiative is to harness and utilize massive data in new ways and bring together sensing, perception and decision support to make truly autonomous systems that can maneuver and make decisions on their own [1]. An area of interest in terms of Big Data is how to efficiently handle and process the incoming data. One tool that has been used to process large data sets on commodity computers is Apache Hadoop [12]. The Hadoop framework provides a distributed file system called Hadoop Distributed File System (HDFS) [4] that stores data across commodity computers. Hadoop also contains a resource management tool called “Yet Another Resource
Negotiator” (YARN) [14] which manages the computing resources in the cluster. Lastly, Hadoop utilizes MapReduce which is a programming model for large scale data
processing. Hadoop provides users a tool to provide analysis on a large set of data but lacks the functionality to give real time analysis of the data. Using some of the similar principles that Hadoop was built on, tools like Apache Storm [6] have emerged to provide a distributed real time computation system. Storm has been built on a couple of key principles: extremely broad set of use cases, scalable, guarantees of no data loss, robust, fault-tolerant, and programming language agnostic. The flexibility of Apache
3
Storm allows for customization of data processing like data estimation. The complexity and type of the estimating algorithms can vary based on the desired use case. For
example, if the use case is to monitor and estimate an object that travels in a linear path, a linear algorithm could be used to provide an estimated value of its upcoming position. However, if the object travels in a nonlinear motion, the linear estimation algorithm would not be suitable for estimation. Under this use case of an object traveling in a nonlinear motion, an algorithm like a Kalman filter [14] could be applied for estimation. The Kalman Filter takes a series of measurements over time that contains inaccuracies and produces an estimate solution. Kalman filters have been vital in the implementation of the navigation systems of the U.S. Navy nuclear ballistic missile submarines, and in the guidance and navigation systems of cruise missiles such as the U.S. Navy's
Tomahawk missile and the U.S. Air Force's Air Launched Cruise Missile. It is also used in the guidance and navigation systems of the NASA Space Shuttle and the attitude control and navigation systems of the International Space Station [2].
1.2 Problem Specification
The problem that arises is how high velocity data be processed in an efficient manner so that it can be useful in the intended use case. Being able to access, process, and correlate the data in an efficient matter with minimal delay is critical in providing situational awareness which allows operators ample time to make decisions. In some environments where seconds matter, real time processing might not be good enough and only provides an operator minimal time to react. With the growing trends of drones, both for
commercial and recreational uses, this thesis explores use case of estimating an aircraft’s location.
4
1.3 Solution
With the flow of Big Data having high velocity, one way to provide situation awareness is to provide an operator with an estimated value based on historical trends of the data. This thesis utilizes the Apache Storm real time processing engine enhanced with a Kalman Filter to provide estimation of an aircraft’s location. This approach provides an architecture that leverages the real time processing engine for quick response as well as handling large amounts of data. Additionally, it also provides a flexible architecture to allow for an additional layer for estimation. By providing an estimation solution, this allows for an operator to have more time to react to an up and coming event like collision avoidance. The estimation algorithm presented in this thesis is suited for predicting locations; however the flexible architecture presented allows for the use of different estimations for different applications.
1.4 Contributions
1. With the use of the existing Traffic Collision and Avoidance Systems (TCAS) and ground based radars, pilots and air traffic controllers can be informed of any potential aircraft collisions. With the increase of both commercial and personal drones, the use of these specialized collision systems are not available on the smaller aircrafts. With the use of a GPS and the Kalman Filter estimation algorithm, the predicted flight path can be used to avoid airborne collisions.
2. In order to provide the operator/pilot ample time to adequately respond, processing of this data to provide estimation needs to occur near real time. The use of Apache Storm provides a distributed architecture that leverages high velocity data processing that is well suited for this application.
5
3. Existing approaches for flight estimation use Kalman filtering, but they do not take a Big Data approach. As systems become more complex, more data is generated at a faster rate. Hence a Big Data approach is needed. Secondly, a real time Big Data approach is called for as time is critical in this scenario. The main contribution is therefore a real time Big Data approach to flight path estimation.
4. The final contribution is the examination and measurement of the proposed system’s performance in terms of time.
1.5 Outline
The remaining chapters in the proposed thesis explore the applicable technologies, existing research, define the problem, and propose an approach. Chapter 2 provides a background of Big Data and then dives into tools designed for efficiently processing Big Data. In addition, the Kalman Filter algorithm used to estimate locations is further explored. Chapter 3 defines the problem that this thesis intends to solve with the proposed methodologies. Chapter 4 goes through the results of the test cases and concludes with Chapter 5 in summary.
6 CHAPTER II
REVIEW OF LITERATURE
This thesis focuses on the use of a real time processing engine, Apache Storm, coupled with a Kaman Filter to provide smoothing and estimation locations of an aircraft. To achieve the end result of the estimated location, a better understanding of each of the technologies in play is needed to incorporate them. First, “Big Data” is researched to understand what it is and the impacts of it. The second research area is the different approaches of data processing and how it is applicable to this thesis. Batch processing of large data sets will be examined to give a basis of processing techniques used in a non-real time environment. The principles of the batch processing will then be related into the real time processing solution and technologies. Next, various real time processing engines will be examined and the principles they are built upon. Apache Storm will be further examined to understand the architecture and how it handles processing. Finally, the Kalman Filter algorithm will be examined to understand the philosophy behind the algorithm and it’s intend applications.
7
Once the technologies utilized in the thesis have been examined, a review of existing literature will be presented to show how this thesis closes gaps with the current research.
2.1 Big Data
In this section, the definition of Big Data is discussed and how it relates to the topic of the thesis. Big data is the term for a collection of data sets so large and complex that it becomes difficult to process using on-hand database management tools or traditional data processing applications [3]. An analyst named Doug Laney Gartner in 2001 released a report that described the current data trends and classified these challenges as having three properties: Volume, Velocity, and Variety. These properties have grown to become known as the 3 V’s of Big Data. Volume is the amount of data that needs to be processed. As for today’s standard, the amount of data ranges in terms of Terabytes, Petabyte, or larger. The second “V” of the Big Data property is Velocity. This pertains to how fast the data is streaming in or out of data sources. For instance, take an online user interactive game where the events of simultaneous user’s behavior are needed to be captured by the game. The last property of Big Data is Variety, which refers to the type of data. The data may be structured or unstructured such as plain text, raw sensor data, multimedia data and more. The definition of Big Data has continued to expand over the years to contain additional properties. An additional V of Big Data is Variability which refers to the aspect of uncertainty of data. Due to the emphasis that has been placed on handling Big Data, improvements have been made in technologies such as data processing. The White House has gone so far to start a “Big Data Research and Development Initiative” in March of 2012 which has set aside commitments of excess of $200 million [1].
8
2.2 Data Processing
Depending on the desired application, different types of technologies are needed in order to satisfy the specific property of interest of Big Data. For instance, if an application needs to post process large volumes of data, the data could be processed using Batch processing. However, if real time analysis is needed in order to make quick decisions, processing should not be done using batches. The data would need to be processed in a real time manner. In this section, data processing is broken down into two sections: Batch and Real time Processing. Batch Processing is focused on processing large volume of data that is stored. Once batch processing has started on a data set, new incoming data will not be processed until the next iteration. This type of processing would not fit into gathering situational awareness near real time. A popular commonly known tool to process large data sets is Hadoop [12]. Some of the same concepts used in Hadoop for batch processing are utilized in real time processing engines. Applications that focus on high-velocity data streams that need real time analytics will need to utilize a real time processing engine rather than batch processing. There are a variety of applications for processing data real time. This thesis explores a couple of the options for processing real time data but will focus on Apache Storm [6]. Storm has become to be known as the “Hadoop” for real time processing.
2.2.1 Hadoop
Apache Hadoop [12] is an open source project responsible for storing, processing, and analyzing large data sets in a distributed environment. Hadoop possesses a flexible and fault tolerant design that is geared to handle large volume of data rather than a high velocity. The Hadoop architecture is designed after a master/slave model. There is a single master server which is called the jobtracker and slave servers called tasktrackers.
9
Jobs are passed into the jobtracker which stores them into a queue. The jobtracker manages the jobs assigned to the tasktrackers. Tasktrackers are responsible for executing the jobs. Hadoop consists of two major components: MapReduce and Hadoop Distributed File System (HDFS). The MapReduce covers the processing aspect of Hadoop where the HDFS covers the storage. MapReduce is the framework that distributes computations over multiple nodes to allow for parallel processing which complements the Batch processing approach on large volume of data. In order for the data to be processed in parallel, the data has to be separated into independent blocks. The Hadoop Distributed File System (HDFS) is a distributed file system designed to run on commodity hardware [4] and is tuned to support large data sets.
2.2.2 Yahoo! S4
Yahoo! S4 [13] is a platform that is intended to process data real time unlike the batch processing approach as Hadoop. S4 stands for Simple Scalable Streaming System which was introduced in October 2010 and inspired by the MapReduce and Actors model. S4 is a general-purpose, distributed, decentralized, partially fault-tolerant, scalable, pluggable platform that allows programmers to easily develop applications for processing continuous unbounded streams of data [5]. The design of S4 is to allow for consumption of data from a stream, compute intermitted values, and then publish the results as a new stream. A couple of use cases that provided motivations for S4 was to personalized Searches, Twitter Treads, and analysis of stock trading. The S4 Architecture consists of the following components: Node, Server, Application, Processing Elements (PEs), and Streams. In the S4 architecture there can be an unlimited number of nodes in which each node contains one server process. The server process is responsible for managing the
10
applications. The applications are a graph comprised of Processing Elements (PE). Processing Elements within S4 are responsible for performing computations on the streams. S4 can contain multiple PEs in which they use data events to communicate with each other.
2.2.3 Apache Storm
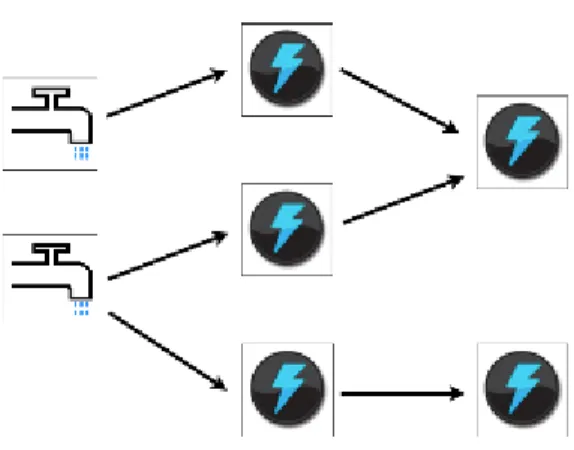
Apache Storm [6] is another tool created to handle real time processing of data streams. Apache Storm is an open source, distributed and fault-tolerant real time computation system. Storm provides similar functionality as a MapReduce job but with no termination. It essentially has to be terminated manually to stop the computational process. Storm makes it easy to reliably process unbounded streams of data, doing for real time processing what Hadoop did for batch processing [6]. The major components of the Storm architecture are called spouts and bolts. A spout is a source of data. The source of data could be from a queuing system or reading streaming data. The spout provides the data to the bolts as shown in Figure 2. An example of this in the social media world is the public streams made available by Twitter. Twitter offers sample streams of data in which an application can attach to and process. In the world of Apache Storm, this would be an example of a spout. A bolt processes the data from the spout and produces an output stream. The bolt contains the majority of the computation logic. One of the possibilities of a bolt is to write the data to a database. The intent of the spouts and bolts were that they were inherently parallel which is similar to how the mappers and reducers are parallel in Hadoop. The network of how the spouts and bolts tie together is called a topology. The below image was taken from the Apache Storm website (http://storm.incubator.apache.org/)
11
Figure 2 Storm Topology
Some of the appealing characteristics that Storm possesses are that it is fast, scalable, fault-tolerant, and reliable. In terms of processing speed, Storm has been benchmarked on a computer with a 2x Intel [email protected] and 24GB of Memory in which one million 100 byte messages per second were processed per node. In terms of reliability, Storm guarantees that each record will be processed at least once. Storm also allows for monitoring of the workers and nodes within the cluster. If one of these items fails, Storm has the capability to automatically restart them, thus the fault-tolerant benefit. The distribution of Storm cluster is achieved by the use of three different types of nodes: Nimbus, Zookeeper, and Supervisor. The Nimbus node is the master node. It is responsible for launching and monitoring workers across the cluster. The Zookeeper provides the coordination between the Nimbus and the Supervisors. The Supervisors listen for work assignments and react accordingly. Apache Storm has become a more popular real time processing tool and users include companies like The Weather Channel, WebMD, Groupon, and Twitter just to name a few.
12
2.3 Kalman Filter Algorithm
For this thesis, various estimation algorithms were researched in order to see their applicability in estimating the location of an aircraft. The architecture presented in this thesis provides the flexibility to use various estimation algorithms but the intended use case of estimating aircraft’s location restrict which algorithms are well suited. Due to the aspect of real time estimation, the researched algorithms need to have minimal delay in its calculation. Additionally, knowing the expected movement of the objective object (i.e. airplane) the estimation algorithm must be suitable for accounting for this type of movement.
A simple linear prediction algorithm [17] could have been used for estimation objects that move in a linear fashion during discrete time intervals. This algorithm is not computationally expensive; however the use case for estimating aircraft location was not suited for this algorithm. An additional algorithm that was considered for the estimation was the moving average [18]. The disadvantages associated with a moving average is that a series of data points have to be retained in order for the algorithm to compute its solution. Also, the new trends in the data tend to lag in actual behavior due to a series of points that make up the average. For this application, the use of a moving average is better suited than a simple linear prediction but the algorithm still has some disadvantages that could be overcome through the use of another algorithm. Lastly, the Kalman Filter [2] was examined to see the potential use cases that this algorithm has been used for. Kalman Filters has been used in in estimating objects that move linearly in nature with some Gaussian noise in their solution. The origins of this algorithm date back to the 1960 in which Rudolf Kalman realized the applicability of this algorithm
13
when he visited the NASA Research center in determining the trajectory estimation of Apollo. This algorithm has later been utilized in the development of various navigation, guidance, and control systems used in the United States Military. For this thesis, the Kalman Filter will not be fully examined in understanding the theory behind it, rather will be used as a known algorithm that is well suited for estimating location of airborne moving objects.
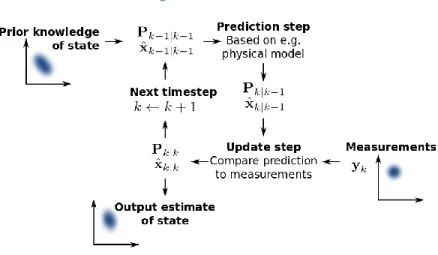
The Kalman filter, also known as linear quadratic estimation, is an algorithm that uses a series of measurements observed over time, containing noise and other inaccuracies, and produces estimates of unknown variables that tend to be more precise that those based on a single measurement alone [2]. The below figure was taken from http://en.wikipedia.org/wiki/Kalman_filter to provide more details into the flow and logic of the Kalman Filter.
Figure 3 Kalman Filter
2.4 Existing Literature
The primary uses for tools that predicted upcoming behaviors are in the area of real time analytics for trends on the internet. StreamAnalytix [7] claims that by early detection with
14
real time streaming, operators can benefit by cutting preventable losses, gain operational insights, and seize new opportunities. Included in this are analytics of sensor based data, machine generated (Machine to Machine) data, logs, clickstreams, advertising data, and processing of financial data and transactions in real time [7]. In terms of the aviation industry, there is a lot of interest in Big Data and how to handle it. To get a sense of how much data is created by an aircraft, a single engine on an aircraft can create over 20 terabytes of data per engine every hour. Industry leaders are interested in this data to provide estimation about when certain parts of the engine will fail. This allows them to replace these parts before a failure occurs, thus saving money and down time of the aircraft. Boeing’s Internal Research Team and other industry partners have published a paper for Predictive Analytics with Aviation Big Data. The end result of this research was a novel analytics system that enables query processing and predictive analytics over streams of big aviation data [8]. This system was able to correlate flight plans with live track data near real time. As far as the author is aware, work similar to that reported in this thesis has not been described in the literature. The Kalman Filter has been utilized on many existing products and research for estimating location. My thesis combines Big Data technologies to provide estimation real time. This thesis focuses on estimating upcoming position of an aircraft, but the proposed architecture enables the use of swapping or combining with the estimation algorithm for other desired applications. Currently, many commercial aircrafts contain onboard systems to avoid air collisions known as Traffic collision Avoidance Systems (TCAS). These systems require a computer, antenna, and some type of display for the pilot to warn of approaching. Based on the proximity of approaching aircrafts, various types of alerts will be issued for pilot
15
awareness. Besides onboard TCAS, air traffic controllers utilize visual methods as well as ground based radars to detect and monitor traffic [16].
16 CHAPTER III
METHODOLOGY
The challenges of handling Big Data have allowed for continued research and
advancement of new applications and tools. The application examined for this thesis focuses on handling and processing data quickly as well as being capable of handling large amounts of data. In time sensitive operational environments, real time processing of data might not be good enough to provide an operator or analyst minimal time to react to an upcoming event. This thesis provides an architecture that leverages the benefits of a real time processing engine coupled with an additional layer to allow for estimation. By providing estimation, this allows an operator to have more time to prepare for and react to a future event. Specifically, this thesis focuses on the use case of providing estimation of an aircraft’s position. One use of this estimation solution could be utilized in preventing air collisions. With the recent growth in the popularity of drones, both commercial and recreational, the amount of aircrafts flying will continue to rise and the method for detecting and monitoring air traffic will need to improve. This growth further expands the need for an architecture that can handle large amounts of data.
17
There are existing companies and projects that utilize the technologies researched to gain early detection with real time streaming to gain operational insights. However, this thesis goes one step further to estimate the upcoming trends in the data. The estimation
algorithm presented in this thesis is suited for predicting locations; however the architecture presented allows for the use of different estimation solutions for different applications.
3.1 Architecture
This thesis is broken down into different technology blocks with the end goal of
integrating the technology blocks into a final application. The overall goal of this thesis is to obtain high velocity geo-positional data from multiple aircrafts and be able to estimate their upcoming position. The estimation and actual data points will be later compared to see how close the estimated state was to actual state. The time for the estimated state will also be adjusted to see how it affects the Kalman filter in predicting the up and coming state. Additionally, use of internal timers will be inserted throughout the Storm’s architecture to see how the Storm processing is effected by adjusting the amount and frequency of data that is flowing through the architecture.
3.2 Setup
For processing and estimating an aircraft’s position in a real time manner, this thesis uses Apache Storm coupled with Kalman Filter processing. The below sections examine how each of the technologies were setup and used. The Java programming language and the Eclipse IDE were used for the development of this project. The tests were performed on a single computer. The Processor used was an Intel Core i7-2670 QM CPU @ 2.20 GHz
18
with 8 GB of RAM. The functionality of the application and the effectiveness of the Kalman Filter can be proven in this environment.
3.3 Apache Storm
The two main components for configuring Apache Storm are the source of the data and the processing component of that data. These components are called the spout and bolt respectively. How these components are configured make up the defined Storm
topology. The below figures identify the various Storm topologies that are examined in this thesis.
Figure 4 Single Aircraft Topology
Figure 5 Redundant Aircraft Topology Kalman
Filter
For use within this project, a spout has been created called “TextFileSpout” and a bolt “KalmanFilterBolt”. The details of the Spout and Bolt used in this configuration are
19
examined in more detail below. The figure below is a screenshot of the source code that defines a single aircraft topology configuration.
Figure 6 Example Source Code - Single Aircraft Topology
For the use case of redundant bolts tied to a single spout, the bolts will be iterated through and all tied to the dependent spout. Below is the sample source code used in this
configuration.
Figure 7 Example Source Code - Redundant Aircraft Topology
3.3.1 Spout
A spout is the source of data that will be used by the bolt for computation. A spout can read its data from a queueing broker like Kafka or it can generate its own data stream. For this thesis, the spout reads the data directly from a file that has been previously recorded with aircraft positional data. In order to minimize the performance impacts of reading from the hard drive, all of the sensor’s data is loaded into memory when Apache Storm is initialized. By reading from memory, this will allow for simulation of data at faster input rates to stress the performance of Apache storm. Additionally, the use of timers (java.lang.System.nanoTime) within the source code help monitor the emitted frequency of each record to the bolt. Additionally, timers are also inserted to monitor the time it takes a record to be transmitted from the spout to bolt.
20 3.3.1.1 Data Source
The first piece of the thesis is to identify a data source. This thesis uses aircraft
positional data for the use of the Kalman Filter to provide an estimate for position. For use within this thesis, only the latitude and longitude values are used within the
estimation model which in essence is the x and y attributes in 2 dimensional space. Altitude, the z attribute in 3 dimensional space, could have been added to the estimation model to provide further validity in the estimated solution. However, the use of latitude and longitude values provide enough insight into the feasibility of this architecture and application. Depending on the data source, the Kalman Filter can be adjusted to accept different sets of parameters like velocities. The position data was obtained from a
previously recorded flight from aircraft navigation system aboard a Cessna Caravan. The data rate of the recorded aircraft’s position data is at 30 Hz. This data was stored to a text file. Only a portion (~157 minute segment) of the aircraft’s positional data will utilized instead of the full flight plan. This was the longest segment of recorded data that was available. Other system testing and objectives were ongoing which required various restarts, thus shorter records.
3.3.2 Bolt
The bolt is the computational piece that contains most of the processing logic within the Storm topology. A bolt can process any number of streams from either a spout or another bolt. For this thesis, the bolt will contain the Kalman Filter logic. The bolt will take the incoming raw aircraft positional data and process it using a Kalman Filter. The raw and estimated navigation data will be compared to see the viability of the final application. Similar to the spouts approach for loaded positional data into memory, the bolt will store its estimated solution into memory. Once the storm cluster has been commanded to
21
shutdown, all of the data points within memory are written out to a file for analysis. Also, timers are inserted in two places within the bolt. One is at the very beginning on receiving a new record. This time will be compared against when the spout “emitted” the record. This allows seeing any delay that is introduced in Storms internal processing. Finally, a timer is placed at the end of the Kalman Filter bolt. This allows the processing time of the bolt to be examined in order to see any potential limitations in using this algorithm.
3.3.2.1 Kalman Filter
For use within this thesis, a known implementation of the Kalman Filter from Apache Commons Math is utilized. By using a known implementation of the Kalman Filter, it will reduce the risk of introducing errors in the analysis of the data. The Kalman Filter is an existing algorithm that has been used in a variety of applications for estimating and smoothing noisy sensor positions. Depending on the setup of the Kalman Filter, estimating can be done on 1-Dimension, 2-dimenional, and more complex scenarios. A Kalman Filter is comprised of a Process Model and a Measurement Model. For the Process Model, the following matrices were used. State Transition Matrix (A) is defined as shown below where dt is 1/frequency of the data. For the 30Hz case, dt would be 1/30. 𝐴 = [ 1 0 𝑑𝑡 0 0 1 0 𝑑𝑡 0 0 1 0 0 0 0 1 ]
22 𝐵 = [ 0 0 0 0 ]
The Process Noise Covariance Matrix (Q) is defined as shown below.
𝑄 = [ 𝐿𝑎𝑡𝑃𝑜𝑠𝑖𝑡𝑖𝑜𝑛𝑁𝑜𝑖𝑠𝑒 0 0 0 0 𝐿𝑜𝑛𝑃𝑜𝑠𝑖𝑡𝑖𝑜𝑛𝑁𝑜𝑖𝑠𝑒 0 0 0 0 1 0 0 0 0 1 ]
The LatPositionNoise and LonPositionNoise were set to 0.0001 degrees which is the noise in the location. The precision associated with 0.0001 degrees equates to 11.132 meters at the equator. The precision of the associated noise varies as you move away from the equator [15]. The initial state estimate is needed for the initialization of the Kalman Filter. The first record that is received by the bolt is used to initialize this vector. Since the velocities are not a received input, 0’s are used within the vector. The Initial State Estimate (x) is defined as shown below.
𝑥 = [ 𝐿𝑎𝑡𝑖𝑡𝑢𝑑𝑒 𝐿𝑜𝑛𝑔𝑖𝑡𝑢𝑑𝑒 0 0 ]
Lastly is the Initial Error Covariance Matrix (P0). Since the Initial position is known, the default is similar to the previous Latitude and Longitude Noise. Since the initial
velocities are not known a high variance is provided.
𝑃0 = [ 𝐿𝑎𝑡𝑃𝑜𝑠𝑖𝑡𝑖𝑜𝑛𝑁𝑜𝑖𝑠𝑒 0 0 0 0 𝐿𝑜𝑛𝑃𝑜𝑠𝑖𝑡𝑖𝑜𝑛𝑁𝑜𝑖𝑠𝑒 0 0 0 0 100000 0 0 0 0 100000 ]
23
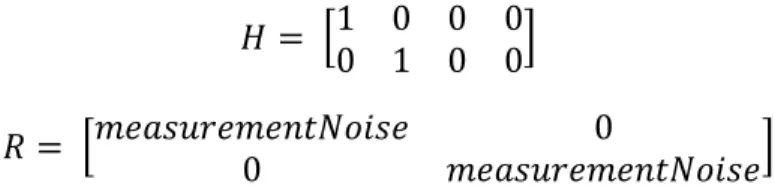
The Measure Model Definition is comprised of the Measurement Matrix (H) and the Measurement Noise Covariance Matrix (R). Since this thesis only observes the position updates, the matrixes are defined as the following
𝐻 = [1 0 0 0 0 1 0 0]
𝑅 = [𝑚𝑒𝑎𝑠𝑢𝑟𝑒𝑚𝑒𝑛𝑡𝑁𝑜𝑖𝑠𝑒 0
0 𝑚𝑒𝑎𝑠𝑢𝑟𝑒𝑚𝑒𝑛𝑡𝑁𝑜𝑖𝑠𝑒]
After the Process and Measurement models have been defined, these serve as input parameters into the Kalman Filter as shown below.
Figure 8 Example Source Code – Kalman Filter Instance
3.4 Test Cases
The final aspect of the thesis is to analyze the integrated product. This will look at the accuracies of the estimation algorithms solution. The actual aircraft location will be compared against predicted location. The overall system performance will be examined to determine if the proposed system would be viable to provide real time situational awareness and estimation. Below are the test cases that will be executed for this thesis. Based on the findings of this thesis, potential targeted environment for this application will be identified. For instance, instead of using the Kalman Filter for estimating a position, maybe the system could replace that algorithm with one that is more suitable for estimating the stock market. This could potential give traders a look ahead and
24
3.4.1 Apache Storm Performance
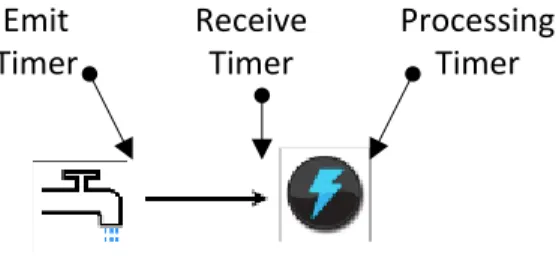
The overall performance of Apache Storm will be analyzed under various test cases. One test case explored is the number of records emitted per second which is adjusted to see the impacts to Storm’s performance. Within the source code, a nanosecond timer is added to the record every time the Spout calls emit on a new record. This helps identify the frequency rate at which the actual records are being transmitted to the bolt. The next step was to determine how long it took the record to get to the bolt once the record was emitted from the spout. A timer was added to the bolt within the Execute method. Finally, after all of the processing has been done on the Tuple, a timer was added to see how long it took for the Kalman Filter to process a record. The below figure identifies the location of each timer used to measure performance.
Figure 9 Storm Topology Timers Emit Timer Receive Timer Processing Timer
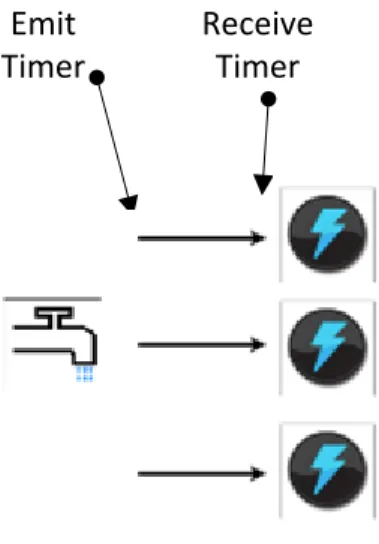
3.4.1.1 Spout to Bolt Performance
For this series of testing, only one spout was utilized and the number of bolts was increased. The spout was set at an emittance rate of 30 Hz. The storm topology was set to run for 3 minutes while timers were used to monitor performance. The below figure identifies the test case of 1 spout with 3 bolts. This test case will explore increasing the number of bolts and examining the latency.
25
Figure 10 Spout to Bolt Test Case Emit
Timer
Receive Timer
3.4.1.2 Kalman Filter Processing Time
The Kalman Filter processing time will be examined to see if the algorithm presents any type of bottleneck to the Storm topology. The input frequency of the spout will be increased and the Kalman filter processing time will be re-evaluated. Based on the results of this test case, a maximum input frequency could be determined if the Kalman Filter processes a limitation. The below figure shows where in the Storm topology the use of timers are inserted in order to examine the Kalman Filter Processing time.
Figure 11 Kalman Filter Processing Time Test Case Receive
Timer
Processing Timer
3.4.2 Predicted vs Actual Location
The next test case will examine the predicated location versus the actual location of the aircraft at that time in the future. All test cases will be performed at 30 Hz which was the recorded rate of the original data. The original recorded data was a total of 282,951
26
records which equates to 9,431.7 seconds which is about 157 minutes of flight data. The data set used did not have any missing values and contain a timestamp, latitude, and longitude. The average delta will be calculated for what the estimated data point was versus the original data at that estimated time. This calculation will be performed for both the latitude and longitude estimates. Inspection of these deltas will show the usefulness of the estimation and how far in the future the estimate position can be provided before the estimated solution is no longer useful in predicting a location.
27 CHAPTER IV
FINDINGS
The following section identifies the results associated with the performance of Apache Storm coupled with a Kalman Filter processing bolt. Various aspects of the Apache Storm processing performance are examined to see if there are any potential bottlenecks that possess a limitation on estimating an aircraft’s location. To assess any potential limitations, various timers are inserted in the architecture to expose the latency during the processing. Additionally, the predicted versus actual aircraft location is examined to see the behavior of the Kalman Filter estimation. The tests cases that are examined in this chapter were described in the previous Section 3.4 Test Cases. After all of the test cases have been examined, Chapter V will conclude with a summary of the findings and the feasibility of this architecture to estimate the aircraft’s location.
4.1 Apache Storm Performance Results
The following subsections have captured the performance of the Apache Storm
architecture on a single node computer. This performance evaluates the feasibility of the architecture and identifies any potential bottlenecks that might pose a limit on the test case. These series of tests evaluate the various aspects of the architecture:
1. Frequency of records inserted into the system
2. Spout to Bolt performance with using multiple bolts per one spout 3. Bolt Processing Time with varying record frequency
28 4.1.1 Record Input Frequency
The goal of this series of testing is to adjust the frequency of the input records and monitor the performance of the architecture. This testing was performed using only one spout and one bolt with varying input record frequency. By the use of timers, the performance of the architecture can be monitored to see the impacts. To keep the input frequency as close to the desired rate, all of the position records were loaded into memory to reduce the reading limitations of the hard drive during the initialization of the Storm topology. The below table identifies the desired emittance rates of each record. Each record emitted contains the aircraft’s latitude and longitude details.
Table 1 Expected Record Emittance Rate Frequency (Hz) Record Emitted Rate
30 Every 0.03 seconds 60 Every 0.016 seconds 120 Every 0.0083 seconds 240 Every 0.00416 seconds 480 Every 0.002083 seconds 960 Every 0.0010416 seconds
The below table and graphs identify the performance of Apache Storm with the Kalman Filter processing bolt when the input frequency was set to 30, 60, 120, 240, 480, and 960 Hertz. The record emittance rate was stopped at 960 Hz to see if trends in performance can be seen based on the increased emittance rate. Additionally, typical navigation systems do not provided positional data at rates greater than 1000 Hz. Only the first 5000 records were analyzed for consistency between the various test cases.
29
Figure 12 Test Case 30 Hz Emittance Rate
30
Figure 14 Test Case 120 Hz Emittance Rate
31
Figure 16 Test Case 480 Hz Emittance Rate
32
Based on the varying input record frequency, the performance of Apache Storm with the Kalman Filter was not degraded during these test cases and was able to keep up with the required demands of the inputted record frequency. As seen in the 960 Hz Test Case, there were more processing spikes then in the previous test cases. Even though there were more performance spikes in 960 Hz processing, the overall performance of Apache Storm was able to recover to provide nominal performance. The below table identifies that the average emittance rate and the desired emittance rate were very similar for this simulation. The average times for the Spout to Bolt and the Bolt Processing time improved based on the increase in record frequency.
Table 2 Summary of Varying Emittance Rates Results Frequency (Hz) Desired Emit Rate (sec) Avg Emit Rate (sec)
Avg Time From Spout to Bolt (sec)
Avg Bolt Processing Time (sec) 30 0.0333333 0.0333740 0.0005070 0.0001410 60 0.0166667 0.0161747 0.0004000 0.0001127 120 0.0083333 0.0081926 0.0003869 0.0001085 240 0.0041667 0.0041174 0.0003245 0.0000899 480 0.0020833 0.0020925 0.0002639 0.0000777 960 0.0010417 0.0012921 0.0002131 0.0000593
4.1.2 Spout to Bolt Performance Results
For this series of testing, only one spout was utilized and the number of bolts was increased. The spout was set at an emittance rate of 30 Hz. The storm topology was set to run for 3 minutes while timers were used to monitor performance. A total of 5 test cases were executed under this scenario with the following results. The below table shows the minimum, maximum, and average time it takes for a record to be transmitted from a single Spout to varying number of Bolts.
33
Table 3 Spout to Bolt Performance
Number of Bolts Minimum Time (NS) Maximum Time (NS) Average Time (NS)
1 79306 31392327 454920 3 60179 31058312 470496 5 68110 47079860 584445 10 65777 44265453 842642 20 68109 247559145 1191445
The results of this test case identified that as the number of bolts is increased; the average time for a record to get from the Spout to Bolt was also increased.
Figure 18 Average Time from Spout to Bolt
The results show that Storm messaging to the number of bolts is affected. Further
examination of the internal messaging architecture of Storm was researched to provide further insight into this behavior. This test case was performed on a single computer, so network latency should not have been seen in the reflected data. Receiving messages in tasks work differently in Storm’s local mode and distributed mode. In local mode, the tuple is sent directly to an in-memory queue for the receiving task. In distributed mode,
34
each worker listens on a single TCP port for incoming messages and then routes those messages in-memory to tasks [9]. Based on this explanation, this test case was run under the local mode and the performance seen would not be expected if it was a distributed cluster using Ethernet communications. However, if too many bolts are executing on the same node there is a potential of the increased time for messages to get to the processing bolts due to the in-memory queue.
4.1.3 Kalman Filter Processing Time Results
After all of the internal Storm processing has been completed to get the Tuple to the Bolt, a timer was added to see how long it took for the Kalman Filter to process a record. The time it takes the Kalman Filter algorithm to execute was examined to see any potential bottlenecks are within the algorithm and to see if it is feasible within Storm. The below table identifies the various average processing time the Kalman Filter algorithm took based on the increasing record frequency.
Table 4 Kalman Filter Bolt Performance
Record Frequency (Hz) Average Processing Time (NS)
30 133062 60 91100 120 62898 240 88152 480 33938 960 26974
Based on the results of examining the Kalman Filter Bolt performances, there does not appear to be any correlation to degraded performance in the Bolt processing time when the frequency in the input stream is increased. Therefore, this Kalman Filter does not impose a bottleneck in the Storm processing engine with input record frequency up to 960 Hertz.
35
4.2 Predicted vs Actual Location Results
The goal of this series of tests was to compare the predicted location versus the actual location using the Kalman filter to estimate. All test cases were performed at 30 Hz which was the recorded rate of the original data. The average delta was calculated for what the estimated data point was versus the actual data at that estimated time. This calculation was performed for both the latitude and longitude estimates in decimal degrees. The below table identifies the average error delta in the prediction location versus actual location.
Table 5 Predicted vs Actual Location
Number of Cycles Latitude Average Delta Longitude Average Delta
30 (1 Second) 0.000013653 0.000039703 300 (10 Seconds) 0.000414704 0.000766145 900 (30 Seconds) 0.001852628 0.004111612 1800 (60 Seconds) 0.004797343 0.015274288 3600 (120 Seconds) 0.008324897 0.048876462 5400 ( 180 Seconds) 0.012156300 0.075083844
For reference, the aircrafts flight path is shown in the figure below. This shows that the flight path that was used in this analysis was not linear in nature.
36
Figure 19 Actual Flight Path
Of the 6 test cases executed, the 30 cycles and the 3600 cycles were examined closer. The 30 cycles test case means that the prediction is made 1 second ahead of the aircraft’s reported position. 3600 cycles is predicting where the aircraft would be in 120 seconds. This prediction is made for every input record that is received which is 30 Hz for these cases. Therefore, the prediction is continuously being updated at the same rates as input records are being received. The below graphs include a close-up look in the behavior of the predicted latitude location versus the Kalman filter predicted location.
37
Figure 20 Predicted vs Actual Location – 30 Cycles
38
Based on the results of the testing, the error associated with estimated location increased with the increasing estimating time. The Kalman Filter predicted locations in the 3600 cycle graphs had larger spikes in the estimated location versus the 30 cycle graphs. Assuming that 0.0001 degrees is about 11.1 meters around the equator, the average error for 30 cycles would be about 4.4 meters where the 3600 cycles would be about 5,440 meters. To potentially reduce the error estimation, adding knowledge of the aircraft’s altitude and velocities as an input into the Kalman Filter model would improve this fidelity. An additional factor to be considered when the estimations are being made include the route the airplane flew. The more turns and maneuvers the airplane makes, the expected error would increase in the estimation model. Additional consideration was given for adjusting the record input frequencies. Adjusting the record input frequencies would not change the predicted estimated state or the associated sigmas. The increased in the record input would only affect the performance associated with the architecture, which is covered in section 4.1. The only adjustment to the predicted state would be how far “ahead” you would like to predicted. Table 5 goes into the other test cases that were run to show the error when increase how far ahead you predicted.
39 CHAPTER V
CONCLUSION
Apache Storm has been used in various applications to accommodate the increasing flow of high velocity “Big Data”. The objective of this thesis was to utilize this real time processing engine coupled with a Kalman Filter and determine if this architecture could be utilized in estimating the location of an aircraft. Various tests cases were performed in order to understand any limitations that might be in the Storm architecture or the Kalman Filter algorithm.
In the tests cases focused on the performance of Apache Storm, overall there was no degraded performance that present limitations on the architecture. When increasing the number of records emitted from the spout, Apache Storm was able to handle records at 960 Hertz. Additionally, the timers associated with processing speed were well within limits and were not at a processing boundary threshold. When one spout was used while the number of bolts was increased, there was an observed processing latency that was increasing. This appears to be attributed to the testing environment and would be less apparent if the test case was executed in a distributed environment. Also, the processing benefit of Apache Storm is improved when more processing nodes are added to the cluster and not all processing residing on a single node. Finally, the Kalman Filter algorithm as a processing bolt did not poses any limitation within Apache Storm.
40
The Kalman Filter algorithm provided estimation for the upcoming location of an aircraft. Based on the findings, the further out that the estimation was to use to predict the location, there was more associated error estimating that location. Another factor that would increase the error in location is the flight path of the aircraft. If the aircraft was flying a more “straight and level” flight path, one could assume less error in actual versus estimated position versus an “S”-turn flight path. Additionally, the Kalman Filter used in this thesis, simply took into account the Latitude and Longitude parameters. The Kalman Filter algorithm and be modified to increase the input parameters, such as Altitude and Velocities, to provide a more accurate estimation.
5.1 Thesis Contribution
This thesis provides an architecture that leverages a real time processing engine for high velocity data for quick responses as well as handling large amounts of data. Additionally, it also provides a flexible architecture to allow for an additional customizing processing layer for location estimation. By providing an estimation solution, this allows for an operator to have more time to react to an up and coming event like collision avoidance as well as overall situational awareness. With the growing trend of unmanned aircrafts, there will be a growing importance to monitor and estimate the aircraft’s location to avoid any collisions. This flexible distributed architecture provides a means to continue to grow with the increase in number of aircrafts. Lastly, the estimation algorithm
presented in this thesis is suited for predicting locations; however the flexible architecture presented allows for the use of different estimations for different applications.
41
1. A more robust Kalman filter implementation. Additional inputs into the Kalman Filter would be a 3 dimensional (altitude) as well as the respective velocity components (X, Y, and Z).
2. Implement and Test the architecture across multiple computed nodes in a distributed architecture. Additional testing could include, the various
Architecture induced delays, fail over testing (loss of a processing node), and redundancy.
3. Different use cases instead of aircraft estimations. This could include stock market trends.
42 REFERENCES
[1] White House Office of Science and Technology Policy, “Obama Administration unveils Big Data Initiative: Announces $200 Million in New R&D Investments”, March 29, 2012
https://www.whitehouse.gov/sites/default/files/microsites/ostp/big_data_press_rel ease_final_2.pdf
[2] Zarchan, Paul; Musoff, Howard, Fundamentals of Kalman Filtering: A Practical Approach. American Institute of Aeronautics and Astronautics, Incorporated. ISBN 978-1-56347-455-2, 2000
[3] Snijders, C.; Matzat, U.; Reips, U. "Big Data': Big gaps of knowledge in the field of Internet". International Journal of Internet Science. 7: 1–5, 2012.
[4] Apache Hadoop, HDFS Architecture Guide, Date of Access: 3/17/2017, http://hadoop.apache.org/docs/r1.2.1/hdfs_design.html#Introduction [5] Neumeyer, L.; Robbins, B.; Nair, A.; Kesari, A. “S4: Distributed Stream
Computing Platform”. IEEE International Conference on Data Mining Workshops, 2010
[6] Apache Storm, Date of Access: 3/17/2017, http://storm.incubator.apache.org/ [7] Streamanalytix, Date of Access: 3/17/2017, http://streamanalytix.com/
[8] Ayhan, S. ; Pesce, J. ; Comitz, P. ; Sweet, D ; Bliesner, S, ; Gerberick, G. , “Predictive Analytics with Aviation Big Data”; Integrated Communications, Navigation and Surveillance Conference, 2013
[9] Apache Storm, Message Passing Implementation, Date of Access: 3/17/2017, http://storm.apache.org/documentation/Message-passing-implementation.html [10] Weil, Kevin, “Measuring Tweets.” Twitter Official Blog. Feb 22, 2010,
43
[11] Laney, Doug, “3D Data Management: Controlling Data Volume Velocity, and Variety”, Meta Group Inc. ADS 6 Feb 01.949, February 6, 2001, Date of Access: 3/17/2017, https://blogs.gartner.com/doug-laney/files/2012/01/ad949-3D-Data-Management-Controlling-Data-Volume-Velocity-and-Variety.pdf
[12] Apache Hadoop, Date of Access: 3/17/2017, http://hadoop.apache.org/ [13] Yahoo! S4, Date of Access: 3/17/2017, http://incubator.apache.org/s4/
[14] Kalman, R.E., “A new Approach to Linear Filtering and Prediction Problems, Transactions of the ASME Journal of Basic Engineering Vol 82 Series D, pages 35-45, 1960
[15] Robinson, Arthur H., et al. Elements of Cartography, 5th ed. New York: John Wiley & Sons, 1984. (pp 64-66, Appendix B)
[16] Air Traffic Plans and Publication, Order JO 7110.65W
https://www.faa.gov/documentlibrary/media/order/atc.pdf, Date of Access: 3/17/2017
[17] Barnett, R.A.; Ziegler, M.R.; Byleen, K.E., College Mathematics for Business, Economics, Life Sciences and the Social Sciences (11th ed.), Upper Saddle River, N.J.: Pearson, ISBN 0-13-157225-3, 2008
[18] Chou, Ya-lun, Statistical Analysis, Holt International, ISBN 0-03-089422-0, section 17.9, 1975
VITA
Joseph Raymond Houde Candidate for the Degree of
Master of Science
Thesis: REAL TIME AIRCRAFT POSITION ESTIMATION UTILIZING APACHE STORM
Major Field: Computer Science Biographical:
Education:
Completed the requirements for the Master of Science in Computer Science at Oklahoma State University, Stillwater, Oklahoma in May, 2017.
Completed the requirements for the Bachelor of Science in Computer Science and Mathematics at Southern Methodist University, Dallas, Texas in 2003. Experience:
Systems Engineering Manager / Senior Software Engineer I, Feb 2009 - present L3 Technologies / Aeromet, Tulsa, OK
Contributed to the development of requirements, design, implementation, and verification for the FMV project. Participated in formal customer meetings throughout the various product stages. Continued to lead the FMV Software team through multiple successful release cycles while ensuring customer satisfaction. Senior Software Engineer I, Jan 2006- Feb 2009
L-3 Communications, IS, Greenville, TX
Contributed to all phases of the CMMI Level 5 Software development of an airborne mission system. The mission system operated in a multi-node environment on a Windows platform and interfaced with a variety of external hardware devices and sensors.
Associate Programmer / Analyst, Oct 2004- Jan 2006 Quest Diagnostics Inc., Dallas, TX
Developed and led a dozen plus projects using MUMPS. These solutions included enhancements as well as bug fixes to Antrim’s Microbiology paperless software. Developer, Aug 2003- Oct 2004
Pinnacle Engineering, Houston, TX
Designed web applications written in JSP and HTML that connects to a MySQL database. Apache Tomcat web server was used to host these applications.