Tax Enforcement Using a Hybrid
Between Self- and Third-Party
Reporting
WP 19/11
July 2019
Sarah Clifford, University of Oxford
Panos Mavrokonstantis, London School of Economics
Working paper | 2019
This working paper is authorised or co-authored by Saïd Business School faculty. The paper is circulated for discussion purposes only, contents should be considered preliminary and are not to be quoted or reproduced without the author’s permission.
Tax enforcement using a hybrid between self- and third-party
reporting
Sarah Clifford and Panos Mavrokonstantis†
June, 2019
Abstract
We study behavioural responses to a widely-used tax enforcement policy that combines ele-ments of self- and third-party reporting. Taxpayers self-report to the tax authority but must file documentation issued by a third-party to corroborate their claims. Exploiting salary-dependent cutoffs governing documentation requirements when claiming deductions for charitable contribu-tions in Cyprus, we estimate that deduccontribu-tions increase by £0.7 when taxpayers can claim £1 more without documentation. Second, using a reform that retroactively shifted a threshold activating documentation requirements, we estimate that at least 64% of the response is purely a reporting adjustment. Finally, reporting thresholds affect the responsiveness to tax subsidies.
Keywords: Tax enforcement ·Tax compliance ·Charitable giving ·Tax design
†
Clifford: University of Oxford, Department of Economics, Nuffield College and The Centre for Business Taxation, 1 New Road, Oxford OX1 1NF, United Kingdom (e-mail: [email protected]), Mavrokonstantis: De-partment of Economics, London School of Economics, 32 Lincoln’s Inn Fields, London, WC2A 3PH, United Kingdom (e-mail: [email protected]). We are grateful to Frank Cowell, Artur Doshchyn, Niels Johannesen, Claus T. Kreiner, Camille Landais, Alexandra Charalambides, Andreas Peichl, Viktorie Sevcenko, and seminar participants at the University of Copenhagen, for helpful comments and suggestions. We would like to thank the Tax Department of the Republic of Cyprus for providing access to their data, and especially Elina Symeonidou for preparing and explaining the data. We also thank the Ministry of Labour, Welfare and Social Insurance for providing access to their archive of trade unions’ collective bargaining agreements. The views expressed are those of the authors and do not necessarily reflect the views of the Tax Department or Ministry of Labour, Welfare and Social Insurance of the Republic of Cyprus. All remaining errors are those of the authors.
1
Introduction
Tax enforcement is an essential part of all tax systems, and has been the subject of an extensive literature.1 A central aspect of the enforcement mechanism is how tax information is reported and verified. Different methods are implemented globally, depending on the level of development and the administrative capacity of each country. Third-party reporting is commonly viewed as the gold-standard. In such a system, both the tax filer and a third-party provide information regarding a given claim to the fiscal authority. At the other extreme is pure self-reporting, where the sole provider of information is the tax filer.
In this paper, we study a widely-used but under-studied hybrid policy, which combines elements of both self- and third-party reporting. The policy prescribes that only the filers themselves report their information to the tax authority, but also requires that they attach documentation, issued by a third party, to prove their claim. It therefore falls short of third-party reporting because the third party does not itself provide any corroborating information directly to the authorities. However, at the same time it enables the government to avoid the large investment in data infrastructure necessary to implement direct third-party reporting, while at least partially maintaining the corroborative role of the third party.
This hybrid policy is very common across different countries, and is for instance implemented for many types of tax deductions. It is a particularly useful policy tool for cases where a government wants to subsidise certain expenditures but third-party corroboration is infeasible or prohibitively costly. In Germany, for instance, it is used in the context of various work-related expenses. One example is a deduction for commuting costs, where tax filers can claim up to ¤4,500 without docu-mentation, but for any amount claimed beyond this threshold, receipts issued by a third party must be provided by the tax filer. Austria also implements this hybrid system for work-related expenses. In France, the policy is used as a tax enforcement mechanism for charitable contributions claims, where tax filers must attach receipts issued by the charity to their tax return. Similarly, in the US, any non-cash charitable contribution worth more than $5,000 is only tax deductible if the tax filer provides a form signed by the receiving charity. With charitable giving levels in the US exceeding $400 billion in 2017 (Giving USA 2018), this tax deduction represents a significant tax expense for the US government each year. Hence, not only is this policy used in many countries and contexts,
1
but it is also employed in areas with a significant impact on government budgets.2
In this paper, we analyse behavioural responses to this hybrid reporting policy by exploiting the context of charitable contributions in the Republic of Cyprus,3 where the enforcement setup is ideal
for our purposes. Charitable giving in Cyprus is subsidised through a tax deduction and this de-duction is subject to the hybrid enforcement policy described above. Important for our empirical methodology, the documentation requirements only activate if taxpayers report a deduction above a pre-determined threshold. Below this threshold no documentation is required. Across the time period we observe, this threshold varies across taxpayers and it moves at least once for all taxpayers, offering multiple sources of quasi-experimental variation in documentation requirements.
Within this setup, we present three sets of results. First, we precisely identify the effect on claimed deductions from this enforcement policy. Exploiting salary-dependence of the thresholds that govern documentation requirements, we start by presenting compelling graphical evidence of discontinuities at exactly the salary cutoffs. We then employ a regression discontinuity approach, and find that individuals increase reporting by 0.7 pounds when 1 pound more can be claimed without providing documentation from a third party.
Second, we use a unique reform that retroactively shifted the location of the reporting threshold to separate real charitable giving from pure reporting responses to the change in enforcement environ-ment. Exploiting the time-profile of responses using bunching techniques, we find that at least 64 percent of the large responses to this enforcement policy are purely changes in reporting behaviour. This separation of reporting and real responses is crucial in a setup where we expect positive external-ities from real behaviour, such as expenditures on charitable contributions, investments in education, professional training, retirement savings, etc. In such cases, the goal of the fiscal authority is not only limited to raising tax revenue, but also to encourage real responses through tax incentives. Third, we show that the existence of such reporting thresholds can have a large impact on be-havioural responses to changes in the level of taxes or subsidies. Using quasi-experimental variation in tax prices generated by reforms to the income tax schedule, we illustrate this point by analysing the elasticity of charitable contributions with respect to the price of giving. We show that this elasticity is highly influenced by the presence of reporting thresholds because people display sticky behaviour around these thresholds. Consequently, the way enforcement policies are designed and
2
Further examples of this hybrid system include expenses on work-related tools in Germany, general work-related expenses in Australia and Ireland, and meal expenses in Canada.
implemented matters not only for the level of tax compliance, but also for peoples’ responsiveness to other tax instruments. While we analyse this policy in the context of deductions for charitable giving, our results are readily generalisable to all deduction types, or types of income where a third party is involved.
This paper makes several contributions. Most importantly it adds to a growing literature evaluating the effectiveness of tax enforcement initiatives, and in particular policies regarding information re-porting. While a great deal of attention has been devoted to the effectiveness of third-party reporting, much less focus has been directed at other reporting policies. This is surprising given the prevalence of these policies across both developed and developing countries. To our knowledge, this paper is the first to rigorously analyse a widely used hybrid enforcement policy that combines elements of self- and third-party reporting. Further, it is one among very few papers which can directly observe and separate a pure reporting component from the behavioural response to an enforcement reform, and thereby set bounds on real behaviour. Evaluating the composition of the response becomes paramount in cases like charitable giving, where we expect positive externalities from real behaviour, and therefore want policy to induce people to change their actual giving, and not simply change what they report.
Within this literature the paper closest to ours is Fack & Landais (2016), which analyses a reform in France introducing a similar enforcement policy in the context of charitable contributions. While they relate the reform to a substantial change in claimed deductions, their focus is not on identifying the effects of the policy. Instead they use the change in reporting environment to study the effect of enforcement strictness on the elasticity of giving with respect to price and the elasticity of taxable income with respect to the tax rate, thereby questioning the sufficiency of the latter statistic for optimal tax formulae.
Other papers examine different types of reporting policies. A rather large literature exists on the impact of third-party reporting on compliance. Examples include Kleven et al. (2011), who conduct an audit experiment in Denmark and show that the evasion rate on third-party reported income is very low compared to self-reported income. Phillips (2014) finds a similar result analysing audit data from the US, while Alm et al. (2009) use a lab experiment to show that compliance rates increase with the proportion of income subject to third-party reporting. Gillitzer & Skov (2018) look at a Danish reform which concurrently introduced automatic pre-filled tax return information and third-party reporting on deductions for charitable contributions. Contrary to other studies (Fack & Landais 2016, Ackerman & Auten 2011), they find little evidence of over-reporting of contributions
before the introduction of third-party reporting. This also contradicts the findings of Kleven et al. (2011) for other income and deduction types in Denmark.
Some papers focus on reporting policies that affect very particular types of income or deductions. For instance, Lalumia & Sallee (2013) study the deduction for dependent children in the US. They find that a reform introducing a requirement to report children’s full social security numbers led to a reduction in the number of dependants claimed. Ackerman & Auten (2011) examine tax deductions for donated vehicles. They similarly find that a reform tightening the vehicles’ valuation requirements led to a significant drop in reported valuations, which can be credibly attributed to a reduction in overstated claims. Tazhitdinova (2018) also uses the context of charitable contributions, but analyses a very different enforcement policy, namely the requirement to provide fully self-reported details of non-cash donations to charities, and finds a significant effect on claimed deductions and the level of evasion.4
This paper further contributes to a small empirical literature on the importance of tax system design for behavioural responses to taxes and subsidies. As already explained, this hybrid enforcement policy is common across many countries, and is usually implemented using thresholds above which the documentation requirements are activated. Our contribution is to consider the consequences of embedding such reporting thresholds for the effectiveness of tax price policies. In particular, we examine whether this policy feature affects the extent to which subsidies can induce the desired be-havioural responses. The concept that features of the tax system matter for the size of bebe-havioural responses has been addressed theoretically by Slemrod & Kopczuk (2002) and Slemrod (1994), while a few other papers provide supporting empirical evidence. Kopczuk (2005) for instance finds that the elasticity of reported income with respect to tax rates depends on the level of deductions in the tax system, and Fack & Landais (2016) show that both the elasticity of reported income with respect to the tax rate and the elasticity of reported charitable contributions with respect to price are sensitive to the level of enforcement.5 In a different context, Mishra et al. (2008) look at the effect of tariffs on evasion of customs duties and find evidence that this elasticity is affected by characteristics correlated
4For a theoretical contribution deriving the allocation of resources between audits and information reporting in an optimal tax enforcement policy setting see Kuchumova (2017). For literature focusing instead on firms’ responses to information reporting and other enforcement policies, see for instance Almunia & Lopez-Rodriguez (2018), Naritomi (2018), Carrillo et al. (2017), Slemrod et al. (2017), Agostini & Martinez A. (2014), etc. The context of firms is however significantly different from the one examined in our paper.
5
A related paper in this context is Doerrenberg et al. (2017), which documents responsiveness of total deductions to tax changes in Germany, as well as a significant difference between the elasticity of gross and taxable income.
with enforcement possibilities. We add to these findings by showing that reporting thresholds lead to very sticky behaviour and hence reduce the responsiveness to subsidies such as those for charitable giving provided by many countries around the world.
The rest of the paper is structured as follows: Section 2 describes the institutional environment and the data we use in the empirical analysis. Section 3 goes through our results from the regression discontinuity analysis investigating behavioural responses to the reporting policy. In section 4 we use bunching techniques to separate real and reporting responses. Section 5 presents our results on the importance of reporting thresholds for the tax price elasticity of charitable contributions, and section 6 concludes.
2
Institutional context and data
In this section, we describe the institutional context of charitable giving in Cyprus, the associated reforms we exploit, and the administrative dataset we use to analyse this enforcement policy.
2.1 Institutional details
As in most countries, charitable giving in Cyprus is subsidised through tax incentives. Specifically, the amount donated is deducted from taxable income, reducing the effective price of giving to (1−τ), where τ is the marginal tax rate. Due to administrative constraints, there is no automatic third-party reporting by charities to the tax authority. Instead, tax filers are required to provide receipts of donations. To reduce both hassle and administrative costs, a threshold has been set, up to which no receipts are necessary. For any amounts claimed beyond this threshold, receipts must be provided. We exploit several sources of exogenous variation in these reporting thresholds and in marginal in-come tax rates, which allow us to examine how contributions respond to the filing environment. We first explain the reforms associated with the filing environment. The reporting threshold schedule, determining at which donation level receipts are necessary, features several discontinuities and re-forms between 1999-2010. This is illustrated in Figure 1. Prior to 2003 the maximum amount one could declare without providing receipts was a function of salary income. For salary earnings above CYP 10,000, this threshold was CYP 150, for earnings between CYP 7,500-10,000 it was CYP 100, etc. These salary-dependent cutoffs, introduced in 1989, were abolished by the Regulatory Admin-istrative Act No. 823 of 2003. No new law or regulatory act set any new thresholds; rather, the tax authority created a de-facto threshold at CYP 150 for everyone by clearly stating the following on the 2003 tax form: “For donations above £150 please attach receipts” (shown in Appendix Figure
Figure 1:
Reporting thresholds over the sample period
From 2008 to 2010 From 2003 to 2007 Before 2003 0 50 100 150 200 Donations 0 5000 10000 15000 Salary income
Notes: The figure illustrates the thresholds up to which people could claim deductions for charitable contributions without providing receipts. In the years 1999-2002 this threshold was dependent on salary income with 5 different notches in the schedule. From 2003 the threshold became independent of income and was set at CYP 150. In 2008 this threshold was changed again to CYP 175.
6b). This is the first tax form that denotes a specific threshold; up to 2002 the tax form simply stated: "attach relevant receipts" (Appendix Figure 6a). The 2003 wording was kept the same up to 2007.
This threshold was changed again when Cyprus switched currency and adopted the Euro. The Euro was phased in during 2008, and the tax return for the 2008 fiscal year (which coincides with the cal-endar year) had to be filed in Euros. The tax return now stated“attach receipts only for donations above ¤300” (Appendix Figure 6c). Given the locked exchange rate6 of CYP0.585274 = ¤1, this was equivalent to CYP 175. Tax returns are published after the end of the fiscal year and need to be submitted by the end of April. Therefore, this new threshold was published after the end of the
6
2008 fiscal year, precluding any real responses in contributions during 2008.
Besides salary specific discontinuities and reforms, we are also able to exploit exogenous variation in the tax price of giving generated by marginal tax rate reforms. The Appendix Figure 7 shows the income tax schedule in Cyprus between 1999-2010, where marginal tax rates were changed six times in total, affecting all parts of the income distribution.
Our empirical strategy draws on three sources of variation generated by the institutional setting. We start by focusing on the pre-2003 salary-based discontinuities in the filing threshold to establish that donations respond strongly to this reporting policy . We then exploit the unique timing of the 2008 reform of the reporting threshold to set bounds on the real and pure reporting components of the response. Lastly we draw on the variation in marginal tax rates to estimate the tax price elasticity of donations and examine whether this is sensitive to the design of the filing environment i.e. the presence of reporting thresholds.
2.2 Data
The data come from first-time access to the administrative records of the Tax Department of the Republic of Cyprus. It covers the universe of tax filers between 1999-2010, and includes information from the main fields of the I.R. 1A tax return, as well as basic demographic and firm-related char-acteristics. All employees are required to file taxes, unless they earn a gross amount below some tax free level. The self-employed are required to file regardless of the amount earned. Besides individuals with earnings from labour, the dataset also includes pensioners and individuals out of the labour force who may be filing because it is a requirement for accessing government welfare programmes. To create our working dataset, we impose the following restrictions. First, we consider only individ-uals with a single employer, who report at least some positive salary income and are aged between 25-54.7 Second, we drop individuals in the top 0.1% of donations. Our working dataset contains about 1.5 million observations and 225,000 unique individuals. Table 4 shows summary statistics for our sample.
It is important to note that due to the way the tax administration provides the tax data, our variable measuring donations also includes trade union subscription fees, which is another tax deduction that appears on the same section of the tax return. Prior to 2003, it also includes a so-called “profes-sional” tax. This is a lump-sum tax that was a step-function of earnings (Figure 8 in the Appendix
7As is explained below, we need to know workers’ sector and salary to determine their potential union membership fees. In our data, we can observe individual salaries, but not salaries per employer. We therefore drop the 3% of our sample having more than one job, to ensure we can do this accurately.
shows the exact schedule). We deal with the professional tax by simply removing the amount from our variable, as we know the exact amount individuals had to pay based on their salaries.
The only remaining issue is that of trade union membership fees. This does not affect our first two empirical strategies, because we use variation where adding noise to the measure should not affect any results. For instance, in the case of the regression discontinuity design this should only shift the level on both sides of the cut-off, but not affect the size of the discontinuity.8 Similarly, for our bunching estimates fees should affect both the level of bunching and the counterfactual similarly leaving the bunching estimate unchanged. Further, we are not interested in the level of bunching per se, but in the changes in bunching across years. However, for the last part of the analysis, where we consider elasticities, these union fees play a role and we need to correct for them. Since we don’t directly observe trade union membership in our data, we tackle this issue by using detailed sectoral information available in our dataset, which we combine with information on union fee rates we have collected directly from trade unions and from the Ministry of Labour and Social Insurance. Union fees are a fixed proportion of salaries, deducted every month from employers through the PAYE system. We use the information on union rates, salaries and sectors to residualise our donation measure from union fees in highly (or fully) unionised sectors where we can be sure we are correctly accounting for them.
To our advantage, union membership in Cyprus, which has about 50% coverage in our study pe-riod (Ioannou and Sonan 2014) is highly concentrated in just a few sectors: commercial banking, the public sector, hotel services and construction. Due to industry-wide agreements and automatic enrol-ment upon employenrol-ment, both the public sector and commercial banking have nearly 100% coverage (Ioannou and Sonan 2014). They are also relatively large sectors, and together make up about 43% of our estimation sample (7% banks, 36% public sector). In comparison, hotel and construction have unionisation rates of about 75%, and make up 3% and 7% of our sample respectively. Besides these, union membership is very low for the remaining sectors. Our raw donation measure will therefore only be significantly affected for workers in the highly unionised sectors, for which we can accurately correct.9 For each of our empirical strategies, we run a battery of robustness checks to show that our results are not affected by the way we deal with union fees.
8Importantly, union fee rates are fixed across all salary ranges and did not change following any tax or threshold reforms.
9
In the few cases where we cannot, we simply drop them from our analysis. For instance, we exclude the public sector whenever we run specifications using our adjusted measure because our data does not distinguish between different types of workers in the public sector which are subject to different union fee rates within the sector.
3
Behavioural responses to a hybrid reporting policy
We begin our empirical analysis by presenting motivating evidence showing that reported contribu-tions seem to respond strongly to changes in the reporting environment. As explained above, our period of analysis includes two reforms, implemented in 2003 and 2008, both of which increased the levels of the reporting threshold. In Figure 2, we check whether they relate to reported donations by plotting the average donations over time, and marking the years before the reforms with vertical dashed lines. Apart from an increasing time trend, the raw timeseries clearly reveals two sharp jumps exactly in the two reform years. This initial time-profile of donations suggests that these reforms, which uniformly relaxed the enforcement environment, caused a substantial increase in reported do-nations in Cyprus.
Given this evidence, the following section aims to identify the causal effect of this hybrid
enforce-Figure 2:
Yearly average donations among donors
140 160 180 200 220 Average donations 2000 2002 2004 2006 2008 2010
Average Positive Donation
Notes: The figure shows the yearly average of donations using only observations where donations are positive. We remove the top 0.01% of donations within each year. The sample includes all tax filers in the age range 25-54, with some positive salary income and only one job within a given year.
variation: the salary-based discontinuities in the amount of donations tax filers can report without receipts before 2003.
3.1 Regression discontinuity estimates
As shown in Figure 1, the reporting threshold was a function of gross salaries before 2003. This setup lends itself to a regression discontinuity design. For our main RD estimates, we use years 1999-2001 and restrict our sample to those with only salary income. We exclude 2002 because a reform in that year shifted the first income tax threshold to CYP 9,000, meaning that individuals with salaries below this level cease to be a reliable sample as they had no obligation to file a tax return and no tax incentive to claim deductions. We also exclude individuals with non-salary income because the threshold we want to exploit is a function of salary income, and we want to preserve the income trend in donations.10 We focus on two discontinuities: the jump from CYP 100 to CYP 150 at the CYP 10,000 salary cutoff, and the jump from CYP 60 to CYP 100 at the CYP 7,500 salary cutoff. We do not consider lower cutoffs because they are located at income levels where individuals have no tax filing obligation.
Figure 3 plots the average donation by salary bins of width 50 between 1999-2001. As is clearly seen, donations jump at exactly the salary cutoffs associated with different reporting thresholds, but otherwise evolve smoothly. Note that our measure here also includes professional taxes and union fees. We do not remove these, since neither involve any discontinuities at our salary cutoffs of interest. This can be seen in Appendix Figure 8, which shows that the professional tax indeed evolves smoothly across these cutoffs. Likewise, union fees are always set at a fixed percentage of salary, and hence do not jump at different income levels.
Our aim is to estimate the jumps in reported donations using an RDD, treating individual salaries si as our assignment variable. Before doing so, we check that our identification strategy is valid.
The identifying assumption is that there is no precise manipulation of the assignment variable, i.e. workers cannot precisely choose their salaries in order to manipulate the different thresholds. For instance, if workers just to the right of a threshold strategically placed themselves there in order to be able to report more, then workers with salaries just below the threshold would not provide a valid counterfactual. The possibility that workers specifically search for wage-hours packages in order to respond to the thresholds associated with charitable giving is however very unlikely. More importantly, even if this scenario were true, it is highly unlikely that they would be successful in
10
For robustness, we also run our main specification including 2002, and including individuals with non-salary income, and find very similar results.
Figure 3:
Average donations by income 1999-2001
50 100 150 200 250 Average donation 4000 6000 8000 10000 12000 Salary income
Notes: The figure shows average donations by income pooled in the years 1999-2001. We use income bins of 50 including the left-hand value. We include people with only salary income and only one job within a single year and remove people with an income at an exact round number (multiples of 500).
doing so precisely. There are significant labour market frictions associated with searching for wage-hours packages. Indeed, a public finance literature on taxable income bunching (Chetty et al. 2011; Kleven and Waseem 2013; Gelber et al. 2017) and work hours constraints (Dickens and Lundberg 1993; Blundell et al. 2008) shows that there are significant frictions associated with precisely choosing earnings.
We check for evidence of manipulation by examining the density of salaries, as shown in the Appendix Figure 9. A sign of manipulation would be significant amounts of bunching or sorting around the donation-related salary cutoffs, but not elsewhere. In particular, we would expect individuals to sort just to the right of these cutoffs, in order to take advantage of the higher reporting thresholds. As we see, this is not the case. Figure 9a in the Appendix shows some bunching at our cutoffs, but there is also (much larger) bunching at many other levels. Specifically, this comes from
round-number bunching at all multiples of CYP 500, which is characteristic of the fact that salaries have a high propensity to be set at round numbers. This is also confirmed by Figure 9b, which shows the density of salaries when we drop individuals with a salary that is an exact multiple of CYP 500, i.e. si mod 500 = 0. In this case, the bunching at our cutoffs disappears, as it does at all other
round numbers. We also use a McCrary test to formally test for the existence of any significant discontinuities in the density around each cutoff, the results of which are also reported in the figure. In line with visual evidence, the null of no discontinuity cannot be rejected, supporting our identifying assumption of no precise manipulation of si.
We proceed by dropping the rounders from our estimation sample, but show as a robustness check that their inclusion does not change our results. To estimate the size of the discontinuities, we treat individual salary si as our assignment variable, and run regressions of the form:
Yi=α0+α1T reatedi+f(si, β) +T reatedi×f(si, γ) +Xi0δ+i (1)
where we define, for each threshold T ∈ {7500,10000} separately, T reatedi = 1{si ≥ T}. Here
f(si,; ) is a polynomial function with parameter vector β that controls for the salary trend and γ
that controls for the interaction between the salary trend and treatment status. The parameter α1 measures the jump in average donations due to the change in the reporting threshold. Some
specifications also include a vector of controls X (sex, year and sector fixed effects). Lastly, we only consider bandwidths of up to 2000 to ensure that no estimation sample includes more than one cutoff.
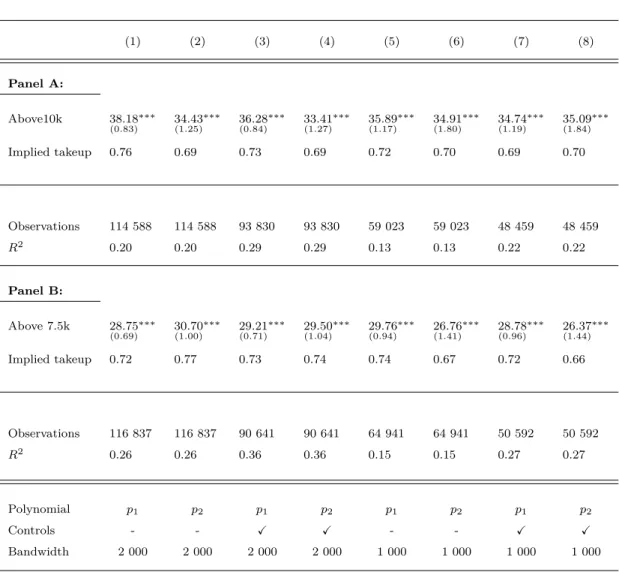
Table 1 shows our results split into two panels: A for the CYP 10,000 cutoff and B for the CYP 7,500 cutoff. To check robustness of our estimates, we present results from eight different specifications of equation (1): with a first and second order polynomial of the assignment variable,11 with and without controls, and with different bandwidths. Each panel reports two estimates: (a) the size of the discontinuity, and (b) the implied takeup, which scales our estimate by the size of the notch in the donation schedule.
Starting with the 10,000 cutoff, column (1) of Panel A shows that the effect of increasing the threshold from CYP 100 to CYP 150 is a CYP 36.64 increase in donations, with this effect estimated with very high precision. This estimate implies a takeup of 73%, i.e. that workers increase their donations by 0.73 for every unit increase in the amount of donations that can be reported without
11
As is clear from Figure 3, a linear specification allowing for different slopes on each side of each threshold should suffice. For robustness we nevertheless also report results using second-order polynomials. We have also estimated specifications with higher order polynomials, and found that this does not change any results.
Table 1:
Regression discontinuity estimates at notches in donation schedule
(1) (2) (3) (4) (5) (6) (7) (8) Panel A: Above 10k 36.64 (0.95) ∗∗∗ 33.80 (1.41) ∗∗∗ 34.40 (0.97) ∗∗∗ 32.51 (1.45) ∗∗∗ 35.08 (1.33) ∗∗∗ 35.12 (2.04) ∗∗∗ 33.79 (1.38) ∗∗∗ 34.15 (2.12) ∗∗∗ Implied takeup 0.73 0.68 0.69 0.65 0.70 0.70 0.69 0.69 Observations 84 255 84 255 68 697 68 697 43 095 43 095 35 404 35 404 R2 0.21 0.21 0.28 0.28 0.13 0.13 0.20 0.20 Panel B: Above 7.5k 29.64 (0.74) ∗∗∗ 31.77 (1.08) ∗∗∗ 30.48 (0.79) ∗∗∗ 30.91 (1.14) ∗∗∗ 30.78 (1.01) ∗∗∗ 26.50 (1.51) ∗∗∗ 30.21 (1.06) ∗∗∗ 26.30 (1.58) ∗∗∗ Implied takeup 0.74 0.79 0.76 0.77 0.77 0.66 0.76 0.66 Observations 92 433 92 433 71 095 71 095 51 850 51 850 40 123 40 123 R2 0.29 0.29 0.37 0.37 0.17 0.18 0.27 0.27 Polynomial p1 p2 p1 p2 p1 p2 p1 p2 Controls - - X X - - X X Bandwidth 2 000 2 000 2 000 2 000 1 000 1 000 1 000 1 000
Notes: This table shows the results from estimating specification (1) on our main sample pooled over 1999-2001. TheImplied takeupis calculated as the parameter estimate divided by the notch size in the donation schedule (i.e. in panel A the parameter estimate is divided by 50 while in panel B the parameter estimate is divided by 40).psindicates that we fit a polynomial of orderson each side of the notch, while controls include sex, year and sector fixed effects. Robust standard errors clustered at the individual level in parentheses, *** p<0.01, ** p<0.05, * p<0.1.
providing receipts. These results are highly robust to the choice of polynomial order, inclusion of controls, and bandwidth. As columns (2) - (8) show, the estimated effect is on average CYP 34.5 and the implied takeup is hence about 70%. Very similar results are found when we consider the second cutoff at CYP 7,500 (panel B). The increase in donations is estimated close to CYP 30 across all specifications. This is lower than the effect estimated at the higher cutoff, which is expected given that the discontinuity in the reporting threshold is also smaller in magnitude. When we scale the effect by the size of the notch, we find a very similar implied takeup, estimated at 74%, which
sug-gests that the behavioural responses are highly comparable across the two cutoffs. Again, estimates are extremely robust to the alternative specifications across (1)-(8).
We next present robustness tests of our estimation sample. First, we include individuals with round-number salaries. Second, we include the year 2002. Third, we include individuals who also have non-salary income (conditional on having some salary income). Fourth, we use our variable cleaned from professional taxes and union fees.12 Lastly, we run separate regressions for individuals working in highly and not highly unionised sectors. The results are shown in Appendix Tables 5-11. Our estimates are extremely robust to every variation we consider.
As a last robustness test we also check for any discontinuities in covariates around our cutoffs. Non-smoothness in covariates could suggest non-smoothness in the distribution of unobserved het-erogeneity, thereby casting doubt on the validity of our method. We consider four covariates: age, the probability of being female, the probability of working in a highly unionised sector, and the level of other deductions. We also check the first and last price of giving, where these are defined as the prices before and after donations respectively.13 Figure 10 in the Appendix shows plots of each of these cases as a function of our assignment variable. All plots confirm smoothness around our two cutoffs.
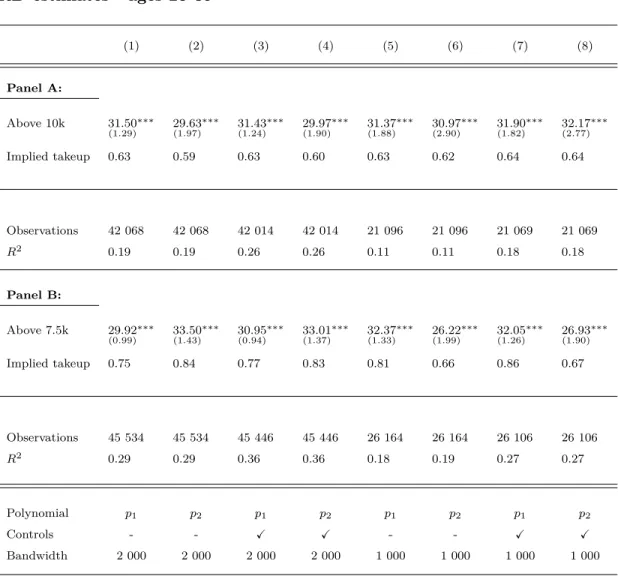
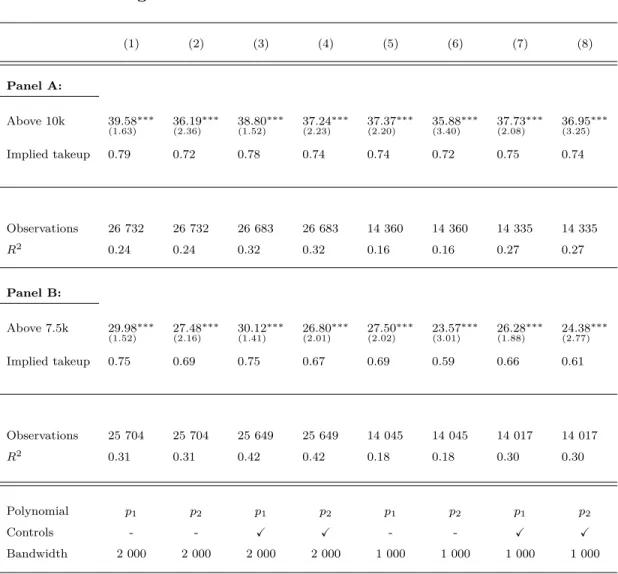
Finally we investigate heterogeneity in these responses by sex and age. Appendix Table 12 shows results for males, and Table 13 for females. We do not find any notable heterogeneity around the 10,000 cutoff, but do find a somewhat larger response around the 7,500 cutoff among females. The implied takeup for females is around 0.82, compared to 0.66 among males.14 Appendix Table 14 shows results for taxpayers aged 25-39 and Table 15 those aged 40-54. Younger taxpayers seem to respond slightly more to the lower cutoff, but slightly less to the higher cutoff, compared to older taxpayers. The implied takeup rate among the younger group is about 0.62 at 10,000 and 0.77 at the 7,500 cutoff. Among the older group, it is 0.75 and 0.68 respectively. Overall, these results do not reveal substantial heterogeneity, and importantly all groups seem to exhibit large responses in-dependent of specification or cutoff choice. Even the lowest takeups are quite substantial, confirming the large impact this reporting policy has on taxpayer behaviour.
12
In this case, we drop the public sector from Table 8 because we cannot correct the trade union payments with high precision.
13These definitions are explained in detail in Section 5.
4
Separating real and reporting responses
Having established that reported donations respond strongly to this enforcement policy, we now focus on characterising the composition of this response by exploiting the timing of the 2008 reform. As explained, the threshold up to which no receipts are necessary was moved from CYP 150 to CYP 175 (300 Euros) in 2008, but this change was only announced after the end of the 2008 fiscal year. Hence, at the time of the announcement it was no longer possible to adjust real giving behaviour and therefore any response to the new threshold in 2008 can only be a pure reporting adjustment. To exploit this unique characteristic of the reform we examine bunching patterns around the report-ing thresholds and how these patterns change in the year of the reform. To do this, we implement standard bunching techniques (Saez 2010; Chetty et al. 2011; Kleven 2016) and estimate the excess mass of individuals located at each threshold between 2003-2010. Our bunching results then allow us to estimate what proportion of observed responses are pure reporting effects by comparing the bunching (excess mass) in 2008 at the CYP 175 new threshold, which can only be driven by a pure reporting response, to the bunching in 2007 at the CYP 150 threshold:
LR= B
2008 175
B1502007 (2)
In words, LR reports the fraction of the excess mass at the previous threshold that moves to the new threshold before real responses are feasible. LR provides a lower bound on the pure reporting
response, since responses in subsequent years can include both a real and a reporting dimension.
4.1 Bunching responses to reporting thresholds
We start by showing the dynamic bunching patterns in the data using our main sample, defined in the same way as in the RD section. We do not remove union fees because we want to preserve the raw patterns in the data. This of course means that we are identifying our effects from the non-unionised sample. We show in the next section that our results are highly robust to accounting for union fees. We group donations in bins of width 5 and fit an 11th order polynomial to estimate the counterfactual mass of filers in the absence of these thresholds. The difference between the actual and counterfactual count is therefore the excess mass ascribed to the discontinuous change in reporting requirements at the threshold. In our estimation, we also control for round number bunching in multiples of 50 and 100 (thereby flexibly allowing for different levels of roundedness for each).15
15
For years 2008-2010, we have converted the currency from Euros to CYP using the official exchange rate. In this case, we control for round numbers by using the CYP converted amounts of the round numbers in Euros, since that was the actual currency used to file the tax return.
Figure 4:
Bunching around reporting thresholds
(a) 2003 b150 = 9.274 (0.195) b175 = 0.025 (0.033) 0 10000 20000 Count 0 100 200 300 400 500 Donations in CYP (b) 2004 b150 = 11.079 (0.258) b175 = -0.157 (0.030) 0 10000 20000 Count 0 100 200 300 400 500 Donations in CYP (c) 2005 b150 = 13.487 (0.286) b175 = -0.119 (0.027) 0 10000 20000 Count 0 100 200 300 400 500 Donations in CYP (d) 2006 b150 = 18.893 (0.437) b175 = -0.228 (0.027) 0 10000 20000 Count 0 100 200 300 400 500 Donations in CYP (e) 2007 b150 = 27.154 (0.634) b175 = -0.361 (0.027) 0 10000 20000 Count 0 100 200 300 400 500 Donations in CYP (f) 2008 b150 = 7.481 (0.189) b175 = 9.867 (0.153) 0 10000 20000 Count 0 100 200 300 400 500 Donations in CYP (g) 2009 b150 = 6.086 (0.173) b175 = 12.275 (0.187) 0 10000 20000 Count 0 100 200 300 400 500 Donations in CYP (h) 2010 b150 = 5.315 (0.168) b175 = 14.004 (0.207) 0 10000 20000 Count 0 100 200 300 400 500 Donations in CYP
Notes: This figure shows the bunching dynamics of donations among salary earners between 2003-2010, by plotting the yearly empirical distributions in bins of width CYP 5. Each sub-figure reports the normalised excess bunching massbaround the CYP 150 and CYP 175 thresholds, with bootstrapped standard errors in parentheses. Vertical solid lines mark the relevant threshold that is in place in a given year (CYP 150 during 2003-2007 and CYP 175 during 2008-2010), while dashed lines mark the other
Figure 4 shows the empirical density of reported donations between 2003-2010 for our main sample, in bins of CYP 5. To get a sense of the magnitude of the bunching in each year, each sub-figure reports the normalised excess mass at each threshold,b150andb175, with bootsrapped standard
errors shown in parentheses.16 To highlight how the bunching moves across the two thresholds, each sub-figure also demarcates the threshold in place in a given year by a solid vertical line, and the other threshold by a dashed vertical line. We do not include the estimated counterfactuals here to avoid cluttering, but show these separately for each threshold in Appendix Figures 11 and 12. We find that bunching at the CYP 150 threshold is very large in magnitude and sharp (i.e. there is no diffuse bunching around the threshold). The normalised excess mass steadily increases between 2003 and 2007, starting from a level of 9.3 and peaking at 27.2 in the last year this threshold is effective. By 2007 therefore, there are 27 times as many individuals at CYP 150 compared to what there would be absent the filing discontinuity. At the same time, there is no excess bunching at CYP 175 throughout this period (marked with a dashed vertical line). These patterns are followed by a dramatic change in 2008. The bunching at CYP 150 stops growing and instead exhibits a large drop to 7.5, and continues decreasing thereafter. Bunching at CYP 175 now appears, producing a normalised excess mass of 9.9 in 2008. In a symmetrically opposite way to the bunching at CYP 150, bunching at the new threshold exhibits further growth in years 2009-2010. What is striking is that while there is no bunching in any year before 2007 at CYP 175, a very large spike appears in 2008, even though there was no knowledge of this new threshold, and hence no real response possible during the 2008 fiscal year. The bunching dynamics also suggests learning, as it seems to take time for individuals to understand the incentives created by the thresholds and respond to them over the years.
4.2 Estimating a lower bound for pure reporting responses
We next turn to our estimate of LR. To obtain this, we restrict our sample to a balanced panel of
tax-filers present in our data in all years between 2003-2010.17 This is important when we directly compare patterns across time as we may otherwise bias our estimates due to entry and exit from the sample. To generate our estimate of LR we use the non-normalised excess mass such that if the
entire excess mass from the CYP 150 threshold moves to the new threshold in 2008 we get LR= 1.
To visualise the dynamics, Figure 5 plots the non-normalised bunching estimates at each threshold across time, with the shaded areas demarcating our 95% confidence intervals. The patterns show
16
We estimate the normalised excess massbby scaling the excess mass by the height of the counterfactual. 17
how tax-filers in our panel shift around the two thresholds across time, and elucidate how striking the reversal in the bunching mass between the two thresholds is around the time of the reform.
Using our estimates of B1502007 and B2008175 we get LR = 0.64. This implies that at least 64% of the
Figure 5:
Bunching (excess mass) estimates over time
0 2000 4000 6000 8000 10000 Ex c e s s Ma s s 2003 2004 2005 2006 2007 2008 2009 2010 Bunching at CYP 150 Bunching at CYP 175
Notes: This figure shows for the balanced panel of our main sample of salary earners, the estimates of the excess mass around both the CYP 150 and 175 thresholds, between 2003-2010. The shaded areas demarcate 95% confidence intervals.
response to an increase in the reporting threshold is due to pure changes in reporting, rather than real changes in contributions.18 In relation to our results from the previous section, this means that taxpayers increase reported donations by £0.7 when they can claim £1 more without documentation, and at least £0.45 of this increase is a pure reporting adjustment unrelated to real giving. To the extent that individuals take time to learn about, and understand, the changes in the reporting environment, the responses in 2009 and 2010 may also capture reporting responses and hence LR is
a lower bound on the pure reporting component.
Next, we further exploit the panel dimension of our data to check whether the patterns we observe
18
If we impose a less strict sample restriction of requiring tax-filers only to be present in 2007 and 2008, this estimate increases to 67%.
are indeed driven by individuals moving from the old threshold to the new one. In Appendix Figure 13, we plot the empirical density of reported donations between 2003-2010, for the sample bunching at CYP 150 in 2007. We find that the overwhelming majority of the 2007 bunchers are "repeat" bunchers, locating at CYP150 for up to 4 years earlier. They also overwhelmingly shift to the new threshold in 2008, while some take a further one or two years to complete the shift. Appendix Figure 14 repeats the analysis for those bunching at the new threshold in 2008. Again, we find the same patterns; these are individuals who were previously bunching at the old threshold for up to 5 years before, with the shift being nearly complete by 2010.
Figure 16 in the Appendix plots the fraction of individuals with reported donations at (1) the 150 threshold, (2) the 175 threshold, (3) above 150 and (4) above 175 throughout the entire sample period. The trends in the fraction of individuals filing 150 and 175 is in line with our previous results. The fraction of individuals at 150 is increasing from 2003 and peaks at 2007, before dropping sharply in 2008. Conversely, there are very few at 175 until 2008, when it increases sharply. What is more interesting is the trend in the proportion of people filing more than 150 and more than 175. While they exhibit parallel trends up to 2008, there is a sharp increase in the fraction of individuals filing above 150, but no change in the fraction of those filing above 175. This confirms that the movement is purely between these two thresholds, and emphasises how important the reporting environment is for taxpayer behaviour.
4.3 Robustness analysis
We next discuss the robustness of these results and conduct a battery of checks on our main results. First, it is very important for the validity of the lower bound that the 2008 threshold change was not anticipated or somehow made public before the end of the fiscal year. Before the introduction of the Euro there was a large government campaign informing citizens that during the transition they should simply use the official locked exchange rate to convert prices, salaries etc. Following this, filers should have expected the threshold to remain unchanged at a converted value of ¤250, not ¤300. Further, tax returns are not published before the end of the fiscal year. Even if it was published early through unofficial channels, it is highly unlikely that filers would be so keen to obtain their tax return before the end of the fiscal year that they would search for it. The fiscal year ends four months in advance of the tax return submission deadline and looking at the data on tax return submission dates we see that the vast majority of tax filers procrastinate, and submit their return just before the deadline of April 30th of the following year (see Figure 15 in the Appendix). Most
file in the last week of the deadline. This behaviour is clearly at odds with active tax return search and filing behaviour.
Second, we consider whether our bunching patterns could be affected by the existence of union fees. This would be implied by two, extremely unlikely, scenarios. The first is that we are picking up bunching at thresholds that is driven purely by fees which coincidentally place individuals at the thresholds. The second is that we are picking up the sum of union fees and donations, which again happen to consistently sum to these thresholds. Both are implausible. The first case would require that the salaries of such bunchers were at a level prior to 2008 that, when the fixed % of salary paid as union fees was applied, would place them at the filing threshold. At the same time, their salary in 2008 would also have to grow by a rate exactly large enough to move them to the new threshold (a 16.67% increase). Thereafter, they would again have to revert back to a zero growth rate in order to stay at the new threshold. We can in fact check this. Figure 17 plots the salary growth rate of the 2007 bunchers and shows that this is not the case;19 salary growth rates are far from what this extreme scenario would imply. The second case would require a very high level of sophistication and meticulous tax planning. Specifically, individuals would have to predict their exact yearly salary and union fees, and dynamically adjust their donations to crowd-out union fees one-for-one, so that these would always sum to the exact threshold by the end of each fiscal year. Not only is this implausible, but importantly taxpayers have no financial incentive to engage in this form of planning in the first place.
Nevertheless, we conduct robustness checks where we repeat our previous analysis, but restrict the sample to only workers not in highly unionised sectors. In this case, the contribution of any union fees will be minimal because the proportion of unionised members in this sample will also be limited. Our full set of results is presented in Appendix Figures 18 - 21. The bunching patterns in the yearly densities are nearly identical to our main findings, and we get the exact same lower bound estimate for the reporting response (of 64%). Our main results are therefore highly robust to the presence of union fees. This of course means that we are identifying the effect of the 2008 reform from non-union members, since union members would be scattered around these thresholds with their donations, and as the previous analysis revealed, their union fees would place them to the right of them. This does not affect our analysis, since systematic union fees would only potentially affect thelevel of bunching. We are not however interested in this level per se, but rather in the ratioof bunching, between 2008 and 2007. While this is identified from the non-unionised, our result is fully generalisable as long as
19
we believe that union members are not fundamentally different from non-members. We check this by next repeating our analysis after removing union fees among the highly unionised sectors.20 The results are shown in Appendix Figures 22 - 25. We find the exact same patterns, with our lower bound estimate of the reporting response being again very similar to our previous estimates (60%). As a final robustness test, we check whether our main results are sensitive to our choice of the poly-nomial order used to estimate the counterfactual density. This affects our estimate of the bunching mass and can thereby influence our estimate of the reporting response, LR. Figure 26 plots
esti-mates ofLRfor every polynomial order in unit intervals from 3 to 12, and shows that our results are
extremely stable around the estimated value of 64%.21
5
The elasticity of giving and reporting thresholds
The tax authority incentivises charitable giving by offering a tax deduction on reported contribu-tions, and relies on the described hybrid enforcement policy for compliance. This hybrid policy is implemented using reporting thresholds determining the contribution level where documentation requirements activate. As our analysis has established, taxpayers’ reported contributions respond strongly to changes in these reporting thresholds, and moreover, a large fraction of these responses are simply changes in reporting, rather than changes in real giving. Furthermore, this setup leads to very sharp bunching behaviour because taxpayers actively target these threshold values. This then begs the question of whether the existence of such thresholds affects taxpayers’ responses to the size of the tax deduction, especially if such bunching behaviour is sticky. To test this, we exploit a further source of quasi-experimental variation - changes in the price of giving generated by tax rate reforms - to estimate the elasticity of reported donations with respect to price. The tax rate reforms in our sample period are illustrated in the Appendix Figure 7. We can exploit these reforms as a source of variation in the price of giving, since the tax rate essentially determines the size of the tax subsidy to charitable donations.
The typical approach in the literature on the elasticity of the tax price of giving is to run log-specifications of the form:
ln(dit) =β1ln(1−τit) +β2ln(yit) +β
0
3Xit+ Γi+ Γt+εit (3)
20
In this case, we exclude the public sector. 21
Besides these tests, we have also checked for heterogeneity across sex and age groups and did not find any substantial differences.
where dit is the donation amount and yit is disposable income before donations of individual i at
time t. τit is the marginal tax rate and hence 1−τit is the price of giving. Xit is a vector of other
controls. Specifications estimated using panel data can also include individual and time fixed effects, Γi and Γt. The price elasticity is then given by β1.
Estimating this equation using standard OLS leads to an endogeneity problem. Charitable donations can affect the price of giving because these may shift taxpayers to lower tax brackets, thereby reducing the tax price and causing an upward bias in the estimated elasticities. This is a well-known endogeneity problem in the literature, and has been typically dealt with by instrumenting the last-pound (observed) price of giving with the first-pound price of giving (1−τit|dit=0 ≡1−τit∗). This
is the price a taxpayer faces for the first pound of charitable contribution. This removes any price variation due to charitable giving, and results in a very strong first-stage because the first- and last-pound prices are mechanically very highly correlated.
For the exclusion restriction to hold, the relationship between the first-pound price and the level of donations must solely go through the last-pound-price of giving. As argued by Almunia et. al (2017), this exclusion restriction is violated when using price variation from tax reforms because such reforms create a second source of endogeneity. Specifically, changes in marginal tax rates can also affect other choices such as individual labour supply and earnings more generally. Tax reforms therefore affect choices which both enter the donation decision and directly affect the first-pound price, because they determine which tax bracket a taxpayer is in, thereby violating the exclusion restriction.
Almunia et al. (2017) propose a solution that leverages the availability of panel data, based on the Gruber and Saez (2002) IV strategy that is widely used in the literature on the elasticity of taxable income (for a review, see Saez et al. 2012). Their instrument uses lagged income values to predict the reform-induced change in the price of giving. Specifically, they propose estimating the following differenced equation: ∆ln(dit) =β1∆ln(1−τit∗) +β2∆ln(yit) +β 0 3∆Xit+ ∆εit (4) where ∆ln(xit) = ln xit xi,t−k
for xit =dit,1−τit∗, yit, and the log change in the first-pound price is
instrumented by: ln 1−τi,t∗ yi,t∗ −k 1−τi,t∗−ky∗i,t−k (5)
The variablekdetermines the time horizon of the difference. In words, the instrument is the change in the price of giving from time t−k to time t if taxable income at zero donations (yit∗) remained unchanged. This instrument solves the endogeneity problem because it uses past (pre-tax) income which should not be affected by future reform-related choices. In our empirical application, we mainly follow Almunia et al. (2017) and implement the differenced-IV specification (4). To compare our findings with existing practice, we also report results for the un-differenced IV estimates of specification (3).
As already mentioned, our measure of donations also includes a union membership fee for some subset of workers. We cannot directly observe the size of this fee or who is a member of a union. However, using information on sector we can back it out with some noise. The banking sector in Cyprus is large and (almost) fully unionised, meaning that all workers in this sector pay the same fraction of salary in membership fees. Consequently, for the banking sector we can completely separate donations from these fees. Apart from the banking sector a small number of other sectors, such as the construction and hotel services, are highly but not fully unionised. We can therefore account for fee payments for these sectors with some error coming from the small fraction of workers who are not in a union.22 Lastly Cyprus has a number of sectors with very low unionisation. In these sectors the donation measure will be somewhat noisy due to the small number of unionised workers. Given these considerations, we use the sample of workers from the banking sector as our main sample in the analysis, but show that all results are robust to using either the full sample or the sample of highly unionised sectors instead.
5.1 Elasticity estimates
To get a picture of the sensitivity of elasticities to the existence of reporting thresholds, we split our sample into two types of workers. The first group consists of workers who at some point bunch, meaning that at some point in the sample period we observe them exactly at a threshold value. The second group consists of those workers who never bunch meaning that we never observe them at a threshold value. We then estimate elasticities separately for these two groups of workers using the methods introduced above. As we are specifically interested in the stickiness of bunching behaviour around our reporting thresholds, we need to clearly separate responses to tax prices from those caused by changes in thresholds. We do so by focusing on the period 2003-2007, since this is the
22In this sample we do not include the public sector even though this sector is highly unionised. This is due to the existence of two different rates for the union membership fee in the public sector. Since we cannot observe which workers are subject to which rate we cannot correct the measure for membership fees in this sector.
longest period in the data for which the reporting environment remains constant.23
Table 2 shows our results for these samples split across panels A to C. Columns (1)-(2) report estimates using the first-pound price IV strategy, and columns (3)-(4) the results using the differenced IV strategy with a time horizon of one year.24 Panel A shows elasticity estimates pooling across all types of workers in the period in question (2003-2007), while panel B only considers those who never bunch at a reporting threshold.25 Results from both the IV and differenced-IV estimation strategies show that the never-buncher group displays much more sensitivity to price changes than the collective group of workers, with estimated elasticities in panel B doubling in magnitude compared to those in panel A. Results are also striking when we consider only workers who at some point bunch at a threshold value. As panel C shows, this group is much less responsive to price changes. Estimated elasticities are around half the size of the estimates for the entire group and about a quarter of the size of the estimates for the non-bunchers. For robustness, we repeat the analysis using instead either the sample of all highly unionised sectors, or our full sample. The results, shown in Appendix Tables 16 and 17, reveal the exact same patterns. In these samples the estimated differences are somewhat smaller, consistent with the fact that we cannot precisely separate bunchers from non-bunchers given the noise in the donation measure.
5.2 Assessing bunching stickiness
Our elasticity results are in line with a situation where bunching behaviour around reporting thresh-olds is sticky and hence workers who bunch at the threshthresh-olds need strong incentives to change behaviour. If these differences are driven by stickiness around reporting thresholds then the dif-ferences above should be driven by bunchers being less likely to react to price changes, and not from bunchers reacting less to a fixed price change compared to non-bunchers. To check this, we non-parametrically calculate the proportion of workers changing their reported donations year-to-year depending on whether they were bunching the previous year-to-year. If we look at what proportion of workers change the amount they report in donations from one year to the next, we calculate this at 38% for those who bunched at a threshold the previous year, and at 79% for those who did not. If
23
In both years 2003 and 2008 for instance, we observe changes in both marginal tax rates and hence prices. Note that we cannot look exclusively at the last period 2008-2010, since we have no variation in tax rates in this period. Including however the period before 2003 does not affect our findings.
24We use a time horizon of one year, since we are looking at a relatively short time period. However, if we use the full sample period and estimate the elasticity using different time horizons, results are not sensitive to the choice of horizon.
Table 2:
Elasticity of donations with respect to price - bunchers vs. non-bunchers (2003-2007)
(1) (2) (3) (4)
Price variable IV IV IV∆k=1 IV∆k=1
Panel A: All workers
ln(1−τ∗) −0.642 (0.169) ∗∗∗ −0.658 (0.180) ∗∗∗ ∆ln(1−τ∗) −0.419 (0.160) ∗∗∗ −0.375 (0.154) ∗∗∗ Observations 17 955 17 955 15 957 15 957 R2 0.62 0.62 0.20 0.21
Panel B: Excluding bunchers
ln(1−τ∗) −1.462 (0.335) ∗∗∗ −1.517 (0.372) ∗∗∗ ∆ln(1−τ∗) −0.818 (0.261) ∗∗∗ −0.786 (0.247) ∗∗∗ Observations 5 336 5 336 4 586 4 586 R2 0.72 0.72 0.27 0.28
Panel C: Only bunchers
ln(1−τ∗) −0.294 (0.188) −0.306 (0.191) ∆ln(1−τ∗) −0.253 (0.203) −0.207 (0.198) Observations 12 619 12 619 11 371 11 371 R2 0.52 0.52 0.17 0.18 Individual FE X X X X Year FE X X X X Controls - X - X
Notes: The sample includes all workers from the banking sectors in years 2003-2007. In all specifications we control for income. Additional controls include age squared and a dummy for changing employer. We drop people below the first tax bracket (i.e. people with no tax liability). We report robust standard errors clustered at the individual level in parenthesis, *** p<0.01, ** p<0.05, * p<0.1.
we only look at workers in years where they experience a change in the first-pound price then these fractions increase to 44% and 91% respectively. These numbers support the idea of stickiness in
behaviour around thresholds since both unconditional and conditional on a price change, bunchers are much less likely to change behaviour from one year to the next.
We next check our non-parametric measures by repeating this analysis in a regression framework in order to include controls. Table 3 reports results from a simple linear probability model where the
Table 3:
Buncher stickiness - Linear probability model
(1) (2) (3) (4) All All ∆(1−τ∗)6= 0 ∆(1−τ∗)6= 0 1(buncher) −0.403 (0.007) ∗∗∗ −0.391 (0.007) ∗∗∗ −0.474 (0.013) ∗∗∗ −0.458 (0.013) ∗∗∗ Constant 0.785 (0.004) ∗∗∗ 0.813 (0.011) ∗∗∗ 0.913 (0.004) ∗∗∗ 0.895 (0.015) ∗∗∗ Observations 20 621 20 621 6 567 6 567 R2 0.16 0.20 0.27 0.28 Year FE - X - X Controls - X - X
Notes: The sample includes workers from the banking sector in years 2003-2007. Controls include age squared, salary and a dummy for changing employer. We drop people below the first tax bracket (i.e. people with no tax liability). In columns (3) and (4) we restrict only to workers experiencing a change in the first-pound price. We report robust standard errors clustered at the individual level in parenthesis, *** p<0.01, ** p<0.05, * p<0.1.
outcome variable is an indicator for changing reporting from one year to the next. On the right hand side we include an indicator for being located at a threshold value i.e. being a buncher, a constant and potential controls. Column (1) simply shows the unconditional average fractions reported above. In column (2) we control for year fixed effects, age squared, salary and a dummy for changing employer and results remain unchanged. Column (3) reports the conditional average fractions discussed above, where we only look at individuals experiencing a change in price. As before, adding controls makes little difference to the results. Tables 18 and 19 in the Appendix report results using the alternative samples of either all highly unionised sectors or all sectors. Both tables show results very much in line with our main estimates, providing further evidence of a large and statistically significant dif-ference between bunchers and non-bunchers in the probability of changing reporting behaviour and reacting to price-changes. This supports the idea that the large effect of these reporting thresholds
on elasticities comes from sticky bunching behaviour around the threshold values. Understanding how reporting thresholds affect the way people respond to subsidies is essential when thinking about designing a well-functioning enforcement system in combination with a subsidy level that promotes the desired behaviour. It is also paramount for the external validity and interpretation of various estimates of the elasticity of giving with respect to price as well as other similar elasticities.26
6
Conclusion
This paper studies behavioural responses to a widely-used tax enforcement policy that combines ele-ments of self- and third-party reporting, using the context of charitable contributions in the Republic of Cyprus. We exploit multiple sources of quasi-experimental variation in reporting requirements and tax price subsidies to present several policy-relevant results.
First, we show evidence of substantial reactions to this hybrid reporting policy. Exploiting salary-dependent cutoffs that govern documentation requirements and a regression discontinuity approach, we estimate that reported donations increase by 0.7 pounds when taxpayers can report one pound more without providing corroborating information from a third party. Second, by utilising a reform that retroactively shifted the location of the threshold activating the need for documentation we show that a very large part of this response is purely a reporting adjustment. Our bunching analysis reveals that at least 64 percent of the response is purely due to changes in reporting and not to changes in real giving. Finally, we show that the presence of such reporting thresholds has a strong effect on taxpayers’ responses to other taxes and subsidies. We estimate the elasticity of charitable contributions with respect to the tax price of giving, using quasi-experimental variation in tax prices generated by income tax reforms. We find that this elasticity is significantly affected by sticky be-haviour in contributions induced by the reporting thresholds.
Our findings have important implications, both for policy and tax theory. The very strong be-havioural responses, observed around the reporting thresholds, imply that this hybrid policy strongly influences misreporting of deductions and can consequently have a large effect on government rev-enue. Further, our results imply that taxpayers’ responses to tax subsidies would be much stronger in the absence of embedded thresholds determining the strictness of reporting requirements. To the extent that the fiscal authority wants to incentivise certain forms of behaviours that generate positive
26In the results above we do not explicitly deal with censoring coming from people reporting zero donations. In general, this can potentially create bias because such observations are excluded due to the logarithmic specification. In our setting however this is not a concern since 87% of tax filers report positive donations.
externalities, it is crucial to understand the conditions under which tax subsidies cannot achieve this goal. Moreover, given that such thresholds are common in the tax systems of many countries, the design of information reporting thresholds warrants a more direct incorporation in optimal tax theory.