PERFORMANCE EVALUATION SYSTEM FOR DECISION TREE
ALGORITHMS
Deepali Saini, Prof. Anand Rajavat
Department Of Computer Science & Engineering, Shri Vaishnav Institute of technology and science,RGPV University Bhopal
Email: [email protected], [email protected]
ABSTRACT
In the machine learning process, classification can be described by supervise learning algorithm. Classification techniques have properties that enable the representation of structures that reflect knowledge of the domain being classified. Industries, education, business and many other domains required knowledge for the growth. Some of the common classification algorithms used in data mining and decision support systems is: Neural networks, Logistic regression, Decision trees etc. The decision regarding most suitable data mining algorithm cannot be made spontaneously. Selection of appropriate data mining algorithm for Business domain required comparative analysis of different algorithms based on several input parameters such as accuracy, build time and memory usage.
To make analysis and comparative study, implementation of popular algorithm required on the basis of literature survey and frequency of algorithm used in present scenario. The performance of algorithms are enhanced and evaluated after applying boosting on the trees. We selected numerical and nominal types of dataset and apply on algorithms. Comparative analysis is perform on the result obtain by the system. Then we apply the new dataset in order to generate generate prediction outcome.
Indexing terms/Keywords
Recommender System, Classification and Decision tree..
Council for Innovative Research
Peer Review Research Publishing SystemJournal:
INTERNATIONAL JOURNAL OF COMPUTERS & TECHNOLOGY
Vol 11, No.8
[email protected]
1. INTRODUCTION
Extraction of knowledge from data in a human-understandable structure is the main goal of data mining. The process of data mining consists of three stages: Exploration, Model building and deployment. In the exploration stage data preparation mainly include cleaning data, data transformation, selection of subset records and for large data sets with large number of features it also require to do feature selection. In model building and validation we have a variety of models and select the best one based on their predictive performance i.e. produces good results from the given samples. Than final stage involves, choose the best model selected in the previous stage and applying it to the new data in order to generate predictions or estimates of the expected outcome. But the output of mining is depending on data set and the algorithm used. Sometimes data is not classified as per need of application because of algorithms are not much suitable for the given data set.
Some of the common classification algorithms used in data mining and decision support systems is: Neural networks, Logistic regression, Decision trees etc. A decision tree is a tree in which each branch node represents a choice between a number of alternatives, and each leaf node represents a decision.
In this project we concentrate over a real word problem for prediction using previous data analysis. Here we select tree different data formats and apply our algorithm to know the answers of the following questions.
1. Is size of dataset affect the performance of the decision tree?
2. What is the affect of data types over the performance of decision tree? 3. Which algorithm is performing better with the nominal data set? 4. Which algorithm is best fit for classification of numerical dataset?
2. INTRODUCTION TO DECISION TREE ALGORITHM
A decision tree is a tree structure which classifies an input sample into one of its possible classes. Decision trees are used to extract knowledge by Inferring decision making rules from the huge amount of available information. Decision tree is a useful tool in classification. A decision tree classifier has a simple form which can be compactly stored and that efficiently classifies new data. Decision tree classifiers can perform automatic feature selection and complexity reduction, while the tree structure gives easily understandable and interpretable information regarding the predictive or generalization ability of the data. A decision tree recursively partitions a data set into smaller subdivisions on the basis of tests applied to one or more features at each node of the tree.
Because of their tree structure and ability to easily generate rules decision trees are the favored technique for building understandable models. Because of this clarity they also allow for more complex profit and ROI models to be added easily in on top of the predictive model. For instance once a customer population is found with high predicted likelihood to attrite a variety of cost models can be used to see if an expensive marketing intervention should be used because the customers are highly valuable or a less expensive intervention should be used because the revenue from this sub-population of customers is marginal.
Decision trees are data mining technology that has been around in a form very similar to the technology of today for almost twenty years now and early versions of the algorithms date back in the 1960s. Often times these techniques were originally developed for statisticians to automate the process of determining which fields in their database were actually useful or correlated with the particular problem that they were trying to understand. Partially because of this history, decision tree algorithms tend to automate the entire process of hypothesis generation and then validation much more completely and in a much more integrated way than any other data mining techniques. They are also particularly adept at handling raw data with little or no pre-processing. Perhaps also because they were originally developed to mimic the way an analyst interactively performs data mining they provide a simple to understand predictive model based on rules (such as “90% of the time credit card customers of less than 3 months who max out their credit limit are going to default on their credit card loan.”).
3. OVERVIEW OF CLASSIFICATION ALGORITHM USING DECISION TREES
This section presents overview of various decision tree algorithms developed so far. One of the advantages of using classification trees is their ability to provide easy to understand classification rules. Each node of a classification tree is a rule.
3.1
Classification and Regression Tree (CART)
CART is a recursive partitioning method used both for regression and classification. CART is constructed by splitting subsets of the data set using all predictor variables to create two child nodes repeatedly. The best predictor is chosen using a variety of impurity or diversity measures. The goal is to produce subsets of the data which are as homogeneous as possible with respect to the target variable.
Quick, Unbiased, Efficient Statistical Tree (QUEST) is a binary-split decision tree algorithm. It can be used with univariate or linear combination splits. its attribute selection method has negligible bias. If all the attributes are uninformative with respect to the class attribute, then each has approximately the same change of being selected to split a node.
1. The visual display enables users to see the hierarchical interaction of the variables;
2. Further, because simple if then rules can be read right off the tree, models are easy to grasp and easy to apply to new data.
3. CART uses strictly binary, or two-way, splits that divide each parent node into exactly two child nodes by posing questions with yes/no answers at each decision node.
4. CART is unique among decision-tree tools. CART- proven methodology is characterized by: a. Reliable pruning strategy - CART developers
determined definitively that
b. no stopping rule could be relied on to discover the optimal tree,
c. Powerful binary-split search approach – CART binary decision trees are more sparing with data and detect more structure before too little data is left for learning.
d. Automatic self-validation procedures - in the search for patterns in databases it is essential to avoid the trap of over fitting
e. Further, the testing and selection of the optimal tree are an integral part of the CART algorithm. f. It has automated solutions that surrogate splitters intelligently handle missing values;
g. multiple-tree, committee-of-expert methods increase the precision of results.
3.2 C4.5 Algorithm
C4.5 (Quinlan,1993) is an extension of ID3 algorithm.Information Gain used in ID3 algorithm always tends to select attributes that have a large number of values since the gain of such an attribute would be maximal. To overcome this drawback Quinlan (1993) suggested the use of Gain Ratio as a measure to select the splitting attribute instead of Information Gain.
)
,
(
)
,
(
)
,
(
A
S
Split
A
S
Gain
A
S
Gain
Where Split(S,A) is the information due to the split of S on the basis of the value of the attribute A.
)
/
..
...
/
(
)
,
(
S
A
I
S
1S
S
S
Split
m (2)Where S1, S2,…Sm are the partitions induced by attribute A in S.
3.3 SLIQ Algorithm
SLIQ is a decision tree classifier that can handle both numerical and categorical attributes it builds compact and accurate trees. It uses a pre-sorting technique in the tree growing phase and an inexpensive pruning algorithm. It is suitable for classification of large disk-resident datasets, independently of the number of classes, attributes and records.
TreeBuilding
MakeTree (Training Data T) Partition (T)
Partition (Data S)
If (all points in S are in the same class) Then return;
Evaluate Splits for each attribute A; Use best split to partition S into S1 and S2; Partition (S1);
Partition (S2);
The gini index is used to evaluate the “goodness” of the alternative splits for an attribute If a data set T contains examples from n classes, gini(T) is defined as
Equation no 4.2
Where pj is the relative frequency of class j in T. After splitting T into two subset T1and T2 the gini index of the split data is defined as
Equation no 4.3
The first technique implemented by SLIQ is a scheme that eliminates the need to sort data at each node It creates a separate list for each attribute of the training data. A separate list, called class list, is created for the class labels attached to the examples. SLIQ requires that the class list and (only) one attribute list could be kept in the memory at any time.
3.4 Boosting Algorithm
This algorithm is introduced by R. Shapire in [3]. In Bagging, the base models are generated, at least logically, independently and in parallel, on the other hand boosting is a sequential procedure mainly applied to classification, where the performance of a preceding model is used when generating all subsequent models. The main principle is that difficult training instances are assigned a higher weight, making the base models focus on these instances. More specifically, each training instance is initially assigned the same weight but after training one model, the instances incorrectly classified have their weights increased, while those correctly classified have their weights decreased. The weights are either used as part of the score function or to prioritize instances with higher weights when bootstrapping.Below is a generic description of Boosting.
INPUT:
D // Training data having N instances W // A weight vector of size N M // Number of times to boost OUTPUT:
P // Prediction from ensemble Algorithm (Boosting):
set all weights to 1/N do M times
train a model on D
find all instances in D that the model predicts wrong increase the weights of those instances
decrease the weights of the others
Ensemble prediction is weighted vote from all models trained
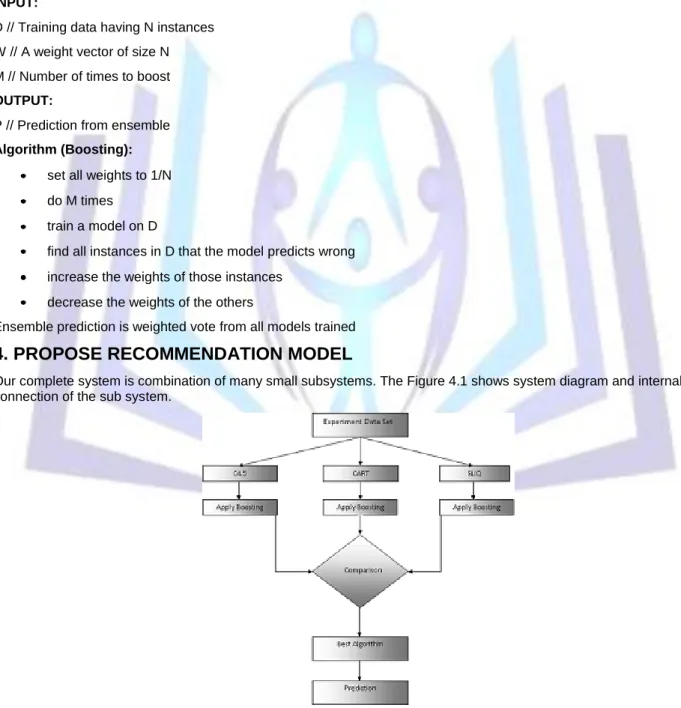
4. PROPOSE RECOMMENDATION MODEL
Our complete system is combination of many small subsystems. The Figure 4.1 shows system diagram and internal connection of the sub system.
Experimental data set:
This step involves selection of data set which contains information related to data by which we construct model for evaluation. Here we collect data of different size and different types. We use nominal data (car evaluation) and numerical data (Auto Imports) both to evaluate results.
Data Analysis Models:
We use three most popular decision tree models namely C4.5, CART and SLIQ. The tree forming process is depending upon data supplied to build model and techniques used by different algorithms.
Build Model:
It is tree building process by which data is parsed and using the data, system generates tree structure. Parameter Evaluation:
In this phase data model is prepared and evaluation process is started. The evaluation of constructed model is done using cross validation process. In this cross validation process we randomly select data supply them over the build model, model predicts its output values and we compare the predicted values to the real values. And according to these predicted values we define accuracy and error rate. Graphs are plot to evaluate accuracy, build time, search time and memory usage.
Boosting:
This phase involve performance enhancement technique by which we re-adjust our build model. And using this technique we improve accuracy of models.
Prediction:
Here we use our constructed model for prediction according to the data enters by user.
5. RESULT EVALUATION WITH NOMINAL DATA
5.1 Graph Representation between C4.5, CART and SLIQ in Context of Accuracy
The below given graph show the accuracy of the C4.5, CART and SLIQ algorithm. All three algorithm shows one characteristic when size of data set is small then accuracy is high and data set size is large the accuracy is reduced. By using graph we can see at the initial state when the size of data set is too large then SLIQ and CART reflect similar accuracy. And as size reduces the similarity of accuracy pattern between C4.5 and CART is much similar.
70 80 90 100
958 793 581 382 166
Fig 2: Comparative Analysis of Accuracy without Boosting
5.2 Graph Representation between C4.5, CART and SLIQ in Context of Accuracy with
Boosting
The above derived results are simple C4.5, SLIQ and CART here we describe the change after boosting of these algorithms. After boosting we can see the accuracy of all algorithms are increased and all algorithm shows similar resultant after boosting. In the below given graph all three lines having similar up and downs as the size of data set increased or decreased .
80 90 100
958 793 581 382 166
5.3 Graph Representation between C4.5, CART and SLIQ in Context of Build Time
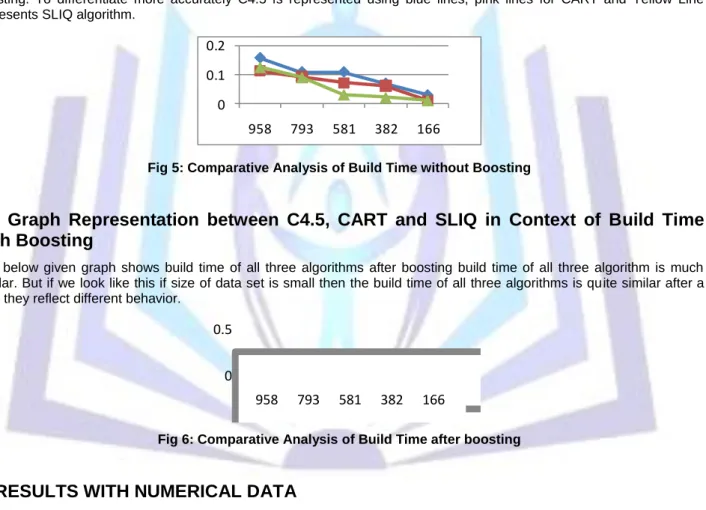
Here we show the comparison between three algorithms in the domain of time in both manners with boosting and without boosting. To differentiate more accurately C4.5 is represented using blue lines, pink lines for CART and Yellow Line represents SLIQ algorithm.
0 0.1 0.2
958 793 581 382 166
Fig 4: Comparative Analysis of Accuracy without Boosting
5.4 Graph Representation between C4.5, CART and SLIQ in Context of Build Time
Here we show the comparison between three algorithms in the domain of time in both manners with boosting and without boosting. To differentiate more accurately C4.5 is represented using blue lines, pink lines for CART and Yellow Line represents SLIQ algorithm.
0 0.1 0.2
958 793 581 382 166
Fig 5: Comparative Analysis of Build Time without Boosting
5.5 Graph Representation between C4.5, CART and SLIQ in Context of Build Time
with Boosting
The below given graph shows build time of all three algorithms after boosting build time of all three algorithm is much similar. But if we look like this if size of data set is small then the build time of all three algorithms is quite similar after a time they reflect different behavior.
0 0.5
958 793 581 382 166
Fig 6: Comparative Analysis of Build Time after boosting
6 RESULTS WITH NUMERICAL DATA
6.1 Graph Representation between C4.5, CART and SLIQ in Context of Accuracy
The below given graph show the accuracy of the C4.5, CART and SLIQ algorithm. With numeric dataset SLIQ perform better than C4.5 and CART one of the reason is that SLIQ first sort the data and then build the model.
70 90 110
1230 1056 895 607 255
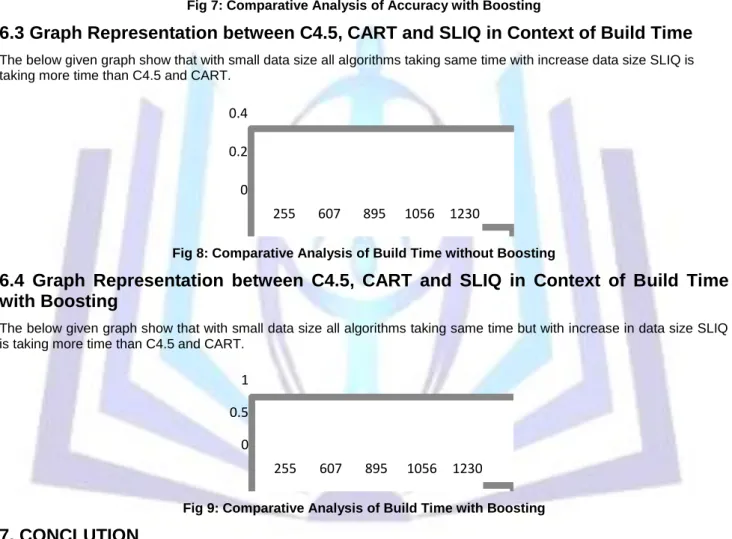
Fig 7: Comparative Analysis of Accuracy without Boosting
6.2 Graph Representation between C4.5, CART and SLIQ in Context of Accuracy with
Boosting
The below graph shows the accuracy of the C4.5, CART and SLIQ algorithms with boosting. As shown in graph after boosting all algorithms shows similar result.
70 80 90 100 110 255 607 895 1056 1230 Fig 7: Comparative Analysis of Accuracy with Boosting
6.3 Graph Representation between C4.5, CART and SLIQ in Context of Build Time
The below given graph show that with small data size all algorithms taking same time with increase data size SLIQ is taking more time than C4.5 and CART.
0 0.2 0.4
255 607 895 1056 1230
Fig 8: Comparative Analysis of Build Time without Boosting
6.4 Graph Representation between C4.5, CART and SLIQ in Context of Build Time
with Boosting
The below given graph show that with small data size all algorithms taking same time but with increase in data size SLIQ is taking more time than C4.5 and CART.
0 0.5 1
255 607 895 1056 1230
Fig 9: Comparative Analysis of Build Time with Boosting
7. CONCLUTION
In this paper we have compared the performance and usefulness of different decision tree algorithms for classifying data in knowledge based system.
We analyze the results using various parameters like accuracy, memory usage and build time. In complete implementation of proposed work, we found results that are listed below:
We analyze the effect of the data size on selected algorithm and found that parameters accuracy, build time etc. also changes with changing the data size. We also found that accuracy improves after applying boosting on the decision tree algorithms.
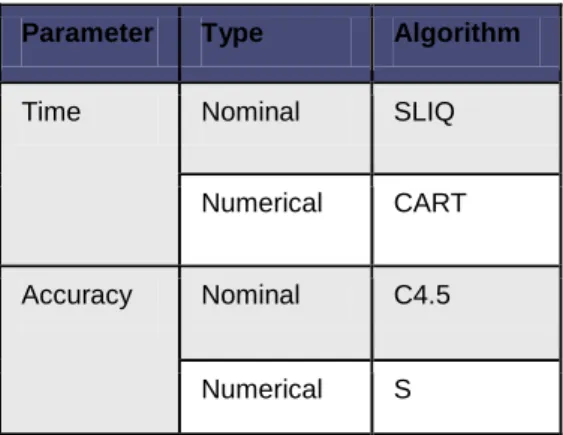
Table 1: Result analysis on the basis of Time and Accuracy.
As we can see by the result that for time critical application, for nominal data type SLIQ performing best i.e. for application like polar molecular surface area and for numerical data type CART is best which can be used by application like share market. C4.5 performed better with nominal data type so it can be implement in application like student performance, online shopping etc.
8. FUTURE WORK
We can use algorithms that can be made dynamic to change tree automatically.
Proposed system compares the performance in terms of parameters like accuracy, time and memory. More parameter can be evaluated to compare the performance
REFERENCE
[1] Zhu Xinjuan Huang Junfang Qi Yang,”An Apperal Recommender System Based on Data Mining” Published in 2010, International Conference on Web Information Systems and Mining.
[2] Matthew N. Anyanwu, Sajjan G. Shiva,”Comparative Analysis of Serial Decision Tree Classification Algorithms” Published in 2008.International Journal of Computer Science and Security. Vol (3) : Issue (3) .
[3] Zhao Lu, ZhengXinqi, Yan Hongwen, Wang Shuqing and Zhang Kouqiang, ”Construction and Application of the Decision Tree Model for Agricultural Land Grading Based on MATLAB” Published in 2009.Second International Work Shop on Knowledge Discovery and Data Mining.
[4] Zheng Guo-Cheng, Liu Shu-Fen and Wu Long, “Application of Multi-level Compressed Decision Tree in Computer Forensics” Published in 2008, Proceedings of the 24th VLDB conference, New York, USA. pp. 416- 427.
[5] Xiaodong Zhu, Jie Cao, Yue Dai ,” A Decision Tree Model for Meteorological Disasters Grade Evaluation of Flood” Published in 2011, Fourth International Joint Conference on Computational Science and Optimization .
[6] Marijana Zekic-Susac, Natasa Sarlija, Mirta Bensic, “Small Business Credit Scoring: A Comparision of Logistic Regression and Decision Tree Models” Published in 2004, Information Technology Interfaces ITI.
[7] Zhu Xiaoliang, Wang Jian, Yan Hongcan and Wu Shangzhuo, “Research and Application of the improved Algorithm C4.5 on Decision Tree” Published in 2009,International Conference on test and Measurement.
[8] Jerzy W. Girymala-Busse,”Rought Set and CART Approaches to Mining Incomplete Data” Published in 2010,Institute of Science, Polish Academy of Science.
[9] Du, W., Zhan, Z. (2002). Building decision tree classifier on private data, Proceedings of the IEEE international conference on Privacy, security and data mining, pp.1-8, Maebashi City, Japan.
[10] Song Danwa, Han Ning, Liu Dandan ,”Construction of forestry resource classification rule decision tree based on ID3” Published in 2009, First International Workshop on Education Technology and Computer Science.
[11] Breiman, L., Friedman, J., Olshen, L and Stone, J. (1984). Classification and Regression trees. Wadsworth Statistics/Probability series. CRC press Boca Raton, Florida, USA.
[12] Gu Yu, Guo Wenjuan, “Apply the Decision tree model to enterprise information indicators analysis” Published in 2010, International forum on information technology and application.
Parameter Type Algorithm
Time Nominal SLIQ
Numerical CART
Accuracy Nominal C4.5