Data Article
Dataset on the mean, standard deviation,
broad-sense heritability and stability of wheat
quality bred in three different ways and grown
under organic and low-input
conventional systems
Marianna Rakszegi
a,n, Franziska Löschenberger
b,
Jürg Hiltbrunner
c, Gyula Vida
a, Péter Mikó
a aAgricultural Institute, Centre for Agricultural Research, Hungarian Academy of Sciences, Brunszvik u. 2, 2462 Martonvásár, Hungary
bSaatzucht Donau GmbH & Co KG, Saatzuchtstrasse 11, 2301 Probstdorf, Austria c
Agroscope, Institut für Pflanzenbauwissenschaften IPB, Reckenholzstrasse 191, 8046 Zürich, Switzerland
a r t i c l e i n f o
Article history: Received 18 April 2016 Received in revised form 20 April 2016
Accepted 27 April 2016 Available online 4 May 2016
a b s t r a c t
An assessment was previously made of the effects of organic and low-inputfield management systems on the physical, grain com-positional and processing quality of wheat and on the performance of varieties developed using different breeding methods (“ Com-parison of quality parameters of wheat varieties with different breeding origin under organic and low-input conventional condi-tions”[1]). Here, accompanying data are provided on the perfor-mance and stability analysis of the genotypes using the coefficient of variation and the‘ranking’and‘which-won-where’plots of GGE biplot analysis for the most important quality traits. Broad-sense heritability was also evaluated and is given for the most important physical and quality properties of the seed in organic and low-input management systems, while mean values and standard deviation of the studied properties are presented separately for organic and low-inputfields.
&2016 The Authors. Published by Elsevier Inc. This is an open access article under the CC BY license (http://creativecommons.org/licenses/by/4.0/).
Contents lists available at
ScienceDirect
journal homepage:
www.elsevier.com/locate/dib
Data in Brief
http://dx.doi.org/10.1016/j.dib.2016.04.065
2352-3409/&2016 The Authors. Published by Elsevier Inc. This is an open access article under the CC BY license (http://creativecommons.org/licenses/by/4.0/).
DOI of original article:http://dx.doi.org/10.1016/j.jcs.2016.04.006 nCorresponding author. Tel.:þ3622569500.
E-mail address:[email protected](M. Rakszegi).
Speci
fi
cations table
Subject area
Biology
More speci
fi
c
sub-ject area
Agriculture, organic farming, wheat breeding
Type of data
Tables and Figures
How data was
acquired
Foss Tecator 1241, Perten Falling Number system 1500, Kjeltec 1035 Analyser,
Glutomatic 2200, SediCom System, Marvin System, Perten SKCS 4100,
Bra-bender Farinograph
Data format
Analysed
Experimental
factors
Seed was milled on a Chopin CD1 laboratory mill
Experimental
features
Physical, grain compositional and processing quality properties of the wheat
were measured with standard methods
Data source
location
Martonvasar, Hungary
Data accessibility
Data are provided in the paper
Value of the data
This data set could help to select stable varieties for organic or low-input farming purposes.
As the data originate from and compare organic and low-input conventional systems this makes it
possible to compare them with organic contra high-input conventional systems.
Although the varieties compared included the product of organic, conventional and combined
(BFOA) breeding, conventional varieties were still dominant, which highlights the need for
development in the
fi
eld of organic
‘
breeding
’
and farming.
The practical usefulness of the stability analysis could be even better if a more robust variety set
and more growing sites were included in the analysis.
1. Data
Datas on the stability of thirty-seven wheat genotypes based on their physical, grain compositional
and processing quality traits are presented using the coef
fi
cient of variation and GGE biplot analysis.
The mean, standard deviation and broad-sense heritability values of the most important traits were
also calculated for organic and low-input systems distinguishing the varieties with different breeding
origin as well.
2. Experimental design, materials and methods
2.1. Plant material
Thirty-seven winter wheat varieties and breeding lines were sown at organic and conventional
low input sites (hereafter
’
low input
’
) in two different countries (Austria, Hungary) in 2011, 2012 and
2013. The varieties originated from 5 different countries (Austria, France, Germany, Hungary and
Switzerland) and were bred in three different ways
[2]
, nine on certi
fi
ed organic
fi
elds (Donnato,
Aszita, Wiwa, Scaro, Butaro, Jularo, Sandomir, Gulliver, Karachow), 20 on conventional
fi
elds (Mv
Emese, Mv Béres, Mv Kolo, Mv Kolompos, Mv Tallér, Lukullus, Arnold, Capo, Midas, Claro, Lorenzo,
Suretta, Titlis, Montdor, CH111-14426, CH111-14663, CH111-14631, Folklor, Renan, Flamenco), and
eight (Blasius, Peppino, Pireneo, Stefanus, Bitop, Tobias, Hendrix, Skerzzo) using a combined method
(breeding for organic agriculture-BFOA) including selection under conventional conditions in early
generations (usually up to F5) followed by selection in late generations on certi
fi
ed organic farms
[3]
.
M. Rakszegi et al. / Data in Brief 7 (2016) 1617–1632 1618
Table 1
Main growing conditions and management parameters of organic and low inputfields at trial locations in Hungary (H) and Austria (A) in three growing seasons in the winter bread wheat ring test.
Growing conditions Trial location: countrymanagement system
HO HLI AO ALI
Location Geographical coordinates 47.3N, 18.8E 48.2N, 16.6E
Altitude 115 m 150 m Weather conditions* Total precipitation (mm) 2010/2011 248.7 367.6 2011/2012 217.2 207.5 2012/2013 387.5 485.3 Average temperature (°C) 2010/2011 8.2 7.2 2011/2012 8.4 7.8 2012/2013 8.0 7.1
Average soil parameters Soil type Chernozem Chernozem Chernozem Chernozem
pH (KCl) 7.25 7.25 7.4 7.4
Humus (m/m %) 2.6 2.8 3.0 3.0
P2O5(mg/kg) 440 210 144 144
K2O (mg/kg) 245 210 299 299
Yearly average of N input through NPK combined fertilizer (active ingredient, kg/ha)
0 120 0 126
Growing parameters Previous crop 2010/2011 Sunflower Maize Lathyrussp. Sugar beet
2011/2012 Alfalfa Oilseed rape Field pea Field pea
2012/2013 Field pea Oilseed radish Lentils/bitter-cress Sugar beet
Sowing density 450 seeds/m2 350 seeds/m2
Growing period (days) 2010/2011 272 271 264 268
2011/2012 260 260 275 262
2012/2013 271 271 274 273
*
Parameters refer only to the growing period (basically between October and July).
M. Rak szegi et al. / Data in Brief 7 (20 1 6 ) 1 6 17 – 1 632 16 19
Table 2
Broad-sense heritability (h2
), mean values with standard deviations (SD), variance components estimate and their standard errors (7SE) for genotype (G), genotypeenvironment (GE) interaction and error variance for grain yield, thousand-kernel weight, gluten spread and gluten index (2011–2013, Austria and Hungary, organic and low input sites).
Trait (unit) Organic management Low input conventional management
Mean SD G GxE Error h2
Mean SD G GxE Error h2
σ2
G 7SE σ2GE 7SE σ2e 7SE σ2G 7SE σ2GE 7SE σ2e 7SE Grain yield (t/ha) 4.38 1.71 0.07**
0.02 0.07*** 0.02 0.25 0.02 0.85 4.61 2.08 0.08* 0.03 0.17*** 0.03 0.41 0.03 0.70 Thousand kernel weight (g) 40.40 4.46 7.68*** 1.99 1.64*** 0.43 3.24*** 0.32 0.96 41.79 5.35 7.95*** 1.99 1.99*** 0.35 1.45*** 0.15 0.96 Gluten spread (mm) 4.81 2.99 6.23*** 1.58 0.93*** 0.19 0.84*** 0.09 0.97 4.91 3.09 4.95*** 1.31 2.63*** 0.37 0.82*** 0.09 0.92 Gluten index 90.23 12.34 126.83*** 30.72 15.55*** 2.72 8.25*** 0.88 0.98 90.83 12.82 158.64*** 37.64 15.27*** 2.01 5.00*** 0.53 0.98 σ2
G,σ2GE,σ2e¼genotypic, genotypeenvironment interaction and residual variance components, respectively.
*
Significant at the 0.05 probability levels, respectively.
**
Significant at the 0.01 probability levels, respectively.
***
Significant at the 0.001 probability levels, respectively.
M. Rak szegi et al. / Data in Brief 7 (20 1 6 ) 1 6 17 – 1 632 1 620
Table 3
Mean values of 37 genotypes for two countries and two management systems (GS: growing site, TW: test weight, TKW: thousand kernel weight, KW: kernel width, HI: hardness index, GI: gluten index, Wabs: water absorption, QN: quality number, ORG: organic variety, CONV: conventional variety, BFOA (breeding for organic agriculture): variety developed by a combined method, A: Austria, H: Hungary, O: organic site, LI: low input site).
Breeding Genotype GS Yield TW TKW KW HI Protein Gluten GI Zeleny Wabs Stability QN
(t/ha) (kg/100 l) (g/1000) (mm) (%) (%) (ml) (%) (min)
ORG ASZITA ALI 4.68 82.50 34.43 3.05 72.39 15.40 42.10 60.22 29.00 64.90 3.90 57.30
AO 3.86 81.40 33.81 3.07 70.69 16.10 42.60 58.06 28.00 66.30 6.00 65.90
HLI 3.95 83.40 35.41 3.10 71.93 14.40 42.13 62.68 30.00 67.10 4.90 62.40
HO 4.30 79.80 34.32 3.02 75.86 15.70 43.95 67.27 30.00 69.30 7.40 72.80
ORG BUTARO ALI 5.20 83.70 44.93 3.35 54.02 16.40 42.04 86.60 43.00 68.50 14.00 88.60
AO 3.83 84.10 45.22 3.35 56.62 16.00 35.18 90.30 39.00 72.70 6.10 75.70
HLI 4.47 84.90 43.35 3.31 58.32 15.10 39.33 91.28 43.00 68.90 13.30 85.50
HO 4.68 81.10 43.12 3.33 55.21 15.80 41.76 91.55 47.00 71.80 14.50 87.90
ORG DONNATO ALI 6.08 82.50 44.87 3.35 50.70 14.00 32.01 96.68 34.00 60.40 12.50 73.70
AO 5.10 81.90 42.73 3.30 51.03 14.40 32.22 94.34 35.00 63.10 15.40 100.00
HLI 5.09 83.10 46.00 3.34 54.33 12.90 31.06 95.75 30.00 61.00 11.30 68.60
HO 4.93 79.80 42.74 3.23 54.35 13.90 32.82 94.71 32.00 62.80 8.90 73.40
ORG GULLIVER ALI 5.69 83.30 45.02 3.38 37.81 15.90 39.21 85.37 35.00 57.80 10.50 73.70
AO 4.70 81.80 42.28 3.27 39.82 15.50 37.13 76.15 36.00 58.40 6.50 68.20
HLI 4.96 83.30 44.75 3.31 40.91 14.10 35.28 87.90 32.00 57.30 8.90 68.60
HO 5.09 81.40 43.37 3.30 42.12 15.60 36.43 85.67 34.00 55.70 4.00 42.60
ORG JULARO ALI 5.67 82.20 44.97 3.38 47.27 14.10 33.31 96.57 37.00 59.20 9.50 81.20
AO 4.54 80.60 43.45 3.37 47.71 15.00 30.78 91.92 37.00 62.80 8.40 100.00
HLI 4.89 82.20 44.63 3.33 51.94 13.20 31.61 95.48 34.00 58.10 17.40 82.90
HO 5.32 78.70 43.82 3.33 50.43 14.10 34.18 96.38 38.00 61.00 17.60 96.00
ORG KARACHOW ALI 4.56 79.60 38.25 3.13 48.62 17.40 50.94 39.88 28.00 60.20 4.20 59.80
AO 3.75 78.90 37.49 3.13 48.87 16.60 48.07 41.31 25.00 60.30 3.90 53.00
HLI 4.16 81.40 38.31 3.09 49.93 16.00 47.55 41.36 26.00 59.40 4.30 57.90
HO 4.03 78.10 37.58 3.05 50.46 16.30 48.95 42.56 28.00 59.00 2.80 43.90
ORG SANDOMIR ALI 5.56 83.20 37.25 3.10 62.89 14.90 38.46 87.30ab
36.00 63.10 9.20 81.90 AO 4.32 82.90 37.60 3.10 59.08 15.90 39.70 77.14a 36.00 67.70 9.20 79.00 M. Rak szegi et al. / Data in Brief 7 (20 1 6 ) 1 6 17 – 1 632 16 2 1
Table 3(continued)
Breeding Genotype GS Yield TW TKW KW HI Protein Gluten GI Zeleny Wabs Stability QN
(t/ha) (kg/100 l) (g/1000) (mm) (%) (%) (ml) (%) (min)
HLI 4.43 83.70 38.50 3.14 63.08 13.30 33.54 93.73b
31.00 62.40 16.80 81.60
HO 4.75 81.30 36.54 3.05 62.51 14.00 35.41 88.10ab
34.00 60.60 4.40 48.80
ORG SCARO ALI 5.56 83.70 40.52 3.23 58.07 14.30 35.09 92.96 40.00 58.90 14.80 77.70
AO 4.40 82.90 41.00 3.23 56.37 15.60 36.47 87.62 40.00 61.20 16.80 100.00
HLI 4.64 84.30 41.89 3.24 56.68 14.50 34.77 93.23 39.00 60.60 11.70 86.40
HO 4.84 80.90 40.32 3.22 59.07 14.40 35.20 94.91 40.00 61.20 15.70 76.00
ORG WIWA ALI 5.57 83.70 41.52 3.30 55.38 15.50 37.88 89.98 43.00 59.50 15.20 81.10
AO 4.28 82.80 42.15 3.30 55.40 16.10 39.80 84.39 41.00 62.50 16.80 96.00
HLI 4.19 83.90 40.97 3.26 56.75 14.90 36.60 92.63 42.00 62.30 12.60 87.40
HO 4.74 40.40 40.76 3.25 57.00 15.50 39.52 90.61 43.00 63.00 16.70 87.20
CONV ARNOLD ALI 5.87 85.10 41.84 3.28 56.05 15.50 38.41 97.39 42.00 63.70 15.9* 97.20
AO 4.80 85.00 39.50 3.20 54.61 16.00 36.73 97.58 42.00 64.80 6.60 100.00
HLI 4.51 85.00 43.04 3.30 60.04 15.20 37.43 96.61 39.00 67.00 8.20 100.00
HO 5.15 83.40 39.75 3.20 60.08 15.10 37.03 96.20 41.00 63.60 17.00 100.00
CONV CAPO ALI 6.25 84.30 40.75 3.20 57.83 14.20 34.36 97.49b
36.00 63.40 13.80 90.00 AO 4.97 83.30 40.25 3.20 54.95 15.60 37.97 87.57a 35.00 66.20 12.70 94.30 HLI 4.83 84.20 42.33 3.23 61.34 13.80 34.84 94.74ab 32.00 63.20 12.80 80.80 HO 4.93 82.50 40.07 3.18 60.93 14.00 34.99 94.61ab 31.00 61.20 5.20 55.90
CONV CLARO ALI 5.57 81.90 42.23 3.33 60.65 14.40 36.70 91.97 34.00 63.40 9.90 76.60
AO 4.64 82.10 41.76 3.30 57.93 14.70 37.17 84.55 34.00 66.30 8.00 79.80 HLI 4.99 83.00 40.48 3.23 60.98 14.30 36.86 88.58 32.00 64.90 9.30 78.30 HO 5.52 79.80 39.95 3.22 65.26 14.70 38.16 85.06 33.00 65.80 5.80 60.80 CONV CH111-14426 ALI 5.77 79.20 41.23 3.35 67.11 14.80 34.81 94.78 33.00 62.60 10.80 78.90 AO 4.81 79.30 44.17 3.40 64.75 15.80 36.73 90.35 32.00 63.30 16.50 100.00 HLI 5.08 80.90 42.85 3.36 66.51 13.80 32.11 94.63 29.00 65.10 10.00 82.90 HO 5.51 77.30 41.12 3.30 70.94 15.20 36.69 93.28 33.00 63.70 12.40 74.00 CONV CH111-14631 ALI 5.67 82.60 41.21 3.33 58.80 13.70 32.35 98.60 39.00 59.20 13.40 88.90 M. Rak szegi et al. / Data in Brief 7 (20 1 6 ) 1 6 17 – 1 632 1 622
AO 4.59 80.30 40.50 3.27 53.59 14.30 32.15 90.19 34.00 62.30 11.70 100.00 HLI 4.83 83.20 44.23 3.33 54.99 13.50 33.17 97.28 40.00 62.30 11.50 88.90 HO 5.09 80.20 42.17 3.28 60.69 13.50 32.09 98.64 37.00 60.80 17.30 86.00 CONV CH111-14663 ALI 5.84 81.70 35.86 3.18 63.50 14.40 34.04 95.31 34.00 59.80 7.10 62.20 AO 4.70 81.40 34.70 3.13 57.58 15.20 34.70 89.57 33.00 61.20 9.80 76.00 HLI 4.70 82.50 35.83 3.09 64.81 14.20 34.84 94.03 34.00 61.50 9.50 77.90 HO 5.35 79.10 35.03 3.10 66.88 14.70 35.76 91.91 35.00 61.20 6.30 64.00
CONV FLAMENKO ALI 5.78 75.20 37.59a
3.10 46.20 13.30 27.28 98.77 30.00 58.20 8.30 61.00
AO 4.92 73.60 35.82a
3.00 49.20 13.40 29.52 94.72 32.00 60.70 15.40 79.40
HLI 4.91 77.90 42.43b 3.19 47.12 12.10 27.00 97.04 29.00 59.50 8.10 65.40
HO 5.55 74.50 38.43ab 3.07 47.69 12.30 26.03 97.48 30.00 55.60 2.00 30.40
CONV FOLKLOR ALI 6.04 79.00b
38.31 3.18 55.86 13.10 27.64 98.50 34.00 59.60 6.30 70.10 AO 5.02 78.00b 36.14 3.07 54.19 13.90 29.62 97.86 37.00 60.30 9.10 100.00 HLI 5.68 77.50b 39.82 3.24 57.88 11.30 23.49 97.68 27.00 57.30 2.70 48.70 HO 5.35 71.90a 34.46 3.08 61.73 12.30 25.70 97.65 31.00 55.30 1.40 32.70
CONV LORENZO ALI 4.90 78.70 38.73 3.30 60.35 16.00 39.56 97.75 46.00 63.30 10.00 88.00
AO 4.55 79.60 38.66 3.27 57.81 15.80 36.95 96.20 45.00 64.00 15.50 100.00
HLI 4.63 80.60 40.60 3.31 59.51 15.80 41.02 96.25 48.00 66.70 10.20 88.80
HO 5.37 76.10 37.56 3.25 63.15 16.10 40.13 97.59 49.00 65.40 15.30 100.00
CONV LUKULLUS ALI 6.38b 83.00 43.14 3.28 50.01 14.70 34.69 98.22 41.00 61.30 11.10 91.70
AO 5.20ab 83.00 43.68 3.23 47.74 15.10 33.50 96.49 39.00 62.80 10.00 100.00
HLI 3.57a
82.90 42.26 3.26 49.86 13.80 32.47 98.07 37.00 64.80 13.90 96.00
HO 5.02ab
80.40 40.97 3.15 54.62 13.90 33.22 97.84 37.00 58.20 8.50 68.50
CONV MIDAS ALI 6.57 83.00 41.94 3.33 49.48 13.90 32.61 97.73 35.00 60.40 13.80 86.60
AO 5.44 82.20 40.56 3.27 49.00 14.20 31.43 94.41 35.00 60.30 18.00 100.00
HLI 5.86 83.60 42.71 3.33 50.75 12.50 29.46 96.05 30.00 60.70 14.70 79.00
HO 5.73 81.20 40.26 3.23 50.70 13.60 30.45 97.02 33.00 56.90 5.50 51.40
CONV MONTDOR ALI 5.53 81.37 43.76 3.30a
64.54 15.25 36.28 94.13 36.50 65.80 16.05 90.95 AO 4.41 78.60 41.20 3.30a 62.66 15.13 32.88 97.84 39.00 66.30 7.30 100.00 HLI 4.35 81.14 46.53 3.43b 60.99 15.41 37.26 95.90 48.14 69.10 11.70 100.00 HO 4.98 78.18 44.48 3.37ab 62.29 15.31 35.31 96.58 41.58 68.10 12.60 91.90 M. Rak szegi et al. / Data in Brief 7 (20 1 6 ) 1 6 17 – 1 632 1 623
Table 3(continued)
Breeding Genotype GS Yield TW TKW KW HI Protein Gluten GI Zeleny Wabs Stability QN
(t/ha) (kg/100 l) (g/1000) (mm) (%) (%) (ml) (%) (min)
CONV MV BERES ALI 5.34 80.50 47.16 3.38 44.57 16.50 42.33 66.33 30.00 67.70 5.40 71.40
AO 4.64 78.30 42.30 3.23 50.44 15.40 36.37 71.23 29.00 68.90 6.60 93.00
HLI 3.83 80.40 46.03 3.31 49.82 15.60 40.38 63.48 29.00 68.20 4.40 58.20
HO 5.14 77.80 46.58 3.33 46.83 16.30 40.02 66.69 30.00 69.80 1.90 0.00
CONV MV EMESE ALI 5.38 84.50 49.44 3.40 39.86 14.70 35.35 95.15 33.00 63.20 13.80 89.30
AO 4.83 82.70 46.84 3.30 45.41 14.20 32.22 95.79 33.00 64.70 9.90 100.00
HLI 4.70 84.50 47.70 3.36 44.20 14.00 34.08 93.19 34.00 64.40 13.90 86.90
HO 4.94 82.10 48.19 3.35 42.96 14.80 35.78 93.81 36.00 69.50 9.20 84.40
CONV MV KOLO ALI 5.64 81.60 42.75 3.25 50.14 15.00 36.21 94.85 38.00 63.30 8.70 82.10
AO 4.97 80.70 39.58 3.13 50.49 14.80 35.43 91.04 34.00 64.90 11.30 96.00
HLI 5.01 82.20 44.28 3.24 51.11 14.60 37.27 92.34 37.00 65.30 13.30 86.30
HO 5.33 79.00 40.57 3.13 53.75 14.70 36.73 94.70 40.00 67.60 8.30 90.10
CONV MV KOLOMPOS ALI 5.95 78.50 48.61 3.38 50.80 14.70 35.21 72.37 28.00 61.10 7.90 69.10
AO 4.83 77.50 43.16 3.23 52.53 14.00 32.93 63.35 27.00 59.60 9.00 73.40
HLI 5.27 79.50 46.24 3.30 53.15 13.40 33.89 67.72 27.00 60.30 6.50 66.90
HO 5.65 76.20 44.32 3.28 53.77 14.30 35.73 68.47 29.00 64.40 4.80 65.20
CONV MV TALLER ALI 6.40 82.70 44.46 3.28 53.04 13.60 32.73 83.78 29.00 65.00 11.10 69.90
AO 5.16 80.50 38.98 3.07 55.95 13.80 32.18 76.21 29.00 65.00 11.30 75.00
HLI 5.07 82.50 43.11 3.21 48.41 13.40 35.21 73.19 29.00 65.90 4.50 61.00
HO 5.75 80.40 42.16 3.22 53.57 13.30 32.46 87.19 29.00 69.20 6.00 73.70
CONV RENAN ALI 5.73 80.00 44.34 3.23 51.90 14.40 31.69 98.47 34.00 62.50 10.10 90.50
AO 4.79 79.00 42.43 3.13 53.35 14.20 30.02 98.28 31.00 60.80 14.50 100.00
HLI 5.02 81.70 48.17 3.29 53.99 14.00 33.81 97.23 33.00 62.90 15.20 92.50
HO 5.13 80.10 45.59 3.22 57.28 13.60 31.68 96.83 31.00 59.70 6.70 56.10
CONV SURETTA ALI 4.92 79.30 37.53 3.15 61.76 15.10 39.01 85.50 34.00 62.90 9.00 72.20
AO 4.76 78.90 36.85 3.13 59.87 14.70 37.20 75.62 32.00 63.10 17.00 83.90 HLI 4.78 80.40 39.20 3.19 64.08 13.90 36.46 87.23 31.00 65.20 9.40 77.60 HO 5.55 76.50 37.87 3.15 63.63 14.20 36.69 85.40 31.00 63.40 4.20 59.00 M. Rak szegi et al. / Data in Brief 7 (20 1 6 ) 1 6 17 – 1 632 16 2 4
CONV TITLIS ALI 5.33 81.90 42.23 3.30 50.75 14.70 37.18 92.71 38.00 62.50 11.50 74.40
AO 4.53 81.30 42.18 3.30 50.78 15.30 36.57 90.94 39.00 65.20 15.00 100.00
HLI 4.97 82.70 42.29 3.24 55.73 13.60 34.16 95.60 35.00 64.20 15.00 88.00
HO 5.31 79.70 41.80 3.25 57.24 14.90 37.79 94.89 40.00 64.50 14.30 83.90
BFOA BITOP ALI 5.94 84.70 33.60 3.43 57.53 14.50 37.61 96.86 35.00 65.60 12.00 86.50
AO 4.93 84.00 43.74 3.40 55.53 15.30 36.07 95.47 36.00 66.50 14.50 96.00
HLI 5.00 84.40 44.03 3.33 62.51 14.40 36.36 96.79 34.00 67.40 13.70 88.00
HO 5.18 83.40 43.44 3.32 63.26 13.60 34.22 96.41 32.00 64.30 13.00 76.70
BFOA BLASIUS ALI 6.00 82.00 37.97 3.23 59.44 15.00 37.39 96.95 44.00 63.10 10.30 82.60
AO 5.21 81.80 38.55 3.20 61.54 15.90 38.70 88.97 43.00 65.10 15.50 100.00
HLI 4.68 82.50 38.00 3.19 61.95 14.20 34.95 93.92 37.00 64.30 10.30 81.90
HO 5.33 79.20 37.44 3.17 63.97 14.60 38.03 94.44 40.00 60.90 5.20 53.60
BFOA HENDRIX ALI 5.82 76.60 36.07 3.18 61.43 13.60 29.15 98.68b
35.00 57.90 16.80 88.60 AO 4.79 77.40 36.09 3.10 59.74 12.60 30.25 94.97a 32.00 57.40 17.70 100.00 HLI 5.34 82.20 38.75 3.11 57.46 12.20 26.89 98.23b 33.00 59.80 17.70 94.00 HO 4.86 77.60 35.86 3.03 57.69 14.20 29.19 98.41b 35.00 61.60 13.30 81.00
BFOA PEPPINO ALI 6.25 83.10 38.37 3.23 60.05 14.90 35.85 98.22 39.00 62.50 10.50 88.90
AO 4.98 82.10 36.28 3.17 60.97 15.50 35.40 96.39 36.00 64.00 7.30 100.00
HLI 4.74 82.80 39.40 3.23 63.82 14.40 35.04 94.84 35.00 64.70 11.80 87.90
HO 5.05 80.20 36.95 3.13 64.38 14.10 33.95 96.72 35.00 61.00 11.30 74.40
BFOA PIRENEO ALI 6.16 84.00 43.52 3.38 59.46 15.10 37.36 97.65 33.00 62.00 9.80 86.60
AO 5.07 83.80 42.38 3.27 55.11 15.30 33.53 97.17 38.00 61.80 12.30 100.00
HLI 5.16 83.50 42.31 3.27 58.21 13.70 32.86 97.68 32.00 61.80 12.60 87.00
HO 5.47 82.00 40.58 3.18 63.08 14.70 36.18 97.68 37.00 60.30 14.40 81.50
BFOA SKERZZO ALI 6.07 80.60 38.36 3.10 49.58 14.50 36.08 98.25b 35.00 59.60 7.20 69.00
AO 5.01 80.40 38.61 3.10 46.91 14.10 33.75 89.27a 37.00 59.60 8.80 71.30
HLI 5.39 82.20 40.75 3.11 49.73 12.70 31.79 95.16ab
31.00 60.20 6.10 61.50
HO 5.21 79.90 36.50 2.98 54.35 13.60 33.48 94.89ab
34.00 57.50 6.30 54.20
BFOA STEFANUS ALI 6.08 86.00 42.35 3.30 58.26 14.70 36.73 98.03 36.00 64.50 13.50 93.60
AO 4.95 84.40 39.67 3.13 53.65 15.40 36.03 94.00 37.00 65.50 13.40 91.90 HLI 5.12 85.40 42.29 3.21 60.29 13.60 33.06 96.92 32.00 64.40 15.40 92.50 HO 5.62 84.00 40.02 3.13 62.92 13.70 32.12 94.89 33.00 63.10 11.10 74.00 M. Rak szegi et al. / Data in Brief 7 (20 1 6 ) 1 6 17 – 1 632 1 625
Table 3(continued)
Breeding Genotype GS Yield TW TKW KW HI Protein Gluten GI Zeleny Wabs Stability QN
(t/ha) (kg/100 l) (g/1000) (mm) (%) (%) (ml) (%) (min)
BFOA TOBIAS ALI 6.02b
83.50 40.58 3.20 55.85 15.90 40.04 93.62 37.00 63.60 8.70 83.00 AO 4.71ab 83.00 39.85 3.17 54.49 16.40 39.73 85.81 37.00 64.30 10.20 93.00 HLI 3.53a 83.20 41.11 3.23 60.12 15.20 39.60 90.05 33.00 63.90 13.70 96.00 HO 4.94ab 83.20 41.53 3.20 59.47 14.90 37.58 92.47 33.00 59.10 4.20 45.60
Grand total Yield TW TKW KW HI Protein Gluten GI Zeleny Wabs Stability QN
Mean 5.09 81.00 41.19 3.23 56.43 14.40 35.39 89.91 35.00 62.80 10.60 79.50
N 1332 737 736 737 699 734 734 734 734 219 219 219
Std. dev 1.61 6.30 5.03 0.15 8.74 2.70 7.34 13.35 8.00 3.40 4.50 17.70
GS Yield TW TKW KW HI Protein Gluten GI Zeleny Wabs Stability QN
Mean of sites ALI 5.72c 81.99b 41.34b 3.26b 53.46a 15.25a 37.19a 90.78c 35.57ab 62.14a 10.69ab 79.83b
AO 4.73a 79.68ab 40.16ab 3.21a 50.92a 16.33bc 37.57a 85.98ab 37.64b 63.25b 11.61ab 90.69c HLI 4.77a 81.80b 37.97a 3.25b 58.35b 17.10c 42.11b 87.65b 42.19c 87.64c 12.09b 87.18bc HO 5.15b 77.40a 38.99ab 3.19a 57.24b 15.64ab 37.18a 85.29a 34.03a 62.59ab 9.07a 67.50a
Homogeneous subset indicators (a–d) based on Tukey's post hoc test at thep¼0.05 significance level are also shown separately for each trait.
Values with no letter in the mean columns indicate, that sites do not significantly different (po0.05) from each other. Significant differences are marked with different letters.
M. Rak szegi et al. / Data in Brief 7 (20 1 6 ) 1 6 17 – 1 632 1 626
Table 4
Mean values and standard deviations (SD) of the physical, grain compositional and breadmaking quality traits (low input and organic sites in Austria and Hungary, 2011–2013) assessed for 37 winter wheat varieties with three different breeding origins.
Instruments Traits LI O
TOTAL CONV BFOA ORG TOTAL CONV BFOA ORG Mean SD Mean SD Mean SD Mean SD Mean SD Mean SD Mean SD Mean SD FOSS Tecator 1241 Test weight (kg/hl) 81.22*** 7.62 81.60 3.15 82.98 3.20 83.12 2.38 78.95*** 10.22 79.30 3.82 81.55 3.37 77.71 15.70
Protein content (%) 14.86 2.65 14.95 2.39 14.85 2.37 15.49 2.52 15.33 2.43 15.24 2.16 15.14 2.01 16.04 2.42 Starch content (%) 56.91** 5.34 57.34 2.15 57.41 2.49 57.33 2.57 56.42** 4.70 56.81 1.91 56.75 2.14 56.59 2.35
Gluten content (%) 34.74 6.71 34.90 6.14 34.89 6.48 37.36 6.37 36.11 5.75 35.59 5.02 35.95 5.20 38.21 5.43 Water absorption (%) 68.55 10.20 68.84 8.77 70.00 8.98 71.41 9.64 68.17 8.74 67.83 7.16 68.76 7.55 69.96 7.66 Zeleny sedimentation (ml) 49.44 13.95 49.60 13.59 50.93 14.44 54.99 12.00 52.48 12.84 51.09 12.80 52.26 12.09 56.84 11.46 Perten Falling Number
system 1500
Falling number (s) 386.99 88.26 389.09 84.01 389.77 73.81 396.23 83.00 374.16 120.68 369.80 119.98 383.99 114.88 381.60 124.11 Kjeltec 1035 Analyzer Protein wholemeal (%) 14.07 3.00 14.15 2.80 14.13 2.81 14.65 2.94 14.59 2.71 14.48 2.48 14.48 2.45 15.24 2.75 Chopin CD1 Flour yield (%) 51.27 5.64 51.56 3.71 51.37 3.68 54.27 4.55 52.51 5.36 52.48 3.40 52.15 3.25 54.13 4.69 Glutomatic 2200 Gluten content (%) 34.43 8.03 34.50 7.64 34.63 7.61 37.65 8.17 35.33 7.01 34.47 6.16 34.77 5.71 38.50 7.66 Gluten spread (mm) 4.69 2.90 4.67 2.98 4.30 2.13 6.94 5.09 5.12 3.47 4.64 3.03 4.28 2.01 7.04 4.65 Gluten Index 91.19*** 12.91 91.39 11.07 96.17 4.06 83.04 19.08 88.90*** 14.64 90.72 11.48 94.74 4.83 81.55 18.10
SediCom System Zeleny sedimentation (ml) 34.01 8.78 34.35 8.62 34.55 8.16 34.78 9.45 35.03 7.09 34.74 6.56 35.66 5.68 35.86 8.02 Marvin System Thousand-kernel weight (g) 42.18*** 5.84 42.70 5.01 40.09 6.08 41.45 5.15 40.18*** 5.23 40.86 4.55 39.20 4.13 40.42 4.36
kernel size % (o2.50 mm) 1.96 1.85 1.83 1.84 2.51 1.94 1.83 2.00 2.94 2.85 2.82 2.56 3.65 3.43 2.55 2.92 % (2.50–2.75 mm) 6.67 4.49 6.41 4.49 7.98 5.39 7.10 5.56 8.97 5.77 8.61 5.29 10.56 6.43 8.42 6.11 % (2.75–3.00 mm) 15.54 7.45 15.19 7.44 16.92 8.10 16.37 8.22 18.14 7.00 17.65 6.91 19.75 7.21 18.09 6.85 % (3.00–3.25 mm) 24.75 6.48 24.37 6.27 26.13 6.15 25.67 5.92 25.90 5.09 25.70 4.76 25.89 4.65 26.89 5.18 % (3.25–3.50 mm) 24.62 5.72 25.05 5.38 23.55 6.17 24.90 6.06 22.76 5.90 23.18 5.55 21.77 6.41 23.13 5.67 % (3.50–3.75 mm) 16.78 7.64 17.35 7.62 15.45 8.33 15.71 8.23 14.03 6.83 14.53 6.47 13.03 7.52 13.99 7.05 % (3.75–4.00 mm) 7.03 5.02 7.44 5.10 5.82 5.26 6.81 5.57 5.42 4.13 5.79 4.21 4.42 3.78 5.50 4.24 % (4.00–4.25 mm) 1.84 2.04 1.97 2.12 1.37 1.63 1.34 1.61 1.23 1.41 1.44 1.55 0.76 0.90 1.18 1.37 % (4.25–4.50 mm) 0.30 0.57 0.34 0.60 0.23 0.54 0.26 0.49 0.20 0.37 0.23 0.41 0.13 0.27 0.18 0.33 % (44.74) 0.05 0.17 0.05 0.18 0.04 0.12 0.00 0.04 0.03 0.10 0.03 0.10 0.03 0.10 0.03 0.10 Kernel width (mm) 3.24*** 0.31 3.27 0.15 3.23 0.16 3.24 0.16 3.18*** 0.28 3.22 0.14 3.16 0.15 3.21 0.15 Kernel length (mm) 6.50 0.63 6.55 0.31 6.38 0.20 6.37 0.26 6.44 0.56 6.57 0.32 6.37 0.18 6.37 0.27 Perten SKCS 4100 Thousand kernel weight (g) 41.08 5.57 41.66 4.48 39.45 3.91 40.71 4.82 39.24 4.74 39.84 3.87 38.56 3.51 39.36 4.10 Kernel diameter (mm) 2.61 0.28 2.64 0.16 2.55 0.14 2.61 0.17 2.55 0.24 2.58 0.15 2.51 0.14 2.58 0.17 Hardness index 54.96 9.51 55.32 8.72 58.62 7.04 55.24 9.68 56.61 9.48 56.51 8.36 59.42 7.00 55.53 10.46 Brabender Farinograph Water absorption (%) 61.73 9.22 63.09 2.98 62.77 2.70 61.62 3.89 61.51 10.18 63.37 3.62 62.00 2.81 63.30 4.58 Dough development time (min) 9.16* 5.28 9.04 5.42 11.64 5.21 7.86 4.97 10.01* 5.92 10.35 6.42 10.33 5.90 9.38 5.57
Dough stability (min) 10.31*** 4.37 10.42 4.44 11.80 3.72 10.81 5.13 10.12*** 4.62 10.00 4.65 11.16 3.89 10.06 5.36
Dough softening at 10 min (FU) 194.05* 219.25 184.74 221.62 254.74 240.91 126.67 192.31 235.54* 221.60 251.95 231.46 236.88 231.06 197.39 224.09
Farinograph quality number 85.54*** 20.37 88.44 14.35 94.63 10.28 84.19 12.93 77.43*** 22.49 79.47 23.09 80.83 18.00 75.91 19.40 LI: low input, O: organic, TOTAL: including all varieties, CONV: conventionally bred varieties, BFOA: varieties developed by combined breeding, ORG: organically bred varieties.
*
Significant differences at the 0.05 probability levels, respectively.
**Significant differences at the 0.01 probability levels, respectively. ***Significant differences at the 0.001 probability levels, respectively.
M. Rak szegi et al. / Data in Brief 7 (20 1 6 ) 1 6 17 – 1 632 16 2 7
Table 5
Most stable varieties at organic (O) and low input (LI) sites, with above-average mean values for the trait but the lowest coefficient of variation (mean;CV). The varieties were developed by the following breeding methods: CONV: conventional, ORG: organic, BFOA: combination of methods. CV values in brackets.
Management LI O LI O LI O
Traits ORG ORG BFOA BFOA CONV CONV
Yield (t/ha) Sandomir (5.0;28.9) Gulliver (4.9;18.9) Bitop (5.5;31.6) Skerzzo (5.1;21.1) Capo (5.5;31.9) Mv Kolo (5.2;21.1) Test weight (kg/hl) Scaro (84.1;2.5) Scaro (81.6;3.1) Stefanus (85.6;2.5) Stefanus (84.1;2.5) Mv Emese (84.5;2.5) Capo (82.8;2.7) Thousand kernel weight (g) Donnato (45.6;8.4) Scaro (40.6;4.5) Stefanus (42.3;8.3) Bitop (43.5;5.6) Mv Taller (43.6;6.8) Mv Emese (47.7;4.7) Kernel width (mm) Donnato (3.4;3.9) Scaro (3.2;1.4) Stefanus (3.2;3.6) Bitop (3.3;3.0) Mv Beres (3.34;3.6) Montdor (3.3;1.6) Flour yield (%) Karachow (58.7;1.9) Karachow (58.5;2.2) Skerzzo (54.1;2.6) Skerzzo (54.7;2.7) Lukullus (55.6;2.8) Flamenco (54.0;3.2) Falling number (s) Aszita (397.8;10.6) Wiwa (420.9;14.7) Hendrix
(377.1;9.9) Stefanus (432.0;16.2) Mv Kolompos (439.9;12.2) CH111-14426 (409.9;20) Protein wm (%) Karachow (16.5;13.9)
Gulliver (15.5;14.0) Bitop (14.4;14.9) Pireneo (14.9;15.5) Mv Emese (14.3;15.5) Lorenzo (15.9;14.7)
Gluten (%) Karachow (48.8;9.9) Karachow
(48.7;11.9)
Bitop (36.8;16.6) Tobias (38.3;15.9) Mv Emese (34.5;15.9) Lorenzo (39.1;11.5) Gluten index Donnato (96.1;2.4) Donnato (94.6;3.9) Hendrix (98.4;1.2) Pireneo (97.5;1.8) Lukullus (98.1;0.9) Folklor (97.7;1.1) Zeleny sedimentation (ml) Jularo (35.1;18.6) Wiwa (42.2;13.5) Bitop (34.7;16.9) Pireneo (37.2;9.0) Lorenzo (47.3;17.8) Lorenzo (47.8;9.2) Water absorption (%) Sandomir (62.7;1.1) Butaro (72.2;0.9) Bitop (66.5;1.7) Bitop (65.4;2.4) Mv Beres (67.9;1.5) CH111-14426
(63.5;0.5) Dough stability (min) Butaro (13.6;8.5) Wiwa (16.7;0.4) Hendrix (17.2;8.9) Bitop (13.7;7.7) Lorenzo (10.1;10.7) Lorenzo (15.4;0.9) Dough softening (FU) Karachow
(58.2;39.8) Aszita (28.0;55.6) Skerzzo (45.3;37.3) Skerzzo (49.0;66.4) Mv Kolompos (32.5;56.2) Mv Taller (22.0;12.8)
In the case of dough softening, the lowest mean values were taken into consideration. Wm: wholemeal.
M. Rak szegi et al. / Data in Brief 7 (20 1 6 ) 1 6 17 – 1 632 1 628
Detailed information on the origin and agronomical properties of the varieties were published by
Mikó et al.
[4]
.
2.2. Plant growing conditions
Between 2011 and 2013, 37 bread wheat varieties were sown in Austria (A) and Hungary (H) using
a similar randomised complete block experimental design with 3 replicated blocks under organic
(O) and low input (LI) growing conditions. In both countries the O and LI sites were located on
neighboring
fi
elds and the experiments were planted close to each other (
o
1080 m) to minimize the
confounding effects of differences in soil and climatic conditions. Low-input systems could be
Fig. 1.Stability and mean performance of the genotypes using the ranking plot of the GGE biplot for the traits: (a) thousand-kernel weight: TKW; (b) thousand-kernel width; (c) hardness index: HI; (d) protein content; (e) gluten content; (f) gluten index: GI; (g) Farinograph quality number: QN; (h) dough stability: stability; and (i) Zeleny sedimentation.
characterized by a reduced level of mineral fertilizer, green manure, tillage and seed chemical
treatment compared to high-input conventional farming systems. Furthermore, herbicides,
insecti-cides and arti
fi
cial fertilizers were used in the low input
fi
elds when necessary, but no fungicides.
There was a serious
Tilletia caries
contamination in 2013 at organic sites in both countries, so fewer
varieties and fewer quality parameters could be measured. In the low input
fi
elds, nitrogen was
supplied using mineral fertilizers according to local practice, while only previous crops (mainly
legumes) provided nutrient supplies at the organic locations (
Table 1
). Weed pressure was very low at
the organic sites in both countries in all the years. The weather conditions differed greatly not only
between the years but also between the countries. After the moderately dry
fi
rst season of 2010/2011,
the year 2012 saw an extreme drought, which was followed by an average season in 2013. In most
cases, the Hungarian locations received less precipitation and were warmer than the Austrian ones.
2.3. Assessment of quality traits
2.3.1. Physical properties
The test weight (kg/100 l) of the grain was measured using a Foss Tecator 1241 instrument (MSZ
6367/4-86). Thousand-kernel weight (TKW) was determined with the Marvin System according to
the standard method MSZ 6367/4-86 (1986). A Perten SKCS 4100 instrument was used to measure the
hardness of the kernels (AACC Method 55-31).
2.3.2. Milling
Grain sample weighing 700 g from each of the 3
fi
eld replications were milled separately to
fl
our
using a Chopin CD1 Laboratory Mill after conditioning the grain to 15.5% moisture content.
Whole-meal samples were produced from the same samples with a Perten 3100 Laboratory Mill.
2.3.3. Grain composition
Crude protein content was analysed in duplicate with the Kjeldahl method, which is consistent
with ICC method 105/2, using the Kjeltec 1035 Analyzer. Gluten content and gluten index (GI) were
determined using a Glutomatic 2200 instrument (ICC 137/1, 155), and gluten spread according to the
Hungarian standard MSZ 6369/5-87 (1987). This parameter provides information about the
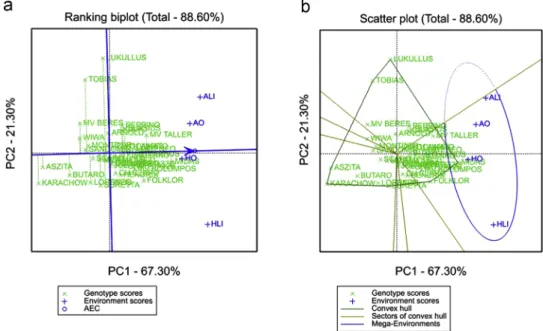
Fig. 2.Ranking plot (a) and‘which-won-where’and (b) view of the GGE biplot for grain yield. M. Rakszegi et al. / Data in Brief 7 (2016) 1617–1632
proteolytic activity of the samples by monitoring changes in the diameter of a gluten ball after 1 hour
at room temperature. The starch content of the grain was measured with a Foss Tecator 1241
instrument. Basic grain compositional parameters were also estimated with the Near Infrared
Spec-troscopy (NIR) method (ICC 202 and ICC 159) using Foss Tecator 1241 and Perten Inframatic 8611
instruments for grain and
fl
our, respectively.
2.3.4. Breadmaking quality characters
A Brabender Farinograph (ICC 115/1) was used to determine
fl
our water absorption, development
time, stability and dough softening. The Zeleny sedimentation test was carried out according to
standard ICC 116/1 and the falling number was measured with a Perten Falling Number System 1500
(AACC56-81B).
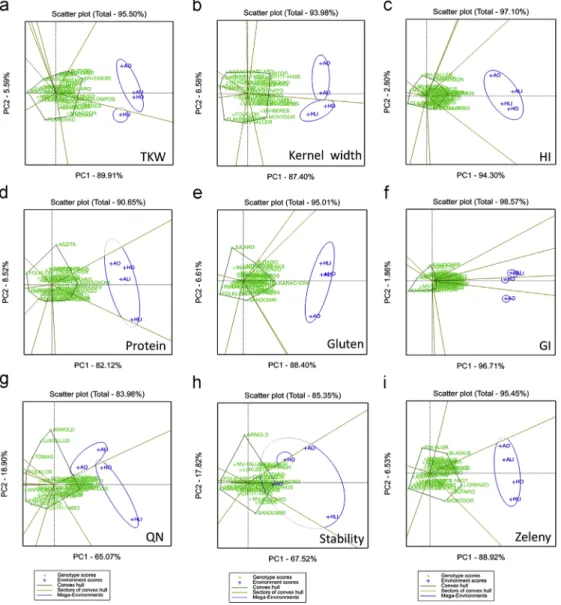
Fig. 3.The‘which-won-where’view of the GGE biplot to show which genotype performed best in which environments ((a) thousand kernel weight: TKW; (b) kernel width; (c) hardness index: HI; (d) protein content; (e) gluten content; (f) gluten index: GI; (g) Farinograph quality number: QN; (h) dough stability: stability; and (i) Zeleny sedimentation).
These datas were evaluated in
Tables 2
–
5
and
Figs. 1
–
3
.
2.4. Statistical analysis
Repeatability (broad-sense heritability) was calculated as the ratio of genotypic to phenotypic
variance (
Table 2
) as described by Rakszegi et al.
[1]
.
One-way ANOVA and Tukey's post hoc test were carried out using SPSS 16.0 software (SPSS Inc.,
Chicago, IL, USA) (
Tables 3
and
4
).
The coef
fi
cient of variation (CV), expressed as the ratio of the standard deviation and the mean, is a
measure of the data variability. Low values of CV mean that the data has less variability and high
stability (
Table 5
).
GGE biplot analysis was carried out using GenStat 17.0 software (VSN International Ltd., Hemel
Hempstead, UK)
[5]
. The GGE biplot illustrates the genotype plus genotype-by-environment variation
using scores from principal component analysis, but without environmental effects. The Ranking
biplot (average-environment coordination (AEC) view of the GGE biplot) can be used to examine the
performance of all genotypes within a speci
fi
c environment. In the plot, the best performing and most
stable genotypes are those whose projections onto the biplot axis are closest to the environment. The
single arrow on the AEC abscissa points to higher mean values of a given trait. The distance from the
AEC ordinate indicates greater variability (poorer stability) in both directions. The
“
which-won-where
”
function of the GGE biplot is an extended use of the
‘
pair-wise comparison
’
function and
shows which genotype performed the best in which environment. Genotypes located on the vertices
of the polygon performed either the best or the poorest in one or more environments present in the
same sector (
Figs. 1
–
3
).
Acknowledgments
This research received funding from the Seventh Framework Program of the European Community
(FP7/2007-2013) under the Grant agreement no. 245058-SOLIBAM and from the Supplementary
Hungarian Project EU_BONUS_12-1-2012-0032.
Appendix A. Supplementary material
Supplementary data associated with this article can be found in the online version at
http://dx.doi.
org/10.1016/j.dib.2016.04.065
.
References
[1]M. Rakszegi, P. Mikó, F. Löschenberger, J. Hiltbrunner, R. Aebi, S. Knapp, K. Bede, M. Megyeri, G. Kovács, M. Molnár-Láng, G. Vida, L. Láng, Z. Bedő, Comparison of quality parameters of wheat varieties with different breeding origin under organic and low-input conventional conditions, J. Cereal Sci. 69 (2016) 297–305.
[2]E.T. Lammerts van Bueren, S.S. Jones, L. Tamm, K.M. Murphy, J.R. Myers, C. Leifert, M.M. Messmer, The need to breed crop varieties suitable for organic farming, using wheat, tomato and broccoli as examples: a review, NJAS–Wagening. J. Life Sci. 58 (2011) 193–205.
[3]F. Löschenberger, A. Fleck, H. Grausgruber, H. Hetzendorfer, G. Hof, J. Lafferty, M. Marn, A. Neumayer, G. Pfaffinger, J. Birschitzky, Breeding for organic agriculture: the example of winter wheat in Austria, Euphytica 163 (2008) 469–480. [4]P. Mikó, F. Löschenberger, J. Hiltbrunner, R. Aebi, M. Megyeri, G. Kovács, M. Molnár-Láng, G. Vida, M. Rakszegi, Comparison
of bead wheat varieties with different breeding origin in different management systems, Euphytica 199 (2014) 69–80. [5]W. Yan, N.A. Tinker, Biplot analysis of multi-environment trial data: principles and applications, Can. J. Plant Sci. 86 (2006)
623–645.
M. Rakszegi et al. / Data in Brief 7 (2016) 1617–1632 1632