VULNERABILITY ASSESSMENT OF A STRATEGIC
RURAL ROAD NETWORK USING A PROTOTYPE
METHOD
Vaughn Scott, Auckland Transport, New Zealand
Roger Dunn, University of Auckland, New Zealand
ABSTRACT
This paper presents a prototype method to assess the vulnerability of a strategic rural road network. In this context, a strategic rural road is one which enables vehicle movements of goods between transport centres. These goods movements provide a major and sometimes a vital part of the transport industry supply chain. When a strategic road is closed, as the result of an incident or an event such as a washout or rock fall, then these traffic movements are subject to delay, thereby compromising the supply of goods and the goals of businesses.
Previous methods of evaluating the threats on a transport network have focused on reliability measures involving risk and probability models; vulnerability is a different kind of measure which identifies critical components of a network. The proposed method uses rating formulae to determine the vulnerability of a link within a strategic road network; by considering the potential for a road closure on a link and the consequence this has on the performance of travel between transport centres. In simple terms, the method assesses the weakness of the link to closure and determines an exposure rating, plus it determines the consequences of the closure and determines a diversion rating for the alternative route. The combination of the weakness with consequences determines the link’s vulnerability.
The method could be used as a prototype for considering other similar road networks; furthermore, it could be adapted for other types of transport networks. It is low cost, since it avoids the detailed analysis of risk assessment modelling. A case study of the lower North Island in NZ is presented to demonstrate the practical application showing that the prototype method is a useful tool helping decision makers visualise the vulnerability of the road transport network..
INTRODUCTION AND BACKGROUND
There are certain land transport links which are crucial to the economy of the country. These are the strategic links between cities, feeding land based industries from the length and breadth of the country. Export goods from agriculture and other industries begin their journeys along these routes and then progress towards a major city centre or a port. The success of these journeys is crucial to the supply chain which is an integral part of business and economic prosperity; therefore, the closure of a strategic link presents a vulnerability to national prosperity. Network vulnerability as it relates to transportation, can be defined as: “a susceptibility to
‘incidents’ that can result in considerable reductions in ‘serviceability’” (Berdica 2002). An ‘incident’ is an event that causes an adverse consequence to the network; ‘serviceability’ is the reliability of the network to maintain a certain level of performance.
There are a number of events that may block or close a road leaving the network vulnerable; these events are mostly unexpected and can include road crashes, rock falls and slip outs in mountainous terrain, ice and snow in alpine regions or flooding and washouts in low lying areas. Security of access can be described as the safe guarding of strategic links from unexpected events. This can be achieved by either increasing the standard of the strategic link or by providing an alternative route, of a suitable standard for commercial vehicles, within the transport network.
An assessment of unexpected events would then be a logical place to start in addressing the vulnerability of a road network; an analysis of risk is a standard approach using a ‘risk
management process’ (Standards NZ 2009). Nicholson and Dalziel (2002) implemented a risk assessment method to assess the reliability of the central north island (New Zealand) network. Their focus was on the Desert Road section of SH1 near Mount Ruapehu which is a strategic road subject to frequent ice/snow road closures but also the rare event of a volcanic eruption. Using a traditional traffic model, comparisons were made by converting the probabilities and the duration of road closures into a distribution of expected costs. The results concluded that the lower cost but more frequent event of ice and snow were more costly than the infrequent event of an eruption. This suggests that the best return on risk evaluation and management is more aligned with a broad based approach, focused on the reliability of a road network subjected to small scale but more frequent events.
There are three reliability concepts relating to a road network, that of connectivity, travel time, and capacity (Berdica 2002). This leads to the evaluation of probabilities and costs related to risk assessment which results in a detailed and costly analysis. To exemplify the scale of analysis, consider a ‘risk assessment framework’ for the New Zealand State Highway network as suggested by Seville and Metcalfe (2005). This involves a series of software modules including hazard-scape, network vulnerability and socio-economic impacts which are embedded into a Geographic Information System (GIS). The system would simulate an event, triggering a series of road closures, and then model the consequential traffic response; this requires a national traffic model which is something that New Zealand does not yet have (Bollard and Jones 2010). Provided that a suitable traffic model could be developed, Seville and Metcalfe (2005) further suggest a ‘walkthrough’ scenario would need to be developed that accounts for the distribution of uncertainty. A walkthrough scenario is a time series method described by Taylor et al (2001) where a number of random events are produced over a given time period which in turn is cycled over a number of exposure times within a walkthrough duration; the result, is a distribution of scenarios.
To implement such a ‘risk assessment framework’ as outlined above, would require a significant undertaking involving considerable investment in methodological models. Not only does it require a series of expert systems which are linked to a GIS but a national traffic model (not yet developed in New Zealand) and a simulation model to account for uncertainty. This strongly suggests a broad based approach would be more appropriate, one that eliminates the need for the detailed assessment of risk.
Vulnerability is considered by Taylor and D’Este (2007) to be closely related to weaknesses and the consequence of failure; therefore, vulnerability is strongly related to connectivity regardless of the probabilities of failure; however, Berdica (2002) regards network vulnerability can be considered more than just a measure of consequences but a comprehensive framework for analysis. The framework outlined and developed here examines each link for the susceptibility to ‘incidents’ and the resulting ‘serviceability’ of the network.
By using a different framework for analysis, such as vulnerability, the assessment of road closures on a network can be achieved without considerable effort and therefore at minimal cost. Hence, the focus of this research was to develop such a broad based approach to assess road closures to a strategic road network.
Objective
The aim of this research was to develop a cost effective method to assess the vulnerability of strategic rural road links for a selected network.
DEVELOPING A METHOD TO RATE VULNERABILITY
An assessment of vulnerability begins by examining the context of the system. There are different types of transport networks, some with contrasting purposes; therefore, a case study was chosen so as to develop and evaluate a practical method. A major part of the central North Island rural road network was selected, the context of which is as follows:
• Strategic, as it supports the economy by significant freight movements between major centres.
• Includes a wide range of topographic features typical of land based transport.
Addressing the context of the system is a start to developing a prototype method. A goal of this transport system is to encourage economic growth by providing reliable transport for business; therefore, an understanding of business processes is within the context of this transport system. In the quest for efficiency and quality, businesses are changing their production systems. One such approach is ‘the theory of constraints’ (Goldratt 1988) and is considered a production management approach to running an organisation. A key part of Goldratt’s (1988) approach is to identify constraints in the production system which includes the supply chain. Transportation is an integral part of this supply chain in getting products and produce from business and industry centres to the market. A major component of the New Zealand transport system is the rural road network, particularly the State Highway network.
New Zealand is isolated by ocean and there are few gateways to the world market. Export produce from either farm or factory must make its way to an export centre such as a port. The key modes of transport to an export centre is by road, coastal shipping or rail. Over the past 50 years, in the development of the New Zealand economy, investment into the State Highway roading network has surpassed all other modes of transport. This investment continues, making road transport the key driver for inter-regional produce movements.
The topography of New Zealand is diverse and ranges from a coastal to an alpine environment; encompassing flat, rolling and mountainous terrain. This diversity leads the network vulnerable to road closures; these can range in duration from a few hours for a road crash to many days for a rock fall or a slip out. An example of a significant road closure was within the Manawatu Gorge (a State Highway east of Palmerston North city) which was closed for 13 months due to a major landslide. It was reported (McKay 2012) that $21 million was spent to reinstate the road. This includes $5.4 million on maintaining the alternative route which was not originally designed to carry the volumes of diverted traffic. This suggests that a key to understanding the
vulnerability of the transport supply chain involves not only an assessment of possible road closures but also the changes to travel along alternative routes due to the cutting of strategic roads.
Strategic roads are those that make a significant contribution to the economies connecting major population centres or international ports (NZ Transport Agency 2011). The strategic link can therefore be identified as a national or regional strategic road. Surrounding these links are a network of connectors, distributors as well as other local roads; these form a basis for alternative routes. Not all alternative routes can be considered viable due to contrasting road standards; the inability to carry additional volumes of traffic or increased vehicle axle weights. Having considered the context of the transport system, the next step in developing a method is the formation of a framework that forms the basis for analysis. Vulnerability considers the weakness of the network and the consequence should a link in the network fail. Instead of focusing on detailed costs and risk assessments of unexpected events, a rating method is proposed. This method poses the following two questions in which to rate each link:
1. How many hazards are present along each strategic link relative to every other link in the network?
2. If the link should fail, for any reason, then how will the network cope with the additional traffic that will be diverted?
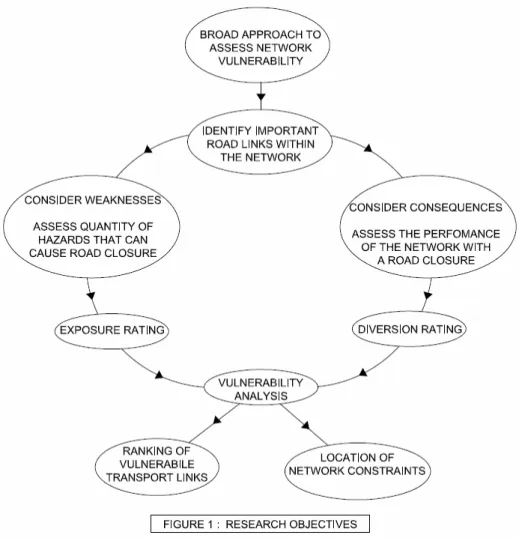
This leads to a method as outlined in Figure 1 comprising two corresponding rating factors: 1. An exposure rating, representing the number of hazards present along a strategic link. 2. A diversion rating, representing the performance measure of the network when
Figure 1: Research objectives.
The combination of an exposure rating with a diversion rating gives an overall vulnerability rating for each strategic link; the most vulnerable links in the network can then be illustrated by a ranking of strategic roads. With careful segmentation of each strategic link and associated detour, further analysis to locate specific road sections that are constraints to the transport system is possible.
METHODOLOGY FOR RATING ROAD VULNERABILITY
The prototype method to rate vulnerability has been developed using a case study of the strategic rural road network of the central north island of New Zealand. The following steps summarize the process:Step 1: defining the network
This first stage is to define the network where origins, destinations, and the primary paths are identified. Origins and destinations are the major cities or produce centres with processing facilities or export ports and these form the major nodes of the network. The primary paths are then the shortest and least cost path between the major nodes; these are readily identified from a road hierarchy map which illustrates the networks strategic roads.
For the case study, such a map is detailed in the ‘State Highway Asset Management Plan (SHAMP)’ (NZ Transport Agency 2011). This is the road controlling authorities ‘business plan’ providing guidance on the operation of the network.
According to SHAMP (NZ Transport Agency 2011), strategic roads are classified as roads that make a significant contribution to national or regional economies; as such, they are built to a high standard capable of servicing heavy traffic. All other roads form a basis for alternative routes; however, not all roads are suitable for carrying heavy traffic.
Step 2: define the strategic links within the network
Strategic links are identified by an iterative process:• first a link within the primary path is associated with a detour
• then the detour is assessed to be suitable or not
• if the detour is not suitable, then a longer link is chosen.
Fundamental to the selection of links, is the determination of an appropriate detour and this can be achieved by either inspection of the detour or local knowledge of the network. Intermediate nodes are then introduced where the detours intersect with the primary path. The result is set of well-defined links, each associated with an alternative route.
Step 3: segment strategic links and detours
Once the network has been defined, with strategic links and associated detours, the next stage is to segment, or to categorise, each link and detour into common parts. Segmentation of the link and detours is useful when determining where the weaknesses and constraints are located within the network. It is proposed that consistency models are useful in vulnerability analysis; three road consistency models are proposed which have been adapted from road safety and highway design (Gibreel et al 1999):
• Efficiency: relating to speed and level of service.
• Environment: relating to the physical characteristics of the road and surrounding land.
• Driving Demand: relating to the performance of the road user. This can be determined by either the complexity placed upon the driver (including the demands for decision making while driving a route), the stimulation which the environment provides or the potential for driver fatigue.
Breaking the link into smaller road sections based on one of these models (efficiency,
environment or the diving demand) divides the entire network into common parts – which model to use is dependent on the context of the transport system and the availability of road attribute information.
Step 4: data collection and determining vulnerability
Having established the network in terms of its characteristics, data is collected and is used to determine the attributes for the rating formulae. The heart of the method is the vulnerability rating:
Vulnerability Rating = (Exposure Rating) × (Diversion Rating) (1) This consists of two separate rating formulae; an ‘exposure rating’ to quantify the hazards over each strategic link; a ‘diversion rating’ to assess the performance of the detour.
The ‘exposure rating’ is a qualitative assessment of linear and non-linear hazards for each road section which are combined using the following formula:
Exposure Rating = � 𝑚 𝑚=1 �� �𝐻𝐿𝑋 �∙ 𝑃𝑅 𝑖 𝑖=1 + 𝐶𝐶 ∙ 𝑃𝑅� (2) Where:
𝑚 = number of road sections within the link i = the number of hazards within a road section
𝐻𝐿= length of the hazard as it is measured along the road section 𝑃𝑅= risk profile factor
𝐶𝐶= a weighted crash rate for the road section based on historical records
A key part of the exposure formula is the ‘risk profile factor’ (𝑃𝑅). This represents the
classification of hazard sites; for example, an over slip, under slip, bridge failure, ice or snow are all hazard sites that can potentially close a road, each has a unique risk profile. A catalogue of risk profiles for hazard sites is then developed. All hazards along a road section are identified and an attribute of the hazard is recorded; for example, the linear length of the hazard as it is measured along the road. Each such attribute is then multiplied by a scaling factor (defined by the catalogue of risk profiles) to produce a ‘relative length’ of the hazard and this can be used for comparisons between hazard categories:
The ‘diversion rating’ assesses the performance of the alternative route. Performance factorsfor only the preferred detour are considered in the rating formula and these include:
• the length of the detour compared with the preferred route
• a crash rating (increasing the traffic will invariably increase the exposure rate of a traffic incident)
• a rating on the pavement for a section of road (increased axle weights bearing onto the pavement reduces the life expectancy of the structure of the road)
• a level of service factor expressed as a ratio of the demand flow and the capacity; based on the Highway Capacity Manual (US Transportation Research Board 2000) and adapted for an area wide network (US Federal Highway Administration 2005).
These performance factors are combined into the following formula: Diversion Rating = 𝐿𝑛 ∙ �𝑃 𝑛 n=1 𝐶 ∙ 𝑀 𝑃 (3 ) Where:
𝑛 = number of road sections within the link
𝐿𝑃= the proportional length of the detour 𝐶= crash rating of the detour
𝑀= level of service factor
𝑃= a pavement or infrastructure rating of the detour.
APPLICATION OF THE METHOD
As noted earlier, to develop and apply the method, a case study of an inter-regional rural road network in the central North Island of New Zealand was selected. This particular road network is embedded in a diverse topography ranging from flat low lying coastal areas through to mountainous alpine regions. The corresponding environment exhibits a range of hazard events that can close a strategic road link. For example, extreme flooding and slips resulted from the storm event of October 2013 closing extensive parts of the state highway road network in the Taranaki region (McMurry 2013). Alpine hazards are also evident as with the regular winter closing of the Desert Road section of state highway near Mount Ruapehu due to heavy snowfalls of up to a metre deep (NZ Transport Agency 2013).
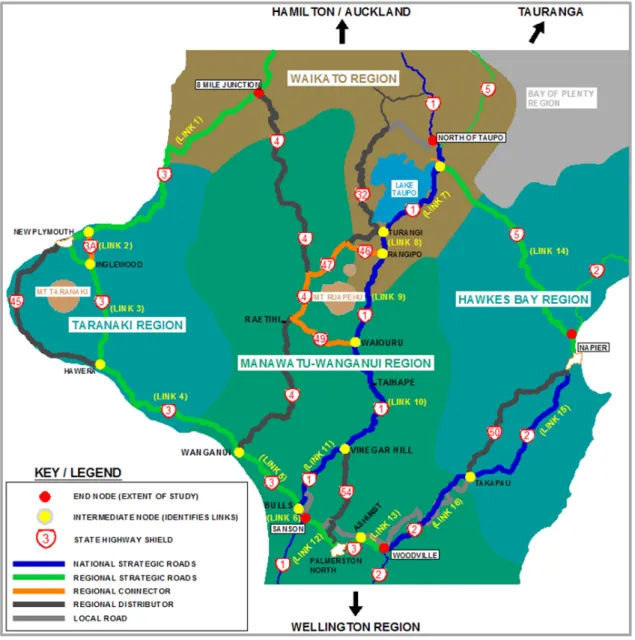
Figure 2 illustrates the extent of the study area; the strategic routes that carry the majority of produce are identified as national or regional strategic roads (NZ Transport Agency 2011). The rest of the network consists of alternative state highways (regional connectors or distributors) and local roads which are suitable for commercial traffic; all other roads are not shown as they are unsuitable routes for the volume and composition of inter-regional traffic. This network covers the regions of Taranaki; Manawatu-Wanganui; Hawkes Bay and a section of Waikato, hence the selected network covers the north-south movements of the North Island as well as the east-west regional movements.
Figure 2: Map of the Case Study.
Strategic links are then initially identified as roads between major centres or road junctions. These links are further refined by considering a suitable detour. For example, consider the link along SH1 between Taihape and Waiouru; there is no suitable detour therefore a longer link is selected and in this case, from the road junction at Vinegar Hill through to Waiouru. The only suitable detour is identified from Vinegar Hill to Bulls (SH1) then to Wanganui (SH3) then to Raetihi (SH4) and finally along SH49 to Waiouru. Hence, Vinegar Hill to Waiouru is taken as a strategic link and Taihape is located within this link.
Having determined the strategic links and the associated detour, the next step in the vulnerability method is to segment each of these links into consistent sections of road. This categorisation of a route is necessary in order to identify the most vulnerable parts of a link and the constraining attributes along the detour. Road consistency models are then used to determine the bottlenecks, highlighting areas of most concern within the network.
The appropriate model is then selected based on the characteristics of the road network. In the case of a rural road network, the vulnerability of a road closure event is primarily due to the risk of environmental factors; therefore, the preferred consistency model is based on the
‘environment’, hence each strategic link is categorised into road lengths with consistent road and roadside attributes. Other types of consistency models, such as ‘efficiency’, would be more appropriate for a different type of network (such as an urban network); the ‘driving demand’ model may provide further insight into the vulnerability that road crashes have on the disruption of a rural road network. Although suggested as relevant, the application of an ‘efficiency’ model or the development of a ‘driving demand’ model was beyond the scope of this research.
For this selected case study, road information such as geometry, crash statistics and traffic counts were sourced from a road asset database; data has been collected under road sections representing consistent types of road environments. For example, winding sections of the Manawatu Gorge (where there are high unstable hillsides) are recorded under a route section which is separate to the Manawatu plains (where there is a risk of occasional flooding); hence the road asset database was already segmented into appropriate road sections representing an environmental consistency model.
Additional qualitative data was also collected; representing an assessment of risk sites which could potentially close a road. Data collection involved a survey of each road section where hazardous sites were identified and categorised as determined by a classification library. The survey of the network was achieved by either a site visit, local knowledge of the area or the use of a video database. Evidence of each site was recorded including the two key attributes of length and type of hazard in addition to a photo, a locational reference and additional comments specific to the site. Over 275 hazardous sites were identified into nine (9) categories over the network; categories included over-slips, under-slips, bridges, tunnels, snow, falling trees and flooding.
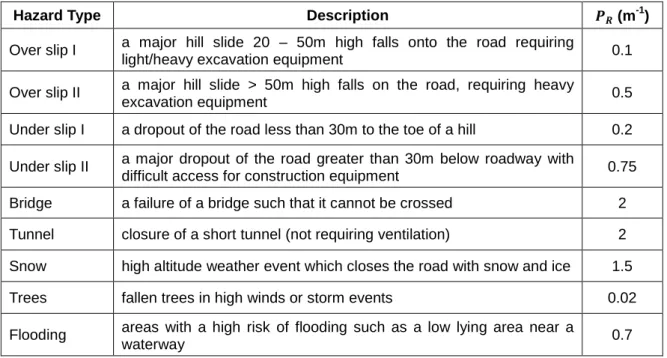
Table 1 illustrates a generalised classification table used in the analysis of linear hazards. The scaling factor (𝑃𝑅) was determined by assessing the consequence for each hazard; taking into account the duration it would take to re-establish the road. (m-1)
Table 1: Hazard Classification and Risk Profile Factor
Hazard Type Description 𝑷𝑹 (m-1)
Over slip I a major hill slide 20 – 50m high falls onto the road requiring
light/heavy excavation equipment 0.1
Over slip II a major hill slide > 50m high falls on the road, requiring heavy
excavation equipment 0.5
Under slip I a dropout of the road less than 30m to the toe of a hill 0.2 Under slip II a major dropout of the road greater than 30m below roadway with
difficult access for construction equipment 0.75
Bridge a failure of a bridge such that it cannot be crossed 2
Tunnel closure of a short tunnel (not requiring ventilation) 2
Snow high altitude weather event which closes the road with snow and ice 1.5
Trees fallen trees in high winds or storm events 0.02
Flooding areas with a high risk of flooding such as a low lying area near a
waterway 0.7
The length of each identified hazard was then multiplied by the corresponding scaling factor resulting in a common risk rating value which can then be tallied, along with other types of hazards sites, within the road section. Note that each category could be elaborated on further; for example, Table 1 assumes that all bridges have an identical risk profile and this may not be realistic due to the age and condition of the bridge, remoteness or other site specific constraints. However, for simplicity this analysis has assumed that all bridges have identical risk per metre of road closure. For the development of the method, a simple hazard classification has been used which is appropriate for a broad-based approach.
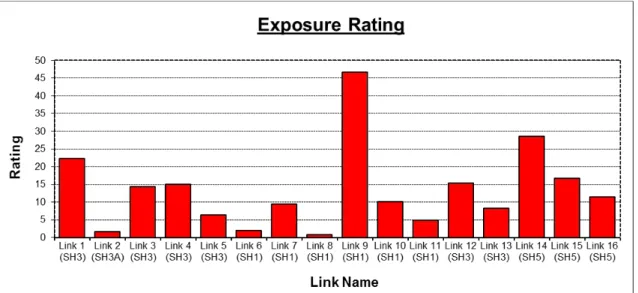
An exposure rating for each road section was then determined by combining the linear hazards with non-linear hazards, such as the crash rate for the road section. A risk profile factor of 0.4 was assumed (based on the overall consequence when a vehicle crash closes the road) to convert the crash rate of a road section to a common risk rating value. Data for each road section was entered into a spreadsheet and tallied for each strategic link. Figure 3 illustrates the resulting exposure rating. Link 9 (includes the Desert Road) and Link 14 (Napier to Taupo road) have the highest exposure rating; both have a history of frequent snow and ice events. Link 1 also rates highly and is the strategic link from Taranaki to Waikato which includes Mount
Messenger and the Awakino Gorge with over 10km of mountainous terrain whereas Link 13 (the Manawatu Gorge) is less exposed with approximately 5km of adjacent hillside over 50m in height.
Figure 3: Exposure rating.
Once the exposure for each strategic link has been determined, an assessment of the least cost detour for each link is made using a similar methodology. This involves segmenting each detour using a consistency model; in this case, the same model was used to divide the route into common environmental sections. Figure 4 illustrates the resulting diversion ratings for each strategic link. One of the key factors in the diversion rating is the level of service (US
Transportation Research Board 2000) of the alternative route. Link 13 (Manawatu Gorge) rates the highest due to the alternative route performing much worse than would be expected for a strategic route. The associated detour to Link 13 is Saddle Road (a local road) which is a very steep, narrow and winding road with little opportunity for overtaking.
Figure 4: Diversion Rating.
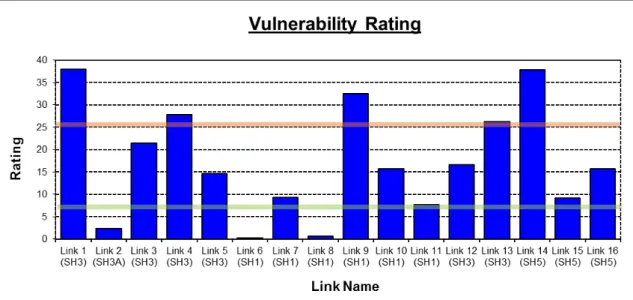
The exposure rating is then combined with the diversion rating to give an overall rating of vulnerability for each strategic link. As shown in Figure 5, there are three bands of vulnerability (high-medium-low) — the five most vulnerable links in the network are; Link 1 from Taranaki to Waikato via the Awakino Gorge; Link 9 (Desert Road); Link 14 (Napier-Taupo Road); Link 13 (Manawatu Gorge) and Link 4 linking Hawera with Wanganui. All of these strategic links have been reported in recent times to have been closed proving a major inconvenience to regional traffic movements.
Figure 5: Vulnerability Rating.
Further analysis of the highly vulnerable roads reveal road sections with the highest exposure ratings. For example, the alpine areas along Link 9 (Desert Road) and Link 14 (the summit along the Napier-Taupo Road) and also the road sections within mountainous terrain along Link 1 (the Awakino Gorge) and Link 13 (the Manawatu Gorge). Further drilling down of the
attributes for both exposure and the diversion ratings reveal additional insight to the network providing useful information when considering capital improvements or management of unexpected events.
CONCLUSION
The purpose of this research was to develop a method to assess the vulnerability of a transport network. A prototype method, to rate the vulnerability of a strategic rural road network, has been developed using a broad based approach achieving the aims of this research; and providing a cost effective method to visualise vulnerability. Certain characteristics of vulnerability have been explored and it is proposed that the concepts developed to rate
vulnerability for a strategic rural road network are common to rating the vulnerability of all types of strategic transport networks; in particular, the concept of an ‘exposure rating’ combined with a ‘diversion rating’. Using these two measures as rating formulae, an overall vulnerability rating for a particular link can be derived. Rating all strategic links in the network achieves a
comparison, highlighting those which are most vulnerable.
The prototype method has been applied to a strategic rural road network of the central North Island of New Zealand and found to give sensible results. The network is diverse with a wide range of topography and environmental conditions. A road inventory database was available for the network reducing the cost of quantitative data collection; a video database was also
available reducing the costs of qualitative data collection; in addition, implementing the method involved the use of standard office software.
The developed prototype method is a low cost rating method to assess the vulnerability of a strategic rural road network. The method is flexible enough to evaluate a range of road closure incidents and also the consequences in servicing the diverted traffic. It has been tried and tested and is considered a very useful tool in identifying the vulnerabilities in a rural road network. It is proposed that by using the same or similar methodical technique then the vulnerability for other types of networks could be evaluated.
REFERENCES
Berdica, K. (2002). An Introduction to road vulnerability: what has been done, is done and should be done. Transport Policy. Vol 9 , pp 117-127
Bolland, J., Jones, R., (2010). Feasibility study of a national trip-end model for New Zealand. NZ Transport Agency research report no. 413
Gibreel, G., Easa, S., Hassan, Y., and El-Dimeery, I. (1999). State of the Art of Highway Geometric Design Consistency. Journal of Transportation Engineering., Vol 125 Issue 4, pp 305–313.
Goldratt, E. M. (1988). Computerized Shop floor scheduling. Journal of Production Research Vol 26 No,3 pp 443-445
McKay, C., (2012). Gorge road back after 13months, $21m, Hawke’s Bay Today, [online] 19 October 2012, Available at < http://www.hawkesbaytoday.co.nz/news/gorge-road-back-after-13-months-21m-/1588860/ > , [accessed on 30/10/2012].
McMurry, K (2013). Storms close roads, cuts power. [online] 16 October 2013, Available at <http://www.stuff.co.nz/taranaki-daily-news/news/9287382/Storms-close-roads-cuts-power>. [accessed on 10/3/2014].
Nicholson, A.J. , Dalziell, (2002). “Risk Evaluation and Management: A Road Network Reliability Study”. In: E.P., Bell, M. and Iidra ,Y. Proceedings of the 1st International Symposium on Transport Network Reliability. Kyoto Japan, 31st July and 1st August 2001. Oxford UK: Elsevier Science Ltd, pp 45-59
NZ Transport Agency (2011). State Highway Asset Management Plan. NZ Transport Agency. NZ Transport Agency (2013). State Highway 1 – the Desert Road – unlikely to re-open today. [online] 11 July 2013, Available at
<http://www.nzta.govt.nz/traffic/current-conditions/bulletin/2689/news.html>. [accessed on 10/3/2014]
Seville (nee Dalziell), E., Metcalfe, J.(2005). Developing a hazard risk assessment Framework for the New Zealand State Highway Network. Land Transport New Zealand Research Report 276.
Standards New Zealand (2009). AS/NZS ISO 31000:2009 Risk Management Principles and guidelines. Wellington: Standards New Zealand.
Taylor, C. E., Werner, S. D., Jakubowski, S. (2001). Walkthrough method for catastrophe decision making. Natural Hazards Review: Vol. 2, No. 4 , pp 193-202
Taylor, M. P., D’Este, G. (2007). Transport Network Vulnerability: a Method for Diagnosis of Critical Locations in Transport Infrastructure Systems. In: MURRAY, A. & GRUBESIC, T. (eds.) Critical Infrastructure. Springer Berlin Heidelberg.
US Federal Highway Administration (2005). Highway Performance Monitoring System. , Washington, D.C.
US Transportation Research Board (2000), Highway Capacity Manual. , Washington, D.C.
AUTHOR BIOGRAPHIES
Vaughn Scott has over 18 years’ experience in road engineering, has worked for consultancies and his own start up business, practicing across central and local government road controlling authorities in the areas of road design, transportation, IT and GIS. Research for this paper occurred as part of Vaughn’s Master of Engineering Studies (Hons) degree. Recent work includes a role at Auckland Transport Road Safety Department with an emphasis on safer journeys to and from schools in the Auckland region.
Roger Dunn is a Professional Teaching Fellow, a part-time position, in the Department of Civil & Environmental Engineering at the University of Auckland. Previously as Associate Professor and Director of Transportation, he had overall responsibility for the teaching in the area of transportation engineering and planning which comprises about 700 undergraduate, about 150 post graduate course enrolees. In transportation engineering, there are eight academic staff and two technical / support staff.
In recent years, his research projects have included roundabout design, crash studies, intelligent transport systems, rail wear and sustainable transport bench marking. He is on the Editorial Panel of Road and Transport Research Journal, a Fellow and Life Member of both ITE and IPENZ and a Life Member and past Chair of National Committee of IPENZ Transportation Group.
Copyright Licence Agreement
The Author allows ARRB Group Ltd to publish the work/s submitted for the 26th ARRB Conference, granting ARRB the non-exclusive right to:
• publish the work in printed format • publish the work in electronic format • publish the work online.
The Author retains the right to use their work, illustrations (line art, photographs, figures, plates) and research data in their own future works
The Author warrants that they are entitled to deal with the Intellectual Property Rights in the works
submitted, including clearing all third party intellectual property rights and obtaining formal permission from their respective institutions or employers before submission, where necessary.