Integration of Data Mining Classification Techniques
and Ensemble Learning for Predicting the Type of Breast
Cancer Recurrence
Jesús Silva1, Omar Bonerge Pineda Lezama2, Noel Varela3, Luz Adriana Borrero4 1Universidad Peruana de Ciencias Aplicadas, Lima, Perú.
2Universidad Tecnológica Centroamericana (UNITEC), San Pedro Sula, Honduras
3,4 Universidad de la Costa, St. 58 #66, Barranquilla, Atlántico, Colombia {nvarela2, lborrero2}@cuc.edu.co
Abstract. Conservative surgery plus radiotherapy is an alternative to radical mastectomy in the early stages of breast cancer, presenting equivalent survival rates. Data mining facilitates to manage the data and provide the useful medical progression and treatment of cancerous conditions as these methods can help to reduce the number of false positive and false negative decisions. Various machine learning techniques can be used to support the doctors in effective and accurate decision making. In this paper, various classifiers have been tested for the prediction of type of breast cancer recurrence and the results show that neural networks outperform others.
Keywords: breast cancer; recurrence events; nonrecurrence events; K-Means clustering.
1 Introduction
Worldwide, breast cancer is the most common neoplasm among women; During 2016, more than two million new cases were registered and 810 712 deaths due to this disease. In the United States of America, during the same year, 409,995 new cases were identified, of which almost 83,000 women died. In Mexico, the incidence of breast cancer is lower, however, reported 21 064 cases and 8310 deaths [1].
Due to its detection in earlier stages as well as advances in adjuvant chemotherapy, it has been possible to reduce recurrence and mortality [2]. Micrometastatic disease is the cause of recurrence and suggests the use of adjuvant therapy. The calculation of the risk of recurrence in early breast cancer is established through the analysis of various characteristics of the patient and the tumor; the age at diagnosis, tumor size, state of the axillary ganglia, degree of differentiation and the presence or absence of vascular or lymphatic invasion, have been some widely validated prognostic factors [3].
overexpression of the protein or amplification of the HER2 oncogene have been shown to be useful in establishing the prognosis and predicting the response to specific treatment modalities [4]. Distant Metastasis is diagnosed after minimum of three months from primary tumor and this accounts for 60% to 70% of the patients [5]. However, using Machine Learning (ML) tools it is possible to extract key factors that help to predict the recurrence of the disease.
Machine learning has been practiced for some years, and with good results, in the social sciences, marketing, finance and applied sciences. In medicine it has barely been used, partly for cultural and philosophical reasons that assume that a computer will never be as capable as a human doctor; and by the refusal of some doctors to feel questioned, supervised or advised by a machine or by an engineer [6], [7].
Thus, even in the biological sciences and genomic medicine, advanced computational methods are already used; while clinicians have to deal with increasingly large and complex databases using traditional statistical methods [8], [9], [10].
Due to its characteristics of complexity and uncertainty, medicine is one of the fields of knowledge that can benefit most from an interaction with disciplines such as computing and machine learning to strengthen processes such as clinical diagnosis and perform predictive analyzes about patients and their prognosis, resulting in a more efficient health system and better use of resources [11].
The objective of this paper is the Integration of Data Mining Classification Techniques and Ensemble Learning for Predicting the Type of Breast Cancer Recurrence. Various data mining algorithms such as Support Vector Machine (SVM), Decision Tree (DT), Naïve Bayes (NB) and Neural Networks which includes the Generalized Regression Neural Network (GRNN) can be used for the prediction of type of breast cancer recurrence.
2. Bibliographic Review
Traditional statistics are not enough to handle large amounts of variables, as they are found in many current databases. Machine learning is knowledge gained by computationally processing training data contained in those databases [12]. The recognition of statistical patterns is an approach to explore a set of data and discover previously unsuspected relationships, without the need for a hypothesis. The problems that arise and the strategies to solve them can be divided into: clustering, reduction of dimensions (dimensionality reduction) and classification [13].
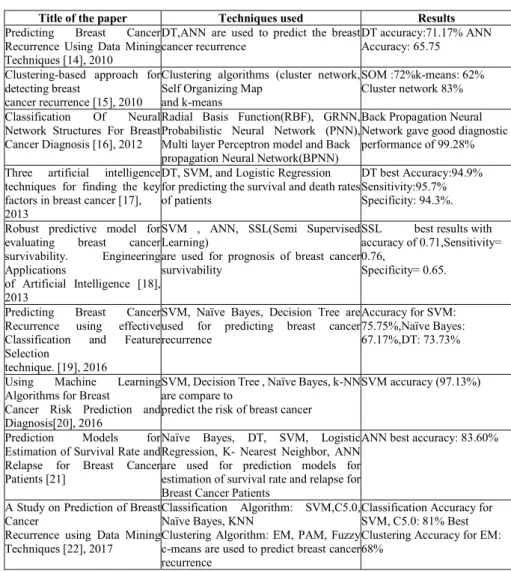
In recent years lot of study has been done for breast cancer prognosis using machine learning techniques. Also these algorithms have been applied for predicting the key factors in breast cancer recurrence. Table 1 provides the details of literature survey done for the same.
Table 1. Different Data Mining Techniques for Breast Cancer Prognosis
Title of the paper Techniques used Results
Predicting Breast Cancer Recurrence Using Data Mining Techniques [14], 2010
DT,ANN are used to predict the breast cancer recurrence
DT accuracy:71.17% ANN Accuracy: 65.75
Clustering-based approach for detecting breast
cancer recurrence [15], 2010
Clustering algorithms (cluster network, Self Organizing Map
and k-means
SOM :72%k-means: 62% Cluster network 83%
Classification Of Neural Network Structures For Breast Cancer Diagnosis [16], 2012
Radial Basis Function(RBF), GRNN, Probabilistic Neural Network (PNN), Multi layer Perceptron model and Back propagation Neural Network(BPNN)
Back Propagation Neural Network gave good diagnostic performance of 99.28%
Three artificial intelligence techniques for finding the key factors in breast cancer [17], 2013
DT, SVM, and Logistic Regression for predicting the survival and death rates of patients
DT best Accuracy:94.9% Sensitivity:95.7% Specificity: 94.3%.
Robust predictive model for evaluating breast cancer survivability. Engineering Applications
of Artificial Intelligence [18], 2013
SVM , ANN, SSL(Semi Supervised Learning)
are used for prognosis of breast cancer survivability
SSL best results with accuracy of 0.71,Sensitivity= 0.76,
Specificity= 0.65.
Predicting Breast Cancer Recurrence using effective Classification and Feature Selection
technique. [19], 2016
SVM, Naïve Bayes, Decision Tree are used for predicting breast cancer recurrence
Accuracy for SVM: 75.75%,Naïve Bayes: 67.17%,DT: 73.73%
Using Machine Learning Algorithms for Breast
Cancer Risk Prediction and Diagnosis[20], 2016
SVM, Decision Tree , Naïve Bayes, k-NN are compare to
predict the risk of breast cancer
SVM accuracy (97.13%)
Prediction Models for Estimation of Survival Rate and Relapse for Breast Cancer Patients [21]
Naïve Bayes, DT, SVM, Logistic Regression, K- Nearest Neighbor, ANN are used for prediction models for estimation of survival rate and relapse for Breast Cancer Patients
ANN best accuracy: 83.60%
A Study on Prediction of Breast Cancer
Recurrence using Data Mining Techniques [22], 2017
Classification Algorithm: SVM,C5.0, Naïve Bayes, KNN
Clustering Algorithm: EM, PAM, Fuzzy c-means are used to predict breast cancer recurrence
Classification Accuracy for SVM, C5.0: 81% Best Clustering Accuracy for EM: 68%
3. Data and Methods
3.1 Determination of the data set to intervene
The UCI (University of California, Irvine) Machine Learning Repository is a collection of databases, domain theories, and data generators that are used by the machine learning community for the empirical analysis of machine learning algorithms. The archive was created as an ftp archive in 1987 by David Aha and fellow graduate students at UC
Irvine. Since that time, it has been widely used by students, educators, and researchers all over the world as a primary source of machine learning data sets. As an indication of the impact of the archive, it has been cited over 1000 times, making it one of the top 100 most cited "papers" in all of computer science. The current version of the web site was designed in 2007 by Arthur Asuncion and David Newman, and this project is in collaboration with Rexa.info at the University of Massachusetts Amherst. Funding support from the National Science Foundation is gratefully acknowledged [23].
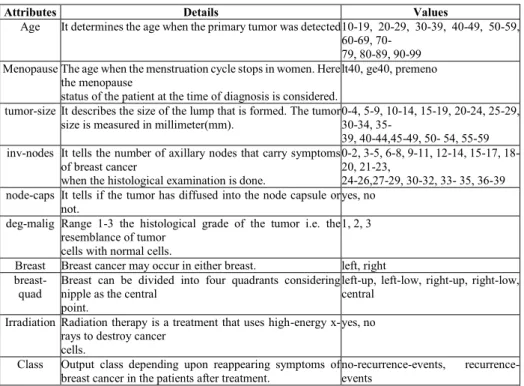
The breast cancer recurrence Dataset has been taken from UCI Machine Learning Repository available online [23]. It is provided by the University Medical Centre, Institute of Oncology, Ljubljana, Yugoslavia. It consists of 286 instances and 10 attributes (explained in Table 2) which includes a Class attribute that decides the outcome of the breast cancer being recurrence and non-recurrence. The italicized terms in the Table 2 are the standard terms used in UCI Machine Learning Repository. Table 2. UCI Breast Cancer Dataset
Attributes Details Values
Age It determines the age when the primary tumor was detected 10-19, 20-29, 30-39, 40-49, 50-59, 60-69, 70-
79, 80-89, 90-99 Menopause The age when the menstruation cycle stops in women. Here
the menopause
status of the patient at the time of diagnosis is considered.
lt40, ge40, premeno
tumor-size It describes the size of the lump that is formed. The tumor size is measured in millimeter(mm).
0-4, 5-9, 10-14, 15-19, 20-24, 25-29, 30-34, 35-
39, 40-44,45-49, 50- 54, 55-59 inv-nodes It tells the number of axillary nodes that carry symptoms
of breast cancer
when the histological examination is done.
0-2, 3-5, 6-8, 9-11, 12-14, 15-17, 18-20, 21-23,
24-26,27-29, 30-32, 33- 35, 36-39 node-caps It tells if the tumor has diffused into the node capsule or
not.
yes, no
deg-malig Range 1-3 the histological grade of the tumor i.e. the resemblance of tumor
cells with normal cells.
1, 2, 3
Breast Breast cancer may occur in either breast. left, right breast-
quad Breast can be divided into four quadrants considering nipple as the central point.
left-up, left-low, right-up, right-low, central
Irradiation Radiation therapy is a treatment that uses high-energy x-rays to destroy cancer
cells.
yes, no
Class Output class depending upon reappearing symptoms of breast cancer in the patients after treatment.
no-recurrence-events, recurrence-events
3.2 Data cleansing and data pre-processing
The large quantities of information contained in the database require an efficient presentation, not only to reduce the dimensionality, but also to preserve the information relevant for an efficient classification, for which the fields were checked to eliminate the ones which did not contain relevant information for the forecasting process [24].
3.3 Reduction of variables
In the process of reduction of the variables it is important to identify the type of information they transmit. Such information can be of three types: (i) Redundant: repetitive or predictable information; (ii) Irrelevant: Information that is not relevant for the information discovery process; and (iii) Basic: the relevant that constitutes an important part in a process of prediction or discovery of information (Caamaño et al., 2015) [25]. The importance of the reduction of data lies in the improvement of the input data for the algorithms to efficiently classified the relationship between variables. 3.4 Attribute Filters
WEKA (Mark et al., 2009) [16-26] allows manipulations on the data by applying filters. They can be applied in two levels, attributes and instances. It was decided to apply a refinement to the model in order to get a slightly higher probability of success. Filtering operations have the option to apply "cascading", so that each filter takes the data set resulting from a previous filter as an input. In the model, the method of exhaustive search was used, which can be expressed as a tuple (Anon 2016, p.3) [27]:
(𝑋1,𝑋2,….𝑋𝑛 ) (1) Satisfying some restrictions.
P(𝑋1,𝑋2,….𝑋𝑛 ) (2) Optimizing a certain objective function. In each moment, the algorithm will be found in a certain k level, with a partial solution.
(𝑋1,….𝑋𝑘 ) (3) Each set of possible values of the tuple represents a node of the tree of solutions. The process continues until the partial solution is a complete solution of the problem, or until there are no more possibilities to try.
3.5 Evaluation of data mining techniques
For the development of this research, the classification and prediction techniques were used in the construction of models from the data to determine the recurrence of breast cancer. The Bayesian classifier (Naive Bayes) was used as the initial classifier and, in the second instance, decision trees C4.5 (J48), later Support Vector Machine (SVM) and Generalized Regression Neural Network (GRNN). The data mining tool called
WEKA was used to classify data, and the predicted class was compared with the current class of the instances to measure the effectiveness of the classification algorithm. There are several ways to carry out the assessment. In this case, "use training set" was applied
to use the same sample to train and test (Hepner 1990). [28] Among the algorithms provided by WEKA, the following were analyzed:
Naive Bayes Algorithm
A Bayesian classifier is a probabilistic classifier based on the Bayes theorem and some additional simplifying hypotheses (Agarwal et al., 2015) [29]. The Bayes classifier combines this model with a decision rule. The first rule in common is to collect the hypothesis of the more likely one, also known as the maximum a posteriori or MAP. The Bayer classifier (the function Classify) (Larrañaga et al., 1997, p.6) [30] is defined as:
𝑝(𝑋1= 𝑥1, … , 𝑋𝑛= 𝑥𝑛/𝐶 = 𝑐) = ∏𝑖=1𝑛 𝑝(𝑋𝑖= 𝑥𝑖/𝐶 = 𝑐) (4)
Where: In the case of n predictor variables X1,…, Xn are continuous, the Naive Bayes paradigm is converted to find the value of the variable C, which is denoted by c, which maximizes the a posteriori probability of the variable C, given the evidence expressed as an instantiation of the variables X1,…, Xn, this is, X = (X1,…, Xn).” Therefore, in the Naïve Bayes paradigm, the search for the most probable diagnosis, c*, once known the symptoms (X1,…, Xn) of a particular patient, is reduced to:
c* = 𝑎𝑟𝑔𝑐 M𝑎𝑥 𝜌 (𝐶=𝑐 |𝑋1= 𝑥1,…,𝑋𝑛= 𝑥𝑛) (5) = 𝑎𝑟𝑔𝑐𝑀𝑎𝑥 𝑝(𝐶 = 𝑐) ∏𝑛𝑖=1𝑝(𝑋𝑖= 𝑥𝑖/𝐶 = 𝑐) (6)
Algorithm C4.5 (J48)
The algorithm C4.5 builds decision trees of a data system of training in the same way that the ID3 algorithm, which uses the concept of information entropy. The data of the training are a system S = s1, S2,... of samples already classified. Each example s_i = {x_1, x_2,...} is a vector where x_1, x_2,... represent the attributes or characteristics of the example. The training data are augmented with a vector C = {c_1, c_2,...} where c_1, c_2,... represent the class to which it belongs in each sample. C4.5 is an extension of the ID3 algorithm developed earlier by Quinlan. Decision Trees generated by C4.5 can be used for classification, and for this reason, C4.5 is almost always referred to as a statistical classifier (Quinlan, J. R. 1993) [31].
Support Vector Machine (SVM)
SVM is a useful technique for data classification. Even though it’s considered that Neural Networks are easier to use than this, however, sometimes unsatisfactory results are obtained. A classification task usually involves with training and testing data which consist of some data instances [32]. Each instance in the training set contains one target values and several attributes. The goal of SVM is to produce a model which predicts target value of data instances in the testing set which are given only the attributes [33]. Classification in SVM is an example of Supervised Learning. Known labels help indicate whether the system is performing in a right way or not. This information points
to a desired response, validating the accuracy of the system, or be used to help the system learn to act correctly. A step in SVM classification involves identification as which are intimately connected to the known classes. This is called feature selection or feature extraction. Feature selection and SVM classification together have a use even when prediction of unknown samples is not necessary. They can be used to identify key sets which are involved in whatever processes distinguish the classes [33].
Generalized Regression Neural Network (GRNN)
Artificial Intelligence (AI) has a significant impact on the current research trends due its numerous applications in different aspects of the life. Artificial Neural Networks(ANNs) are one of the major parts of AI. ANNs have different applications including regression and approximation, forecasting and prediction, classification, pattern recognition and more. ANNs are useful since they can learn from the data and they have global approximation abilities. A feed-forward neural network with at least single hidden layer and sufficient number of hidden neurons can approximate any arbitrary continuous function under certain conditions [34]. ANNs have two main types: the Feed Forward ANNs (FFANNs) in which the input will only flow to the output layer in the forward direction and the Recurrent ANNs (RANNs) in which data flow can be in any direction. Generalized Regression Neural Networks (GRNN) [35] are single-pass associative memory feed-forward type Artificial Neural Networks (ANNs) and uses normalized Gaussian kernels in the hidden layer as activation functions.
GRNN advantages include its quick training approach and its accuracy. On the other hand, one of the disadvantage of GRNN is the growth of the hidden layer size. However, this issue can be solved by implementing a special algorithm which reduces the growth of the hidden layer by storing only the most relevant patterns [36].
3.6 Definition of the data mining technique
The evaluation of data obtained from the application of the methods is carried out by using the following variables as a comparison: Correct instances, absolute error, confusion matrix and ease for the interpretation of the data [24].
4. Results
4.1 Data pre-processing
The number of instances in the data set presented in Table 3. It also includes few duplicate rows which are eliminated and the count of the recurrence and non-recurrence instances is presented in the table.
Table 3. No. of Instances in Breast Cancer Dataset used in the study. Based on the UCI public database.
Total No. of Instances Recurrence Events (R) Non-Recurrence Events (NR)
286(Original) 85 201
272(After removing Duplicity) 81 191
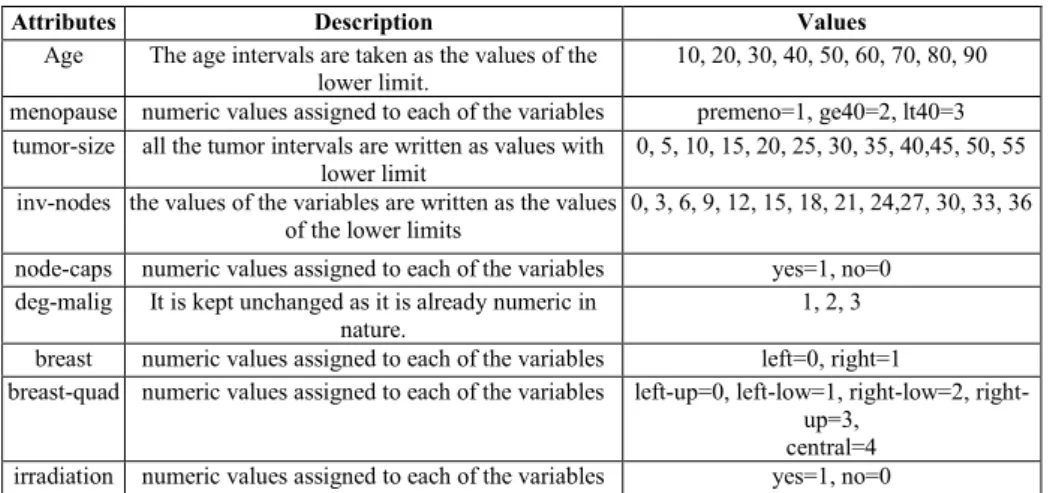
The dataset so obtained after cleaning is nominal in nature [37]. So it is converted into numeric form to be used for further processing (see table 4).
Table 4. Breast Cancer Dataset after normalization
Attributes Description Values
Age The age intervals are taken as the values of the lower limit.
10, 20, 30, 40, 50, 60, 70, 80, 90
menopause numeric values assigned to each of the variables premeno=1, ge40=2, lt40=3 tumor-size all the tumor intervals are written as values with
lower limit
0, 5, 10, 15, 20, 25, 30, 35, 40,45, 50, 55
inv-nodes the values of the variables are written as the values of the lower limits
0, 3, 6, 9, 12, 15, 18, 21, 24,27, 30, 33, 36
node-caps numeric values assigned to each of the variables yes=1, no=0 deg-malig It is kept unchanged as it is already numeric in
nature.
1, 2, 3
breast numeric values assigned to each of the variables left=0, right=1
breast-quad numeric values assigned to each of the variables left-up=0, left-low=1, low=2, right-up=3,
central=4 irradiation numeric values assigned to each of the variables yes=1, no=0
4.2 Evaluation of data mining techniques
Comparison between the results of the Naive Bayes algorithm, C4.5 (J48), Support Vector Machine (SVM) and GRNN, are shown in table 5.
Table 5. Comparison between classification algorithms % Training % Validation % Classification J48 % Naive Bayes Classification %Support Vector Machine (SVM) GRNN 10 90 89 89 89 89 20 80 91 90 90 91 40 60 92 90 90 92 50 50 92 90 90 92 70 30 92 90 90 92 80 20 92 90 90 92 Simple Average 91 89 89 91
With respect to the training data with 10% of the data, all the algorithms present 89% correct classification, the difference lies in the fact that the greater number of training dates, the better the J48 and GRNNN algorithm classifies, with a 91 % efficiency compared to 89% of the Naive Bayes and SVM algorithm.
Comparison of arrays of confusion
One of the benefits of the confusion matrices is that they allow to see if the system is confusing two classes (Corso et al., 2009) [38]. Below the matrices of confusion generated by each of the algorithms applied to the same data set are shown. Table 6 shows that the values of the diagonal are the right findings and the rest are the errors. According to the Naive Bayes Algorithm, out the 260 users with profile b, 240 were well classified and 20 presented errors; in the profile c, 149 were well classified and 131 presented error; in the profile d, 120 were well classified and 40 presented error; and in profile e, 280 were well classified.
Table 6. Confusion Matrix - Adapted from: bayes classifiers.weka..NaiveBayes Confusion Matrix a b c d e Classified as 100 0 0 0 0 a = sR 0 240 20 0 0 b = Low 0 80 149 51 0 c = Medium 0 0 0 120 40 d = High 0 0 0 0 280 e = VHigh
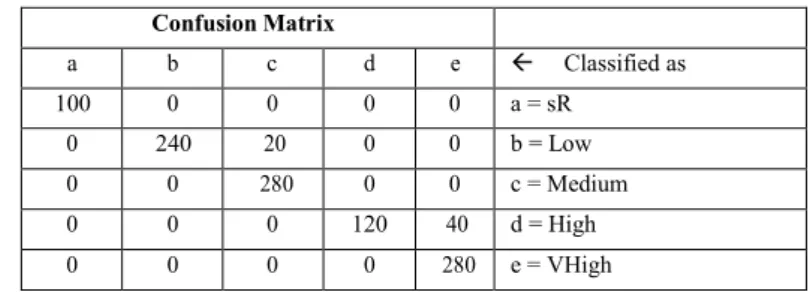
For the Algorithm J48 in Table 7, out of the 260 users with profile a, 240 were well classified and 20 presented errors, and for the 160 users with profile d, 120 were well classified and 40 presented errors.
Table 7. Confusion Matrix - Adapted from: weka.classifiers.trees.J48 -C 0.25 -M2 Confusion Matrix a b c d e Classified as 100 0 0 0 0 a = sR 0 240 20 0 0 b = Low 0 0 280 0 0 c = Medium 0 0 0 120 40 d = High 0 0 0 0 280 e = VHigh
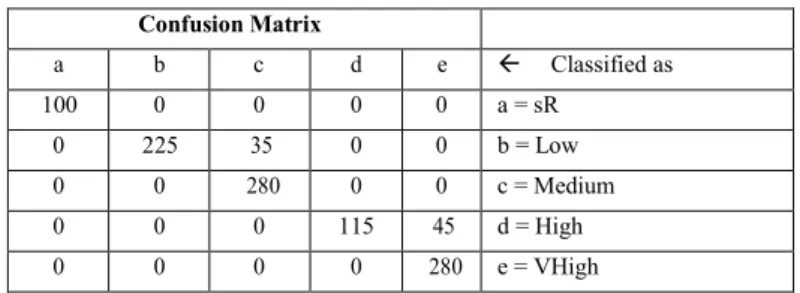
SVM is applied on the nominal form of data with 79% split to get the classification accuracy of 63.48%. In the table 8 are show the values of confusion.
Table 8. Confusion Matrix - SVM Confusion Matrix a b c d e Classified as 100 0 0 0 0 a = sR 0 225 35 0 0 b = Low 0 0 280 0 0 c = Medium 0 0 0 115 45 d = High 0 0 0 0 280 e = VHigh
The numeric form of data is used here and this GRNN is used for classification in MATLAB with training and testing data ratio as 70% and 30 % respectively. The data is randomly selected for training and testing and value of 𝜎 =1 [23].
Table 9. Confusion Matrix - GRNN Confusion Matrix a b c d e Classified as 100 0 0 0 0 a = sR 0 250 10 0 0 b = Low 0 0 280 0 0 c = Medium 0 0 0 140 20 d = High 0 0 0 0 280 e = VHigh
The accuracy measures such as Sensitivity, Specificity, Precision and Recall [39] for all the classifiers are presented in Table 10.
Table 10. Accuracy Measures of different Classifiers
Classifier Sensitivity Specificity Precision Recall SVM 1.000 0.891 0.6348 1.000 Decision Tree J48 0.9442 0.9214 0.8214 0.9548 Naive Bayes 0.936 0.921 0.7789 0.956 GRNN 0.9452 0.9387 0.8849 0.958
5 Conclusions
In this paper, several types of classification algorithms have been used here and can have that neural network classifiers have performed better than other learning classifiers. In the future, the accuracy can be increased by adding more features or by increasing the instances of the dataset. Also, the combination of existing classification
techniques can be used to enhance the efficiency. Besides this a discussion with medical professional can be done to verify the features for the type of recurrence.
References
1. McPherson K, Steel CM, Dixon JM. ABC of breast diseases. Breast cancer-epidemiology, risk factors, and genetics. Bmj 2000;321(7261):624-628.
2. López-Ríos O, Lazcano-Ponce EC, Tovar-Guzman V, Hernández-Avila M. Epidemiology of cancer of the breast in Mexico. Consequences of demography transition. Salud Publica Mex 1997;39(4):259-265.
3. Romieu I, Lazcano-Ponce E, Sanchez-Zamorano LM, Willett W, Hernández-Avila M. Carbohydrates and the risk of breast cancer among Mexican women. Cancer Epidemiol Biomarkers Prev 2004;13(8):1283-1289.
4. Rivera DJ SL, Villalpando HS, González CT, Hernández PB. Encuesta Nacional de nutrición 1999. Estado nutricional de niños y mujeres en México. Cuernavaca: Instituto Nacional de Salud Pública, 2001.
5. Simpson JF, Page DL. Status of breast cancer prognostication based on histopathologic data. Am J Clin Pathol 1994;102(4 suppl 1):S3-S8.
6. Pereira H, Pinder SE, Sibbering DM, Galea MH, Elston CW, Blamey RW, et al. Pathological prognostic factors in breast cancer. IV: should you be a typer or a grader? A comparative study of two histological prognostic features in operable breast carcinoma. Histopathology 1995;27(3):219-226.
7. Ellis IO, Galea M, Broughton N, Locker A, Blamey RW, Elston CW. Pathological prognostic factors in breast cancer. II. Histological type. Relationship with survival in a large study with long-term follow-up. Histopathology 1992;20(6):479-489.
8. Elston CW, Ellis IO. Pathological prognostic factors in breast cancer. I. The value of histological grade in breast cancer: experience from a large study with long-term follow-up. Histopathology 1991;19(5):403-410.
9. NIH consensus conference. Treatment of early-stage breast cancer. JAMA 1991;265(3):391-395.
10. Dabbs DJ, Silverman JF. Prognostic factors from the fine-needle aspirate: breast carcinoma nuclear grade. Diagn Cytopathol 1994;10(3):203-208.
11. Masood S. Prognostic factors in breast cancer: use of cytologic preparations. Diagn Cytopathol 1995;13(5):388-395.
12. Fisher ER, Redmond C, Fisher B, Bass G. Pathologic findings from the National Surgical Adjuvant Breast and Bowel Projects (NSABP). Prognostic discriminants for 8-year survival for node-negative invasive breast cancer patients. Cancer 1990;65(9 suppl):2121-2128. 13. Hortobagyi GN, Ames FC, Buzdar AU, Kau SW, McNeese MD, Paulus D, et al. Management
of stage III primary breast cancer with primary chemotherapy, surgery, and radiation therapy. Cancer 1988;62(12): 2507-2516.
14. Fan, Q. Predicting Breast Cancer Recurrence Using Data Mining Techniques, 310 311 (2010).
15. Belciug, S., Gorunescu, F., Salem, A. B., &Gorunescu, M. Clustering-based approach for detecting breast cancer recurrence. Intelligent Systems Design and Applications (ISDA), 2010 10th International Conference On, 533–538. https://doi.org/10.1109/ISDA.2010.5687211 (2010).
16. Swathi, S., Rizwana, S., &Babu, G. A. Classification of neural network structures for breast cancer diagnosis, 3(1), 227–231. (2012).
17. Chao, C., Kuo, Y., & Cheng, B. (n.d.). Journal of Statistics and Management Three artificial intelligence techniques for finding the key factors in breast cancer, 37–41.
https://doi.org/10.1080/09720510.2012.10701632(November 2014)
18. Park, K., Ali, A., Kim, D., An, Y., Kim, M., & Shin, H. Robust predictive model for evaluating breast cancer survivability. Engineering Applications of Artificial Intelligence, 26(9), 2194– 2205.https://doi.org/10.1016/j.engappai.2013.06.013 (2013).
19. Iqbal Pritom, A., Ahadur Rahman Munshi, M., AnzarusSabab, S., &Shihab, S. (n.d.). Predicting Breast Cancer Recurrence using effective Classification and Feature Selection technique.
20. Asri, H., Mousannif, H., Al Moatassime, H., & Noel, T. Using Machine Learning Algorithms for Breast Cancer Risk Prediction and Diagnosis. Procedia Computer Science, 83(Fams), 1064– 1069.https://doi.org/10.1016/j.procs.2016.04.224 (2016).
21. Paper, C., Ninkovic, S., &Centar, K. (2015). Prediction Models for Estimation of Survival Rate and Relapse for Breast Cancer Patients, (March 2016).
22. Prghov, F., Prghov, F., &Errvwlqj, D.). $ 6Wxg\ 2Q 3Uhglfwlrq 2I%Uhdvw &Dqfhu 5Hfxuuhqfh8Vlqj’Dwd 0Lqlqj 7Hfkqltxhv, 527– 530. (2017)
23. The UCI (University of California, Irvine) Machine Learning Repository. Available in https://archive.ics.uci.edu/ml/datasets/breast+cancer. Rev. (2019)
24.Viloria, A., Bucci, N., Luna, M.: Comparative analysis between psychosocial risk assessment models. J. Eng. Appl. Sci. 12(11), 2901–2903 (2017). ISSN: 1816 – 949X. Medwell Journals 25. Caamaño, A. J., Echeverría, M. M., Retamal, V. O., Navarro, C. T., y Espinosa, F. T. Modelo predictivo de fuga de clientes utilizando minería de datos para una empresa de telecomunicaciones en chile. Universidad Ciencia y Tecnología, 18(72) (2015).
26. Mark Hall y otros 5 autores; The WEKA Data Mining Software: An Update; SIGKDD Explorations, Volume 11, Issue 1 (2009).
27.Anon, D. Búsqueda exhaustive.http://dis.um.es/~domingo/apuntes/AlgBio/exhaustiva.pdf, Universidad de Murcia, España (2016).
28. Hepner, G. F. Artificial neural network classification using a minimal training set. Comparison to conventional supervised classification.Photogrammetric Engineering and Remote Sensing, 56(4), 469-473 (1990).
29. Agarwal, B., y Mittal, N. Text classification using machine learning methods-a survey. In Proceedings of the Second International Conference on Soft Computing for Problem Solving (SocProS 2012), December 28-30, 2012 (pp. 701-709). Springer India (2014).
30. Larrañaga, P., Inza, I., y Moujahid, A. Tema 6. Clasificadores Bayesianos. Departamento de Ciencias de la Computación e Inteligencia Artificial (En línea: http://www.sc.ehu.es/ccwbayes/docencia/mmcc/docs/t6bayesianos.pdf acceso: 9 de enero de 2016), Universidad del País Vasco-Euskal Herriko Unibertsitatea, España (1997).
31. Quinlan, J. R. C4. 5: programs for machine learning. Elsevier, Burlington, Canada. (1993). 32. Kumar, G., & Malik, H. Generalized Regression Neural Network Based Wind Speed
Prediction Model for Western Region of India. Procedia Computer Science, 93(September), 26–32. https://doi.org/10.1016/j.procs.07.177 (2016)
33. Sun, G., Hoff, S., Zelle, B., & Nelson, M.Development and Comparison of Backpropagation and Generalized Regression Neural Network Models to Predict Diurnal and Seasonal Gas and PM 10 Concentrations and Emissions from Swine Buildings, 0300(08) (2008).
34. Cigizoglu, H. K. Generalized regression neural network in monthly flow forecasting. Civil
Engineering and Environmental Systems, 22(2), 71–84.
https://doi.org/10.1080/10286600500126256. (2005)
35. Kişi, Ö. Generalized regression neural networks for evapotranspiration modelling generalized regression neural networks for evapotranspiration modelling, 6667. (2010). 36. Kartal, S., & Oral, M. International Journal of Advanced Research in New Pattern Reduction
Method for Generalized Regression Neural Network, 7(2), 122–129. https://doi.org/10.23956/ijarcsse/V7I2/01213 (2017).
37. Cross, A. J., Rohrer, G. A., Brown-Brandl, T. M., Cassady, J. P., & Keel, B. N. Feed-forward and generalised regression neural networks in modelling feeding behavior of pigs in the
grow-finish phase. Biosystems Engineering, 1–10.
https://doi.org/10.1016/j.biosystemseng.2018.02.005 . (2018).
38. Corso, C. L. Alternativa de herramienta libre para implementación de aprendizaje automático. http://www.investigacion.frc.utn.edu.ar/labsis/Publicaciones/congresos_labsis/cynthia/Alter nativa_de_herramienta_para_Mineria_Datos_CNEISI_2009.pdf, acceso: 10 de agosto de 2015), Argentina (2009).
39. Manickam, R. Back propagation neural network for prediction of some shell moulding parameters. PeriodicaPolytechnica Mechanical Engineering, 60(4), 203–208. https://doi.org/10.3311/PPme.8684 . (2016).