Data Standardization and Quality
Degradation of Human-readable Data
Research-in-Progress
Xitong Li
HEC Paris
1 rue de la Liberation
78351 Jouy-en-Josas, France
[email protected]
Hongwei Zhu
University of Massachusetts, Lowell
One University Avenue
Lowell, MA 01854, USA
[email protected]
Abstract
Data standardization is a widely recommended solution to improving data quality. Despite the potential benefits, we examine if it has any unintended, especially undesirable, side effects on data quality. The eXtensible Business Reporting Language (XBRL) is an XML-based open standard that aims to facilitate the preparation, exchange and comparison of financial reports. Leveraging the unique opportunity created by the exogenous mandatory XBRL adoption enforced by the U.S. SEC, we use a difference-in-differences (DID) research design to establish the causal relationship between XBRL adoption and quality of HTML-formatted financial reports, an important source for investors and analysts to obtain firms’ financial information. Surprisingly, we find the mandatory XBRL adoption has degraded the quality of the adopting firms’ HTML-formatted financial reports, as measured by a number of data quality metrics, including spelling errors and readability. The U.S. SEC and adopting firms need design appropriate policies to minimize the undesirable side effects.
Keywords: Data standardization, data quality, readability, XBRL, financial reports
Introduction
Data standardization is a widely recommended solution to improving data quality (Madnick et al. 2009; Wang and Strong 1996). Standardization is often applied to structured and semi-structured data, with a potential to improve such data’s interoperability, consistency, and other data quality dimensions (Wang and Strong 1996). Structured and semi-structured data are often accompanied by a large amount of non-standardized, human-readable information. While a data standardization effort can potentially improve quality of structured and semi-structured data, little research examines whether it has any impact on the quality of accompanying human-readable information. Given the practical use and continued importance of human-readable data, we seek to answer this research question by leveraging an exogenous data standardization mandate enforced by the U.S. Securities and Exchange Communication (SEC).
Recognizing “the vital role of the Internet and electronic communications in modernizing the disclosure system under the federal securities laws”, the SEC has long required filers to make their financial reports publicly available on the EDGAR system in HTML format. These human-readable financial reports are an important source for investors and analysts to obtain public firms’ financial information. Accordingly, the SEC has continually encouraged public firms to make their financial reports more readable and easier to understand. For example, in October 1998 the SEC issued a regulation that required public firms to use plain English in the drafting and formatting of all financial reports (US Securities Exchange Commission 1998). Yet, it is difficult for computer programs to automatically process or aggregate data in HTML-formatted financial reports. To overcome this limitation, the SEC adopted eXtensible Business Reporting Language (XBRL), an XML-based open standard that uses the XML syntax and related XML technologies (e.g., XML schema and XLink) to define and exchange financial information digitally. In April 2009, the
SEC mandated that all public firms listed in the U.S. must submit their financial statements (Item 8 of Form 10-K) in XBRL format in addition to the reports in HTML format. By adopting XBRL, firms have to tag each numerical value in the financial statements using standard tags defined in the Generally Accepted Accounting Principles (GAAP) XBRL taxonomy (with over 15,000 unique tags) or custom tags. Because the XBML adoption is still in the early stage and many practitioners concern the quality of XBRL-tagged data (Debreceny et al. 2010; Du et al. 2013), the HTML-formatted financial reports continue to be an important source for investors and analysts to obtain financial information about public firms. The SEC’s EDGAR system currently contains financial reports in both formats and makes them publicly available.
The literature documents that the quality and clarity of financial disclosure (mainly HTML-formatted financial reports) are significantly associated with information processing costs and have profound implications to market participants (Li 2008; Miller 2010; Subramanian et al. 1993). For example, Li (2008) finds that firms with annual reports of a higher readability (as indicated by a lower Fog index) have more persistent positive earnings. Li (2008) further shows that the effect of annual report readability is as large as that of the absolute amount of accruals. Given the profound implications of the quality of financial disclosure, it is important to examine if the SEC’s mandatory XBRL adoption affects the quality of their HTML-formatted financial reports.
On the one hand, firms that have adopted XBRL may take the advantage of XBRL requirement to optimize data production and financial reporting process, which should help improve the quality of their financial reports (Ballou et al. 1998; Wang 1998; Wang and Strong 1996). The production of XBRL-formatted financial reports also gives firms an additional opportunity to scrutinize their financial reports, including the HTML-formatted reports. Therefore, one may expect the XRBL adoption makes firms devote more efforts on preparing the financial reports and enhances the quality of HTML-formatted reports. On the other hand, however, the adopting firms may reduce the efforts on the HTML-formatted financial reports, perhaps because they have to spend extra resources on preparing XBRL-formatted reports or because they may think HTML-formatted financial reports become less important after the SEC’s XBRL mandate. Moreover, since XBRL is mainly used for tagging numerical values, firms tend to disclose more quantitative data in the financial reports (Blankespoor et al. 2014) and reduce their efforts on preparing qualitative information in the financial reports. Accordingly, the quality of the HTML-formatted financial reports may degrade as a consequence of the XBRL adoption.
Therefore, whether the SEC’s mandatory XBRL adoption enhances or degrades the quality of HTML-formatted financial reports is an empirical research question. The answer to this question will generate important implications to various market participants, including investors, analysts and regulators.
Related Literature and Hypothesis
Related Literature
Research on XBRL Adoption
As an XML-based, freely available and open standard language for exchanging financial information, XBRL draws a growing attention in the information systems and accounting literature. Liu (2013) provides a literature review on XBRL and summarizes three major research themes: XBRL adoption, XBRL implementation, and XBRL value realization assessment. Perdana et al. (2015) also present an integrative literature review on XBRL and identify four research streams: impact of XBRL on business, XBRL adoption, technical development of XBRL, and XBRL education.
A majority of prior studies focus on assessing the effects of XBRL adoption. We briefly describe a few here. Kim et al. (2012) examine the effect of mandatory XBRL disclosure on various aspects of the financial information environment and show an increase in information efficiency, a decrease in event return volatility, and a reduction of change in stock returns volatility. Examining the Korean stock market, Yoon et al. (2011) also find a negative association between XBRL adoption and information asymmetry, suggesting that the XBRL adoption may reduce information asymmetry. Liu et al. (2014) show a positive association between mandatory XBRL adoption and analyst following as well as forecast accuracy. Li and Nwaeze (2014) examine the association between the use of extensions in XBRL filings and firms’ financial
information environment. They find that XBRL extensions are negatively associated with financial information environments of firms at the early phases of XBRL adoption; the association is positive for firms at the later phases. This result is anticipated as firms learn to use XBRL and the standard itself improves over time (Zhu and Wu 2014). Until recently, however, the prior studies merely show the associations (as opposed to causality) between XBRL adoption and various outcomes.
To the best of our knowledge, the only research works that focus on identifying the causal impact of XBRL adoption are conducted by Blankespoor et al. (2014) and Blankespoor (2014). Using a difference-in-difference (DID) design, Blankespoor et al. (2014) examine the market impact of XBRL adoption and find that adopting firms have higher abnormal bid-ask spreads in the year after the XBRL mandate. Blankespoor (2014) also shows that firms increase their quantitative footnote disclosures right after the implementation of XBRL detailed tagging. While we use the same quasi-experimental method for causal inference (i.e., DID design), the current study examines the impact of the mandatory XBRL adoption on a different aspect - the quality of public firms’ HTML-formatted financial filings, which, as discussed later, has profound implications to market participants.
Quality of Annual Financial Reports
The quality of annual financial disclosure has been long an important research topic (Li 2008; Miller 2010; Subramanian et al. 1993). Subramanian et al. (1993) report that the annual reports of profitable firms are easier to read than firms with poor performance. Li (2008) finds that firms with annual reports of a higher readability (as indicated by a lower Fog index) have more persistent positive earnings. Li (2008) further shows that the effect of annual report readability is as large as that of the absolute amount of accruals. Miller (2010) examines the relation between the readability of annual reports and investors’ trading behavior and finds that more complex (longer and less readable) filings are associated with lower overall trading.
Since the SEC’s mandatory XBRL adoption, there have been studies assessing the quality of XBRL data. Debreceny et al. (2010) examine a key aspect of the quality of these filings: correctness of the mathematical relationships implied by the taxonomy and implemented in the instance documents. They find one quarter of the XBRL-formatted filings by the initial 400 large public firms in the first-round submissions have errors. Du et al. (2013) find that the number of errors per filing decreases as a firm gains more experience using XBRL GAAP Taxonomy. The use of a common taxonomy promotes comparability and semantic interoperability of XBRL financial reports. On average, 30% to 40% of XBRL data between any pair of firms in the same industry are directly comparable (Zhu and Wu 2011a; Zhu and Wu 2011b; Zhu and Wu 2014). Boritz and No (2013) compare XBRL-tagged financial data with the data items reported by three prominent data aggregators or redistributors: Compustat, Google Finance, and Yahoo Finance. They find more than 50% of the data items that appear in the XBRL-formatted financial reports from the SEC’s EDGAR website not being available from those aggregators or redistributors, suggesting that the XBRL-formatted financial reports (and the essentially equivalent HTML-formatted reports) are the most complete and accurate source of firms’ financial information. Chychyla and Kogan (2015) also report the numeric values reported in Compustat significantly differ from the values in 10-K filings (HTML-formatted and XBRL-tagged).
While prior studies on XBRL focus on examining the quality of XBRL-tagged financial data, there is a lack of research exploring whether the mandatory XBRL adoption affects the quality of HTML-formatted financial reports. Given that HTML-formatted financial reports continue to be widely used in practice, any possible impact of the mandatory XBRL adoption on the quality of HTML-formatted financial reports shall generate important implications to various market participants, including investors, analysts and regulators.
Theory and Hypothesis
The current study fills the literature gap by examining if the mandatory XBRL adoption results in any impact on the quality of plain-text (HTML-formatted) annual financial reports. In this study we measure the quality of HTML-formatted financial reports in two important aspects: spelling errors and readability (Li 2008; Miller 2010). We note that the direction of the possible impact is not straightforward.
On the one hand, when firms produce XBRL-formatted financial reports, they have additional opportunity to scrutinize their financial reports, including the XBRL-tagged and HTML-formatted reports, because the SEC requires filers to make sure the financial information in both XBRL and HTML formats consistent and publicly available on the EDGAR system. The additional scrutiny will allow firms to improve the quality of their financial reports, leading to less spelling errors and increased readability of the statements. Further, the adoption of XBRL also provides firms with an opportunity to streamline their financial reporting practice and optimize their data production process (Ballou et al. 1998; Wang 1998), which in turn shall improve the quality of their information products, including financial reports in any format. Therefore, we hypothesize
H1a: As a result of the mandatory XBRL adoption, adopting firms’ HTML-formatted financial reports have less spelling errors.
H2a: As a result of the mandatory XBRL adoption, adopting firms’ HTML-formatted financial reports become easier to read.
On the other hand, however, there are several reasons to predict the opposite. First, because XBRL facilitates data exchange and aggregation (Liu 2013; Perdana et al. 2015), market participants’ information processing cost would decrease significantly. The literature on disclosure choice theory (Stocken and Verrecchia 2004; Xu and Zhang 2013) suggests that firms would respond to the lower information processing costs by increasing the amount of information disclosure in their financial fillings (Blankespoor 2014). More information disclosure usually results in longer and more complex financial filings, thus increasing spelling errors and lowering the readability of financial filings (Miller 2010). Second, since XBRL is mainly used for tagging numerical values, firms may simply choose to disclose more quantitative data in financial reports (Blankespoor 2014) but reduce their efforts on preparing qualitative information. Because spelling errors and readability are measurement of the quality of qualitative information, less efforts on preparing qualitative information would result in a decrease in the data quality of financial reports. Third, adopting firms may even reduce their efforts on all of the HTML-formatted financial fillings, because the cost of XBRL adoption is nontrivial and firms have to spend extra resources on preparing XBRL-tagged financial data (Liu 2013; Perdana et al. 2015). Finally, although the EDGAR system currently contains both the HTML-formatted and XBRL-tagged financial reports, it may shift to a solely interactive data system at a future point yet to be determined (Blankespoor et al. 2014). Thus, firms may think HTML-formatted financial reports become less important after the SEC’s mandatory XBRL adoption and thus reduce their efforts on preparing the HTML-formatted financial fillings. Accordingly, the quality of the HTML-formatted financial reports could degrade as a consequence of the mandatory XBRL adoption. Therefore, we hypothesize that
H1b: As a result of the mandatory XBRL adoption, adopting firms’ HTML-formatted financial reports have more spelling errors.
H2b: As a result of the mandatory XBRL adoption, adopting firms’ HTML-formatted financial reports become harder to read.
Research Design and Data
Research Setting
For the mandatory XBRL adoption, the SEC took a phase-in approach by dividing firms into three tiers according to their public float (market value of publicly tradable shares). Tier-1 firms are those “large accelerated filers” with a public float over $5 billion; they are required to begin XBRL filings for fiscal periods ending on or after June 15, 2009. Tier-2 firms are the rest of “large accelerated filers” with a public float between $700 million and $5 billion; they are required to begin XBRL filings for fiscal periods ending on or after June 15, 2010. Tier-3 firms are the remaining filers and are required to begin XBRL filings for fiscal periods on or after June 15, 2011.
During the first year of XBRL adoption, an adopting firm only needs to tag numeric values in the four major financial statements and tag each note as a text block. After that, a practice known as detailed tagging must be implemented. With detailed tagging, adopting firms must tag all numerical values individually, including those in footnotes. XBRL filings are an additional requirement on top of financial
reports in HTML format. Firms usually produce their financial reports in the traditional HTML format first and then create the required XBRL filings separately.
Research Design
Identification
In this research, we aim to explore if the SEC’s XBRL mandate results in any impact on data quality of adopting firms’ HTML-formatted financial reports which are still widely used by investors and analysts in practice. Since we focus on the human-readable financial reports, we retain plain text in the HTML-formatted financial reports by removing page headers and footers. Tables that are mainly numeric values are also excluded for text analysis. Because annual reports (10-K) have to be audited but quarterly reports (10-Q) are not, annual reports (10-Ks) are considered more reliable and will be analyzed in this research. Also, we focus on examining the impact of the first-year XBRL adoption because it provides the cleanest setting to identify the causal effect.
Given the mandate of XBRL adoption and the SEC’s phase-in approach, we use a difference-in-differences (DID) design by leveraging the exogenous timing differences of Tier-1 and Tier-2 firms in adopting XBRL: Tier-1 firms started adopting XBRL in 2009, whereas Tier-2 firms started in 2010. In this quasi-experiment setting, Tier-1 firms are considered in the treatment group and Tier-2 firms in the control group. The DID design allows us to identify the causal effect of XBRL adoption on the quality of HTML-formatted financial reports. This is accomplished by estimating the difference in the change of the quality of HTML-formatted reports from the years before to those after the XBRL adoption between Tier-1 and Tier-2 firms (Angrist and Pischke 2008). Note that although Tier-2 firms are smaller than Tier-1 firms in terms of public float, the DID design explicitly eliminates the effect of the difference by assuming such effect remains stable before and after the XBRL adoption. This is known as the “parallel trend” assumption under which the estimated treatment effect can be considered to be causal and unbiased (Angrist and Pischke 2008). We show evidence supporting this assumption in a later section.
According to the DID design, we use Equation (1) as the econometric model to estimate the effect of Tier-1 firms’ XBRL adoption on the corresponding outcome variables.
DVi,t = α0 + α1 Posti,t + β Posti,t×Tier1i+ ѲXi,t + ηi + νt+εi,t (1)
In Equation (1), t denotes the index of the year periods before and after the XBRL adoption. i indexes a firm in either Tier 1 or Tier 2. DVi,tis one of the outcome variables that include metrics of spelling errors
and readability. Tier1i equals to 1 if firm i is a Tier-1 firm in the treatment group, and otherwise 0 if it is a
Tier-2 firm in the control group. Posti,t equals to 1 if year t is 2009 when Tier-1 firms started adopting
XBRL or thereafter, and otherwise 0 if year t is before the XBRL adoption. ηi is the set of fixed-effect
dummy variables, each of which corresponds to a firm and controls for any time-invariant heterogeneity of firm characteristics. Because Equation (1) includes ηi, the indicator variable for whether firm i is in Tier
1 or Tier 2 (i.e., Tier1i) is absorbed in the estimation. νt is the fixed-effect dummy variable for each year,
controlling for any common time shocks. Xi,t is a list of time-varying control variables (e.g., total assets,
market value). As suggested by (Blankespoor et al. 2014), we use contemporary time-varying variables as controls, because their values are realized at the end of a fiscal year before the firms produce the HTML-formatted financial reports.1 In Equation (1), the main parameter of interest β estimates the effect of
Tier-1 firms’ XBRL adoption on the quality of their HTML-formatted financial reports.
Sample Construction
A key task of implementing the DID design in this research is to determine the sample of Tier-1 firms (treatment group) and Tier-2 firms (control group). Because there is no official list of firms and their tiers in terms of XBRL requirement, we identified Tier-1 and Tier-2 firms using observed XBRL filings and several criteria in line with the requirement of the SEC’s mandate. To facilitate sample construction, we collected the XBRL- and HTML-formatted financial reports (10-Ks) of all public firms who submitted
1 Results from using one-year lagged time-varying variables (that is, X
their 10-Ks between the second quarter of 2006 (2006Q2) and the third quarter of 2013 (2013Q3). This time span allows for sufficient pre- and post-XBRL adoption periods for both Tier-1 and Tier-2 firms. We found 450 firms that had filed XBRL-formatted 10-Ks for the fiscal period of June 15, 2009 to June 14, 2010. To avoid self-selection bias, we removed firms that chose to submit XBRL-formatted filings voluntarily for the previous period (June 15 2008 to June 14, 2009). Accordingly, 441 firms remained in the sample of Tier-1 firms. We further removed the firms that did not meet the requirement of the SEC’s mandate. Specifically, the SEC’s XBRL filing guidance requires that each filing must contain public float, filer category, and an indicator of whether the XBRL filing is voluntary. However, we found that public float is missing and the voluntary filing indicator is unreliable in numerous filings. Thus, we relied on multiple data sources to identify the firms that did not meet the requirement. First, we removed the firms with a filing status not being “Large Accelerated Filer”. Second, we removed the firms that were voluntary filers of XBRL in 2009. Lastly, we examined each remaining firm and checked if its public float in 2009 was over $5B2. According to the SEC’s requirement, we removed the firms with a public float below $5B.
After removing firms using these three criteria, 367 firms remained in the sample of Tier-1 firms.
For Tier-2 firms, we found 1,374 firms who filed XBRL 10-Ks for the period of June 15, 2010 to June 14, 2011. We retained 873 in the sample of Tier-2 firms by first removing all firms who filed XBRL for the two prior periods and then removing firms that were not in the “Large Accelerated Filer” category. In sum, our data set contains 367 Tier-1 firms in the treatment group and 873 Tier-2 firms in the control group.
Dependent Variables
Spelling Errors
Spelling and typographical errors are a commonly used metric for measuring the quality of freeform texts and the literature documents that they have a significant impact on public firms and investors (Miller 2010). We detect word tokens (those that are not a number, email, URL, acronym, prefix when dash is used, or common company types) and check their spelling using GNU Aspell, an open source spell checker. Any word token not recognized by the spell checker is considered to be a spelling error. We are aware that certain product names, trademarks, and person names are not recognized by the spell checker. Unless popularly known, their presence tends to cause cognition burden to the reader. Thus, albeit not perfect, the metric is a reasonable indicator for the quality of textual data.
Because the length of firms’ financial reports varies, a larger number of spelling errors in a financial report do not necessarily suggest a lower data quality. Thus, we also measure spelling error rate as the number of spelling errors per sentence, normalizing the total number of spelling errors by the length of financial reports.
Readability
The Fog index is a widely accepted metric of annual report readability in the literature (Li 2008; Miller 2010). Therefore, in this research we use the Fog index to measure the readability (complexity) of HTML-formatted financial reports; alternative metrics of readability will be used in the robustness checks, including the Kincaid index and the Flesch Reading Ease index. Assuming that more syllables per word or more words per sentence make a document harder to read, the Fog index measures text complexity as a function of syllables per word and words per sentence:
Fog = 0.4×(average number of words per sentence + percent complex words),
where complex words are those with three syllables or more. The index indicates the number of years of formal education a reader would need to understand the text after reading it once. The range of the index value and the corresponding readability are: >=18, “unreadable”; 14–18, “difficult”; 12–14, “ideal; 10–12, “acceptable”; 8–10 “childish”. Therefore, a higher Fog index indicates that the text is more complex and harder to read.
Preliminary Results
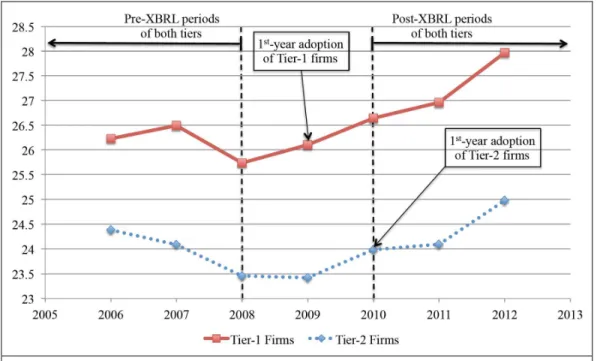
We first conduct descriptive analysis. Figure 1 plots the average of the number of spelling errors per sentence of Tier-1 and Tier-2 firms over the years; the solid line is for Tier-1 firms and the dashed line is for Tier-2 firms. Recall that Tier-1 firms started adopting XBRL in 2009 and Tier-2 firms started in 2010. Figure 1 shows that in the pre-XBRL periods of both tiers (from 2006 to 2008), the trends of both are declining and in parallel to a large extent, providing supportive evidence for the “parallel trend” assumption required for a valid DID design (Angrist and Pischke 2008). Besides that, in the post-XBRL periods of both tiers (from 2010 to 2012), the trends of both are increasing and also in parallel, again supporting the “parallel trend” assumption. Thus, the parallel trends in both pre- and post-XBRL periods suggest that the DID design in this research is likely valid.
Notably, the number of spelling errors per sentence of Tier-1 firms in 2009 (the 1st-year XBRL adoption of
Tier-1 firms) increases comparing to that in the previous year 2008, whereas the number of spelling errors per sentence of Tier-2 firms in 2009 continues to decline as before. The difference in the trends reveals that the number of spelling errors per sentence of Tier-1 firms on average is likely to increase, comparing to Tier-2 firms. Similarly, the number of spelling errors per sentence of Tier-2 firms in 2010 (the 1st-year XBRL adoption of Tier-2 firms) also increases after Tier-2 firms started adopting XBRL.
Therefore, Figure 1 shows the graphical evidence that XBRL adoption increases spelling error rate (as measured by number of spelling errors per sentence) in HTML-formatted financial reports of the adopting firms. Patterns of other outcome variables are qualitatively similar to that illustrated in Figure 1.
Figure 1. Number of spelling errors per sentence of Tier-1 and Tier-2 firms
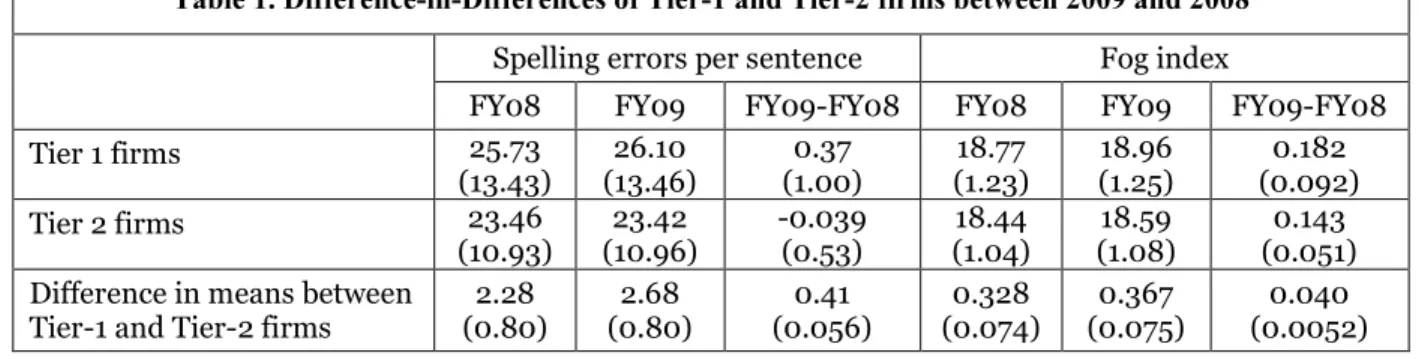
Besides the graphical evidence, Table 1 presents the difference in differences of Tier-1 and Tier-2 firms between 2009 and 2008 in terms of spelling error rate and Fog index. The left panel of Table 1 reports that the number of spelling errors per sentence of Tier-1 firms on average increases by 0.37 percent from 2008 to 2009 when Tier-1 firms started adopting XBRL. Meanwhile, the number of spelling errors per sentence of Tier-2 firms, on average, decreases by 0.039 percent from 2008 to 2009. The difference in differences of Tier-1 and Tier-2 firms is 0.41 percent and statistically different from zero (s.e.=0.056, t-statistic=7.32, p<0.01), suggesting that the number of spelling errors per sentence of Tier-1 firms increases as a consequence of the XBRL adoption. The results in the right panel of Table 1 are similar to that in the left panel. While the Fog index of both Tier-1 and Tier-2 firms increases from 2008 to 2009, the increase of Tier-1 firms is larger than that of Tier-2 firms (0.182 vs. 0.143). The difference in differences of Fog index between Tier-1 and Tier-2 firms is 0.040 points and statistically different from
zero (s.e.=0.0052, t-statistic=7.69, p<0.01), suggesting that the Fog index of HTML-formatted financial reports of Tier-1 firms increases as a consequence of the XBRL adoption. Because a higher Fog index indicates a higher complexity and lower readability of the texts, the right panel of Table 1 suggests that the HTML-formatted financial reports of Tier-1 firms are harder to read after they started adopting XBRL. These results are confirmed with the estimations of β in Equation (1), which are 0.715 (p<0.10) and 0.122 (p<0.01) for spelling errors and Fog index. Additional analyses, not reported here due to page limit, show that the effects are more pronounced for firm with more quantitative disclosure.
Table 1. Difference-in-Differences of Tier-1 and Tier-2 firms between 2009 and 2008
Spelling errors per sentence Fog index
FY08 FY09 FY09-FY08 FY08 FY09 FY09-FY08 Tier 1 firms 25.73 (13.43) 26.10 (13.46) 0.37 (1.00) 18.77 (1.23) 18.96 (1.25) 0.182 (0.092) Tier 2 firms 23.46 (10.93) 23.42 (10.96) -0.039 (0.53) 18.44 (1.04) 18.59 (1.08) 0.143 (0.051) Difference in means between
Tier-1 and Tier-2 firms
2.28 (0.80) 2.68 (0.80) 0.41 (0.056) 0.328 (0.074) 0.367 (0.075) 0.040 (0.0052)
Conclusion
The statistical results from the DID estimation confirm that as a consequence of the SEC’s mandatory XBRL adoption, an average HTML-formatted financial report of the adopting firms has more spelling errors both by total count and by per-sentence error. The results also show that the readability of the HTML-formatted financial reports as measured by the Fog index on average increases by 10% of standard deviation, suggesting that the human-readable financial reports filed in the post-XBRL years are more complex and harder to read.
Additional analysis reveals that the XBRP adoption does not increase the total amount of information disclosure in the financial reports or cause firms to put more efforts (or resources) on the fillings. Because XBRL is mainly used to tag numeric values, the adopting firms have paid more attention on disclosing quantitative information and perhaps put fewer resources on preparing qualitative information in the filings. This may contribute to the degraded quality of the HTML-formatted financial reports.
The findings that the SEC’s mandatory XBRL adoption has caused quality degradation of adopting firms’ HTML-formatted financial reports are certainly unintended and contradict the SEC’s 1998 plain English regulation (US Securities Exchange Commission 1998) which aimed to make the disclosure of financial information less complex and more readable. Human-readable financial reports continue to be a major information source for market participants. It is prudent for the SEC to stress the importance of producing high-quality HTML-formatted financial reports. Our results also suggest that firms may have treated XBRL filings as an additional step in financial reporting as opposed to an integral part of their reporting practice. We anticipate that the undesirable effects of XBRL adoption will be mitigated if firms take the XBRL adoption as an opportunity to streamline their financial reporting and data produce process. Better technology to facilitate the integration of XBRL into financial reporting process will also help firms to produce high-quality financial reports in any format. Future research will investigate the effects of these mitigating measures.
Acknowledgements
We are grateful for the funding support from Investissements d'Avenir (ANR-11-IDEX-0003 / Labex Ecodec / ANR-11-LABX-0047) and HEC Paris.
References
Angrist, J. D., and Pischke, J.-S. 2008. Mostly Harmless Econometrics: An Empiricist's Companion. Princeton university press.
Ballou, D., Wang, R., Pazer, H., and Tayi, G. K. 1998. "Modeling Information Manufacturing Systems to Determine Information Product Quality," Management Science (44:4), pp. 462-484.
Blankespoor, E., Miller, B. P., and White, H. D. 2014. "Initial Evidence on the Market Impact of the XBRL Mandate," Review of Accounting Studies (19:4), pp. 1468-1503.
Blankespoor, E. A. 2014. "The Impact of Investor Information Processing Costs on Firm Disclosure Choice: Evidence from the XBRL Mandate." The University of Michigan (working paper).
Boritz, J. E., and No, W. G. 2008. "The Sec's XBRL Voluntary Filing Program on Edgar: A Case for Quality Assurance," Current Issues in Auditing (2:2), pp. A36-A50.
Boritz, J. E., and No, W. G. 2013. "The Quality of Interactive Data: XBRL Versus Compustat, Yahoo Finance, and Google Finance," Available at SSRN 2253638).
Chychyla, R., and Kogan, A. 2015. "Using XBRL to Conduct a Large-Scale Study of Discrepancies between the Accounting Numbers in Compustat and Sec 10-K Filings," Journal of Information Systems
(29:1), pp. 37-72.
Debreceny, R., Farewell, S., Piechocki, M., Felden, C., and Gräning, A. 2010. "Does It Add Up? Early Evidence on the Data Quality of XBRL Filings to the Sec," Journal of Accounting and Public Policy (29:3), pp. 296-306.
Du, H., Vasarhelyi, M. A., and Zheng, X. 2013. "XBRL Mandate: Thousands of Filing Errors and So What?," Journal of Information Systems (27:1), pp. 61-78.
Kim, J. W., Lim, J.-H., and No, W. G. 2012. "The Effect of First Wave Mandatory XBRL Reporting across the Financial Information Environment," Journal of Information Systems (26:1), pp. 127-153. Li, F. 2008. "Annual Report Readability, Current Earnings, and Earnings Persistence," Journal of
Accounting and Economics (45:2), pp. 221-247.
Li, S., and Nwaeze, E. T. 2014. "The Association between Extensions in XBRL Disclosures and Financial Information Environment," Journal of Information Systems (forthcoming).
Liu, C. 2013. "XBRL: A New Global Paradigm for Business Financial Reporting," Journal of Global Information Management (JGIM) (21:3), pp. 60-80.
Liu, C., Wang, T., and Yao, L. J. 2014. "Xbrl’s Impact on Analyst Forecast Behavior: An Empirical Study,"
Journal of Accounting and Public Policy (33:1), pp. 69-82.
Madnick, S. E., Wang, R. Y., Lee, Y. W., and Zhu, H. 2009. "Overview and Framework for Data and Information Quality Research," Journal of Data and Information Quality (1:1), p. 2.
Miller, B. P. 2010. "The Effects of Reporting Complexity on Small and Large Investor Trading," The Accounting Review (85:6), pp. 2107-2143.
Perdana, A., Robb, A., and Rohde, F. 2015. "An Integrative Review and Synthesis of XBRL Research in Academic Journals," Journal of Information Systems (29:1), pp. 115-153.
Stocken, P. C., and Verrecchia, R. E. 2004. "Financial Reporting System Choice and Disclosure Management," The Accounting Review (79:4), pp. 1181-1203.
Subramanian, R., Insley, R. G., and Blackwell, R. D. 1993. "Performance and Readability: A Comparison of Annual Reports of Profitable and Unprofitable Corporations," Journal of Business Communication (30:1), pp. 49-61.
US Securities Exchange Commission. 1998. "A Plain English Handbook: How to Create Clear Sec Disclosure Documents," DIANE Publishing. Retrieved July (2), p. 2012.
Wang, R. Y. 1998. "A Product Perspective on Total Data Quality Management," Communications of the ACM (41:2), pp. 58-65.
Wang, R. Y., and Strong, D. M. 1996. "Beyond Accuracy: What Data Quality Means to Data Consumers,"
Journal of Management Information Systems (12:4), pp. 5-33.
Xu, S. X., and Zhang, X. M. 2013. "Impact of Wikipedia on Market Information Environment: Evidence on Management Disclosure and Investor Reaction," MIS Quarterly (37:4), pp. 1043-1068.
Yoon, H., Zo, H., and Ciganek, A. P. 2011. "Does XBRL Adoption Reduce Information Asymmetry?,"
Journal of Business Research (64:2), pp. 157-163.
Zhu, H., and Wu, H. 2011a. "Interoperability of XBRL Financial Statements in the U.S," International Journal of E-Business Research (7:2), pp. 19-33.
Zhu, H., and Wu, H. 2011b. "Quality of Data Standards: Framework and Illustration Using XBRL Taxonomy and Instances," Electronic Markets (21:2), pp. 129-139.
Zhu, H., and Wu, H. 2014. "Assessing the Quality of Large-Scale Data Standards: A Case of XBRL GAAP Taxonomy," Decision Support Systems (59), pp. 351-360.