When and Why Your Code Starts to Smell Bad
Michele Tufano
∗, Fabio Palomba
†, Gabriele Bavota
‡, Rocco Oliveto
§,
Massimiliano Di Penta
‡, Andrea De Lucia
†, Denys Poshyvanyk
∗∗The College of William and Mary, Williamsburg, VA, USA -†University of Salerno, Fisciano (SA), Italy ‡University of Sannio, Benevento, Italy -§University of Molise, Pesche (IS), Italy
Abstract—In past and recent years, the issues related to man-aging technical debt received significant attention by researchers from both industry and academia. There are several factors that contribute to technical debt. One of these is represented by code bad smells, i.e., symptoms of poor design and implementation choices. While the repercussions of smells on code quality have been empirically assessed, there is still only anecdotal evidence on when and why bad smells are introduced. To fill this gap, we conducted a large empirical study over the change history of 200 open source projects from different software ecosystems and investigated when bad smells are introduced by developers, and the circumstances and reasons behind their introduction. Our study required the development of a strategy to identify smell-introducing commits, the mining of over 0.5M commits, and the manual analysis of 9,164 of them (i.e.,those identified as smell-introducing). Our findings mostly contradict common wisdom stating that smells are being introduced during evolutionary tasks. In the light of our results, we also call for the need to develop a new generation of recommendation systems aimed at properly planning smell refactoring activities.
I. INTRODUCTION
Technical debt is a metaphor introduced by Cunningham to indicate “not quite right code which we postpone making it right” [18]. The metaphor explains well the trade-offs between delivering the most appropriate but still immature product, in the shortest time possible [12], [18], [27], [31], [42]. While the repercussions of “technical debt” on software quality have been empirically proven, there is still a lack of empirical evidence related to how, when, and why various forms of technical debt occur in software projects [12]. This represents an obstacle for an effective and efficient management of technical debt.
Bad code smells (shortly “code smells” or “smells”), i.e., symptoms of poor design and implementation choices [20], represent one important factor contributing to technical debt, and possibly affecting the maintainability of a software system [27]. In the past and, most notably, in recent years, several studies investigated the relevance that code smells have for developers [36], [50], the extent to which code smells tend to remain in a software system for long periods of time [3], [15], [32], [40], as well as the side effects of code smells, such as increase in change- and fault-proneness [25], [26] or decrease of software understandability [1] and maintainability [43], [49], [48].
The research community has been also actively developing approaches and tools for detecting smells [11], [34], [37], [44], [33], and, whenever possible, triggering refactoring operations. Such tools rely on different types of analysis techniques, such as constraint-based reasoning over metric values [33], [34],
static code analysis [44], or analysis of software changes [37]. While these tools provide relatively accurate and complete identification of a wide variety of smells, most of them work by “taking a snapshot” of the system or by looking at recent changes, hence providing a snapshot-based recommendation to the developer. Hence, they do not consider the circumstances that could have caused the smell introduction. In order to better support developers in planning actions to improve design and source code quality, it is imperative to have a contextualized understanding of the circumstances under which particular smells occur.
However, to the best of our knowledge, there is no com-prehensive empirical investigation into when and why code smells are introduced in software projects. Common wisdom suggests that urgent maintenance activities and pressure to deliver features while prioritizing time-to-market over code quality are often the causes of such smells. Generally speak-ing, software evolution has always been considered as one of the reasons behind “software aging” [38] or “increasing complexity” [28][35][47]. Broadly speaking, smells can also manifest themselves not only in the source code but also in software lexicons [29], [4], and can even affect other types of artifacts, such as spreadsheets [22], [23] or test cases [9].
In this paper we fill the void in terms of our understanding of code smells, reporting the results of a large-scale empirical study conducted on the evolution history of 200 open source projects belonging to three software ecosystems, namely An-droid, Apache and Eclipse. The study aimed at investigating (i) when smells are introduced in software projects, and (ii) whythey are introduced,i.e.,under what circumstances smell introductions occur and who are the developers responsible for introducing smells. To address these research questions, we developed a metric-based methodology for analyzing the evolution of code entities in change histories of software projects to determine when code smells start manifesting themselves and whether this happens suddenly (i.e., because of a pressure to quickly introduce a change), or gradually (i.e.,because of medium-to-long range design decisions). We mined over 0.5M commits and we manually analyzed 9,164 of them classified as smell-introducing. We are unaware of any published technical debt, in general, and code smell study, in particular, of comparable size. The results achieved allowed us to report quantitative and qualitative evidence on when and why smells are introduced in software projects as well as implications of these results, often contradicting common wisdom.
TABLE I
CHARACTERISTICS OF ECOSYSTEMS UNDER ANALYSIS
Ecosystem #Proj. #Classes KLOC #Commits #Issues Mean StoryLength Story LengthMin-Max
Apache 100 4-5,052 1-1,031 207,997 3,486 6 1-15
Android 70 5-4,980 3-1,140 107,555 1,193 3 1-6
Eclipse 30 142-16,700 26-2,610 264,119 124 10 1-13
Overall 200 - - 579,671 4,803 6 1-15
II. STUDYDESIGN
The goal of the study is to analyze change history of software projects, with thepurposeof investigating when code smells are introduced by developers, and the circumstances and reasons behind smell appearances. More specifically, the study aims at addressing the following two research questions:
• RQ1: When are code smells introduced? This research
question aims at investigating to what extent the common wisdom suggesting that “code smells are introduced as a consequence of continuous maintenance and evolution activities” [20] applies. Specifically, we study “when” code smells are introduced in software systems, to under-stand whether smells are introduced as soon as a code en-tity is created, whether smells are suddenly introduced in the context of specific maintenance activities, or whether, instead, smells appear “gradually” during software evolu-tion. To this aim, we investigated the presence of possible trends in the history of code artifacts that characterize the introduction of specific types of smells.
• RQ2: Why are code smells introduced? The second
research question aims at empirically investigating un-der which circumstances developers are more prone to introducing code smells. We focus on factors that are indicated as possible causes for code smell introduction in the existing literature [20]: the commit goal (e.g., is the developer implementing a new feature or fixing a bug?), theproject status(e.g.,is the change performed in proximity to a major release deadline?), and thedeveloper status (e.g., is the developer a newcomer or a senior project member?).
A. Context Selection
The context of the study consists of the change history of 200 projects belonging to three software ecosystems, namely Android, Apache, and Eclipse. Table I reports for each of them (i) the number of projects analyzed, (ii) size ranges in terms of the number of classes and KLOC, (iii) the overall number of commits and issues analyzed, and (iv) the average, minimum, and maximum length of the projects’ story (in years) analyzed in each ecosystem. All the analyzed projects are hosted inGit repositories and have associated issue trackers. The Android ecosystem contains a random selection of 70 open source apps mined from the f-droid1forge. The Apache ecosystem consists of 100 Java projects randomly selected among those available2. Finally, the Eclipse ecosystem consists of 30 projects randomly mined from the list of GitHub repositories managed by the Eclipse Foundation3. The choice of the ecosystems to analyze
1https://f-droid.org/
2https://projects.apache.org/indexes/quick.html 3https://github.com/eclipse
is not random, but rather driven by the motivation to consider projects having (i) different sizes, e.g., Android apps are by their nature smaller than projects in Apache’s and Eclipse’s ecosystems, (ii) different architectures, e.g.,we have Android mobile apps, Apache libraries, and plug-in based architectures in Eclipse projects, and (iii) different development bases,e.g., Android apps are often developed by small teams whereas sev-eral Apache projects are carried out by dozens of developers [7]. Also, we limited our study to 200 projects since, as it will be shown later, the analysis we carried out is not only computationally expensive, but also requires manual analysis of thousands of data points. To sum up, we mined 579,671 commits and 4,803 issues.
We focus our study on the following types of smells: 1) Blob Class: a large class with different responsibilities
that monopolizes most of the system’s processing [13]. 2) Class Data Should be Private: a class exposing its
attributes, violating the information hiding principle [20]. 3) Complex Class: a class having a high cyclomatic
com-plexity [13].
4) Functional Decomposition: a class where inheritance and polymorphism are poorly used, declaring many private fields and implementing few methods [13].
5) Spaghetti Code: a class without structure that declares long methods without parameters [13].
While several other smells exist in literature [13], [20], we needed to limit our analysis to a subset due to computational constraints. However, we carefully kept a mix of smells related to complex/large code components (e.g.,Blob Class, Complex Class) as well as smells related to the lack of adoption of good Object-Oriented coding practices (e.g., Class Data Should be Private, Functional Decomposition). Thus, the smells consid-ered are representative of categories of smells investigated in previous studies (see Section V).
B. Data Extraction and Analysis
This subsection describes the data extraction and analysis process that we followed to answer our research questions.
1) When are code smells introduced?: To answerRQ1 we
firstly cloned the 200 Git repositories. Then, we analyzed each repository ri using a tool that we developed (named
as HistoryMiner), with the purpose of identifying smell-introducing commits. Our tool mines the entire change history ofri, checks out each commit in chronological order, and runs
an implementation of theDECORsmell detector based on the original rules defined by Mohaet al. [34].DECORidentifies smells using detection rules based on the values of internal quality metrics4. The choice of usingDECORwas driven by the fact that (i) it is a state-of-the-art smell detector having a high accuracy in detecting smells [34]; and (ii) it applies simple detection rules that allow it to be very efficient. Note that we ranDECOR on all source code files contained in ri
only for the first commit of ri. In the subsequent commits
4An example of detection rule exploited to identify Blob classes can be found at http://tinyurl.com/paf9gp6.
TABLE II
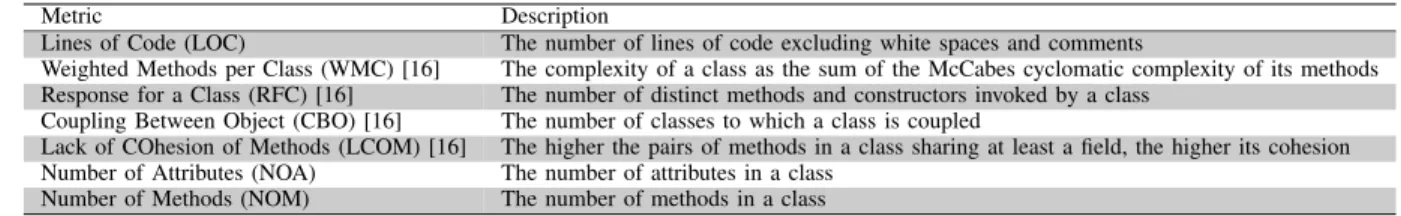
QUALITY METRICS MEASURED IN THE CONTEXT OFRQ1
Metric Description
Lines of Code (LOC) The number of lines of code excluding white spaces and comments
Weighted Methods per Class (WMC) [16] The complexity of a class as the sum of the McCabes cyclomatic complexity of its methods Response for a Class (RFC) [16] The number of distinct methods and constructors invoked by a class
Coupling Between Object (CBO) [16] The number of classes to which a class is coupled
Lack of COhesion of Methods (LCOM) [16] The higher the pairs of methods in a class sharing at least a field, the higher its cohesion Number of Attributes (NOA) The number of attributes in a class
Number of Methods (NOM) The number of methods in a class
DECOR has been executed only on code files added and modified in each specific commit to save computational time. As an output, our tool produces, for each source code file
fj ∈ ri the list of commits in which fj has been involved,
specifying if fj has been added, deleted, or modified and if
fj was affected, in that specific commit, by one of the five
considered smells.
Starting from the data generated by the HistoryMiner we compute, for each type of smell (smellk) and for each
source code file (fj), the number of commits performed on
fj since the first commit involving fj and adding the file to
the repository, up to the commit in which DECOR detects that fj as affected bysmellk. Clearly, such numbers are only
computed for files identified as affected by the specificsmellk.
When analyzing the number of commits needed for a smell to affect a code component, we can fall into two possible scenarios. In the first scenario (the least expected according to the “software aging” theory [38]) smell instances are introduced during the creation of source code artifacts, i.e., in the first commit involving a source code file. In the second scenario, smell instances are introduced after several commits and, thus as result of multiple maintenance activities. For the latter scenario, besides running the DECOR smell detector for the project snapshot related to each commit, the HistoryMiner also computes, for each snapshot and for each source code artifact, a set of quality metrics (see Table II). As done forDECOR, quality metrics are computed for all code artifacts only during the first commit, and updated at each subsequent commit for added and modified files. The purpose of this analysis is to understand whether the trend followed by such metrics differ between files affected by a specific type of smell and files not affected by such a smell. For example, we expect that classes becoming Blobs will exhibit a higher growth rate than classes that are not going to become Blobs.
In order to analyze the evolution of the quality metrics, we needed to identify the function that best approximates the data distribution, i.e., the values of the considered metrics computed in a sequence of commits. We found that the best model is the linear function (more details are available in our technical report [45]). Having identified the model to be used, we computed, for each file fj ∈ ri, the regression
line of its quality metric values. If file fj is affected by a
specific smellk, we compute the regression line considering
the quality metric values computed for each commit involving
fj from the first commit (i.e., where the file was added to
the versioning system) to the commit where the instance of
smellk was detected in fj. Instead, if fj is not affected by
any smell, we considered only the firstnthcommits involving
the file fj, where n is the average number of commits
required by smellk to affect code instances. Then, for each
metric reported in Table II, we compared the distributions of regression line slopes for cleanly and smelly files. The comparison is performed using a two-tailed Mann-Whitney U test [17]. The results are intended as statistically significant atα= 0.05. We also estimated the magnitude of the observed differences using the Cliff’s Delta (or d), a non-parametric effect size measure [21] for ordinal data. We followed the guidelines in [21] to interpret the effect size values: small for
d < 0.33 (positive as well as negative values), medium for 0.33≤d <0.474and large for d≥0.474.
Overall, the data extraction for RQ1 (i.e., the smells
de-tection and metric computation at each commit for the 200 systems) took eight weeks on a Linux server having 7 quad-core 2.67 GHz CPU (28 quad-cores) and 24 Gb of RAM.
2) Why are code smells introduced?: One challenge arising when answeringRQ2is represented by the identification of the
specific commit (or also possibly a set of commits) where the smell has been introduced (from now on referred to as a smell-introducing commit). Such information is crucial to explain under which circumstances these commits were performed. A trivial solution would have been to use the results of ourRQ1
and consider the commitcsin which DECORdetects for the
first time a smell instancesmellk in a source code filefj as a
commit-introducing smell infj. However, while this solution
would work for smell instances that are introduced in the first commit involving fj (there is no doubt on the commit that
introduced the smell), it would not work for smell instances that are the consequence of several changes, performed in n
different commits involvingfj. In such a circumstance, on one
hand, we cannot simply assume that the first commit in which DECORidentifies the smell is the one introducing that smell, because the smell appearance might be the result of several small changes performed across thencommits. On the other hand, we cannot assume that all ncommits performed on fj
are those (gradually) introducing the smell, since just some of them might have pushedfj toward a smelly direction. Thus,
to identify the smell-introducing commits for a filefj affected
by an instance of a specific smell (smellk), we designed the
following heuristic:
• if smellk has been introduced in the commit c1 where
fj has been added to the repository,thenc1is the
smell-introducing commit;
• else given C = {c1, c2, . . . , cn} the set of commits
TABLE III
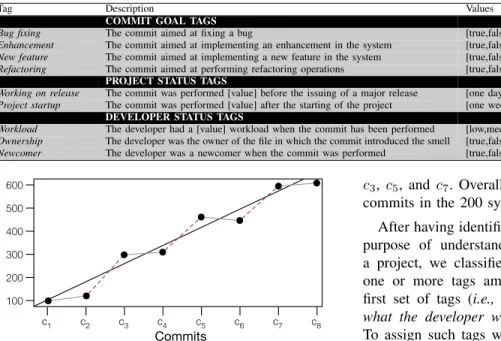
TAGS ASSIGNED TO THE SMELL-INTRODUCING COMMITS
Tag Description Values
COMMIT GOAL TAGS
Bug fixing The commit aimed at fixing a bug [true,false]
Enhancement The commit aimed at implementing an enhancement in the system [true,false]
New feature The commit aimed at implementing a new feature in the system [true,false]
Refactoring The commit aimed at performing refactoring operations [true,false]
PROJECT STATUS TAGS
Working on release The commit was performed [value] before the issuing of a major release [one day, one week, one month, more than one month]
Project startup The commit was performed [value] after the starting of the project [one week, one month, one year, more than one year]
DEVELOPER STATUS TAGS
Workload The developer had a [value] workload when the commit has been performed [low,medium,high]
Ownership The developer was the owner of the file in which the commit introduced the smell [true,false]
Newcomer The developer was a newcomer when the commit was performed [true,false]
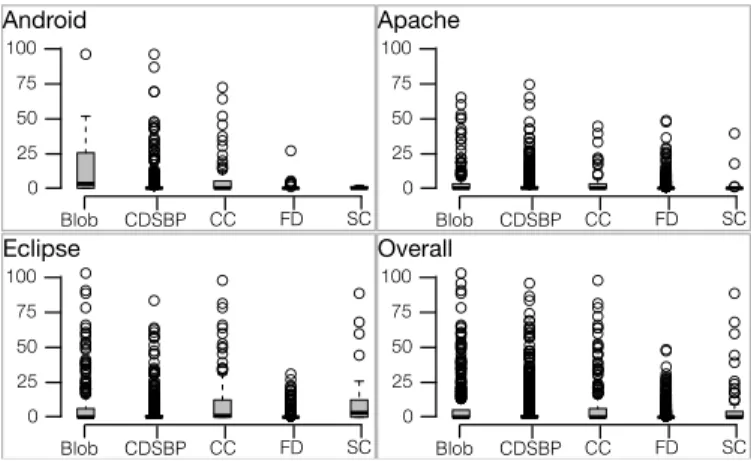
100 200 300 400 500 600 c1 c2 c3 c4 c5 c6 c7 c8 LOC Commits
Fig. 1. Example of smell-introducing commit identification.
cn we use the results ofRQ1 to select the set of quality
metrics M allowing to discriminate between the groups of files that are affected and not affected in their history by smellk. These metrics are those for which we found
statistically significant difference between the slope of the regression lines for the two groups of files accompanied by at least a medium effect size. Let s be the slope of the regression line for the metric m ∈ M built when considering all commits leading fj to become affected
by a smell and si the slope of the regression line for
the metricmbuilt when considering just two subsequent commits,i.e.,ci−1andcifor eachi∈[2, ..., n]. A commit
ci ∈ C is considered as a smell-introducing commit if
|si|>|s|,i.e.,the commit ci significantly contributes to
the increment (or decrement) of the metricm.
Fig. 1 reports an example aimed at illustrating the smell-introducing commit identification for a file fj. Suppose that
fj has been involved in eight commits (from c1 toc8), and
that in c8 a Blob instance has been identified by DECORin
fj. Also, suppose that the results of our RQ1 showed that
the LOC metric is the only one “characterizing” the Blob introduction, i.e., the slope of the LOC regression line for Blobs is significantly different than the one of the regression line built for classes which are not affected by the Blob smell. The black line in Fig. 1 represents the LOC regression line computed among all the involved commits, having a slope of 1.3. The gray lines represent the regression lines between pairs of commits (ci−1, ci) whereciis not classified as a
smell-introducing commit (their slope is lower than 1.3). Finally, the red-dashed lines represent the regression lines between pairs of commits (ci−1, ci) whereciis classified as a smell-introducing
commit (their slope is higher than 1.3). Thus, the smell-introducing commits in the example depicted in Fig. 1 are:
c3, c5, and c7. Overall, we obtained 9,164 smell-introducing
commits in the 200 systems, that we used to answerRQ2.
After having identified smell-introducing commits, with the purpose of understanding why a smell was introduced in a project, we classified them by assigning to each commit one or more tags among those reported in Table III. The first set of tags (i.e., commit goal tags) aims at explaining what the developer was doing when introducing the smell. To assign such tags we firstly downloaded the issues for all 200 projects from their JIRA or BUGZILLA issue trackers. Then, we checked whether any of the 9,164 smell-introducing commits were related to any of the collected issues. To link issues to commits we used (and complemented) two existing approaches. The first one is the regular expression-based approach by Fischer et al.[19] matching the issue ID in the commit note. The second one is a re-implementation of the ReLinkapproach proposed by Wuet al.[46], which considers the following constraints: (i) matching the committer/authors with issue tracking contributor name/email; (ii) the time inter-val between the commit and the last comment posted by the same author/contributor on the issue tracker must be less than seven days; and (iii) Vector Space Model (VSM) [6] cosine similarity between the commit note and the last comment referred above greater than 0.7. RELINK has been shown to accurately link issues and commits (89% for precision and 78% for recall) [46]. When it was possible to identify a link between one of the smell-introducing commits and an issue, and the issue type was one of the goal-tags in our design (i.e., bug, enhancement, or new feature), such tag was automatically assigned to the commit and its correctness was double checked by one of the authors, which verified the correctness of the issue category (e.g.,that an issue classified as bug actually was a bug). This happens in 471 cases,i.e.,for a small percentage (5%) of the commits, which is not surprising and in agreement with previous findings [5]. In the remaining 8,693 cases, two of the authors manually analyzed the commits, assigning one or more of the goal-tags by relying on the analysis of the commit message and of the unix diff between the commit under analysis and its predecessor.
Concerning the project-status tags (see Table III), the Work-ing on release tag can assume as possible values one day, one week,one month, ormore than one monthbefore issuing of a major release. The aim of such a tag is to indicate whether,when introducing the smell, the developer was close
to a project’s deadline. We just consider major releases since those are the ones generally representing a real deadline for developers, while minor releases are sometimes issued just due to a single bug fix. To assign such tags, one of the authors identified the dates in which the major releases were issued by exploiting theGIT tags (often used to tag releases), and the commit messages left by developers. Concerning the Project startuptag, it can assume as valuesone week,one month,one year, ormore than one yearafter the project’s start date. This tag can be easily assigned by comparing the commit date with the date in which the project started (i.e.,the date of the first commit). This tag can be useful to verify whether during the project’s startup, when the project design might not be fully clear, developers are more prone to introducing smells. Note that theProject startuptag can be affected by the presence of projects migrated to gitand with a partially available history. For this reason we checked whether the first release tagged in the versioning system were either0.1or 1.0 (note that this might be an approximation since projects starting from 1.0 could have a previous 0.xhistory). As a result, we excluded from the Project startup analysis 31 projects, for a total of 552 smell-introducing commits.
Finally, we assigned developer-status tags to smell-introducing commits. TheWorkloadtag measures how busy a developer was when introducing the bad smell. In particular, we measured the Workload of each developer involved in a project using time windows of one month, starting from the date in which the developer joined the project (i.e.,performed the first commit). The Workload of a developer during one month is measured in terms of the number of commits she performed in that month. We are aware that such a measure (i) is approximated because different commits can require different amount of work; and (ii) a developer could also work on other projects. When analyzing a smell-introducing commit performed by a developerdduring a monthm, we computed the workload distribution for all developers of the project at
m. Then, givenQ1 andQ3, the first and the third quartile of
such distribution, respectively, we assigned: lowasWorkload tag if the developer performing the commit had a workload less than Q1, medium if Q1 ≤ workload < Q3, high if the
workload was higher than Q3.
The Ownershiptag is assigned if the developer performing the smell-introducing commit is the owner of the file on which the smell has been detected. As defined by Bird et al. [10], a file owner is a developer responsible for more than 75% of the commits performed on the file. Lastly, theNewcomer tag is assigned if the smell-introducing commit falls among the first 3 commits in the project for the developer performing it. After assigning all the described tags to each of the 9,164 smell-introducing commits, we analyzed the results by report-ing descriptive statistics of the number of commits to which each tag type had been assigned. Also, we discuss several qualitative examples helping to explain our findings.
● ● ● ● ● ● ● ● ● ● ● ● ● ● ● ● ● ● ● ● ● ● ● ● ● ● ● ● ● ● ● ● ● ● ● ● ● ● ● ● ● ● ● ● ● ● ● ● ● ● ● ● ● ● ● ● ● ● ● ● ● ● ● ● ● ● ● ● ● ● ● ● ● ● ● ● ● ● ● ● ● ● ● ● ● ● ● ● ● ● ● ● ● ● ● ● ● ● ● ● ● ● Blob Android 0 CDSBP CC FD SC 25 50 75 100 ● ● ● ● ● ● ● ● ● ● ● ● ● ● ● ● ● ● ● ● ● ● ● ● ● ● ● ● ● ● ● ● ● ● ● ● ● ● ● ● ● ● ● ● ● ● ● ● ● ● ● ● ● ● ● ● ● ● ● ● ● ● ● ● ● ● ● ● ● ● ● ● ● ● ● ● ● ● ● ● ● ● ● ● ● ● ● ● ● ● ● ● ● ● ● ● ● ● ● ● ● ● ● ● ● ● ● ● ● ● ● ● ● ● ● ● ● ● ● ● ● ● ● ● ● ● ● ● ● ● ● ● ● ● ● ● ● ● ● ● ● ● ● ● ● ● ● ● ● ● ● ● ● ● ● ● ● ● ● ● ● ● ● ● ● ● ● ● ● ● ● ● ● ● ● ● ● ● ● ● ● ● ● ● ● ● ● ● ● ● ● ● ● ● ● ● ● ● ● ● ● ● ● ● ● ● ● ● ● ● ● ● ● ● ● ● ● ● ● ● ● ● ● ● ● ● ● ● ● ● ● ● ● ● ● ● ● ● ● ● ● ● ● ● ● ● ● ● ● ● ● ● ● ● ● ● ● ● ● ● ● ● ● ● ● ● ● Blob Eclipse 0 CDSBP CC FD SC 25 50 75 100 ● ● ● ● ● ● ● ● ● ● ● ● ● ● ● ● ● ● ● ● ● ● ● ● ● ● ● ● ● ● ● ● ● ● ● ● ● ● ● ● ● ● ● ● ● ● ● ● ● ● ● ● ● ● ● ● ● ● ● ● ● ● ● ● ● ● ● ● ● ● ● ● ● ● ● ● ● ● ● ● ● ● ● ● ● ● ● ● ● ● ● ● ● ● ● ● ● ● ● ● ● ● ● ● ● ● ● ● ● ● ● ● ● ● ● ● ● ● ● ● ● ● ● ● ● ● ● ● ● ● ● ● ● ● ● ● ● ● ● ● ● ● ● ● ● ● ● ● ● ● ● ● ● ● ● ● ● ● ● ● ● ● ● ● ● ● ● ● ● ● ● ● ● ● ● ● ● ● ● ● ● ● ● ● ● ● ● ● ● ● ● ● ● ● ● ● ● ● ● ● ● ● ● ● ● ● ● ● ● ● ● ● ● ● ● ● ● ● ● ● ● ● ● ● ● ● ● ● ● ● ● ● ● ● ● ● ● ● ● ● ● ● ● ● ● ● ● ● ● ● ● ● ● ● ● ● ● ● ● ● ● ● ● ● ● ● ● ● ● ● ● ● ● ● ● ● ● ● ● ● ● ● ● ● ● ● ● ● ● ● ● ● ● ● ● ● ● ● ● ● ● ● ● ● ● ● ● ● ● ● ● ● Blob Apache 0 CDSBP CC FD SC 25 50 75 100 ● ● ● ● ● ● ● ● ● ● ● ● ● ● ● ● ● ● ● ● ● ● ● ● ● ● ● ● ● ● ● ● ● ● ● ● ● ● ● ● ● ● ● ● ● ● ● ● ● ● ● ● ● ● ● ● ● ● ● ● ● ● ● ● ● ● ● ● ● ● ● ● ● ● ● ● ● ● ● ● ● ● ● ● ● ● ● ● ● ● ● ● ● ● ● ● ● ● ● ● ● ● ● ● ● ● ● ● ● ● ● ● ● ● ● ● ● ● ● ● ● ● ● ● ● ● ● ● ● ● ● ● ● ● ● ● ● ● ● ● ● ● ● ● ● ● ● ● ● ● ● ● ● ● ● ● ● ● ● ● ● ● ● ● ● ● ● ● ● ● ● ● ● ● ● ● ● ● ● ● ● ● ● ● ● ● ● ● ● ● ● ● ● ● ● ● ● ● ● ● ● ● ● ● ● ● ● ● ● ● ● ● ● ● ● ● ● ● ● ● ● ● ● ● ● ● ● ● ● ● ● ● ● ● ● ● ● ● ● ● ● ● ● ● ● ● ● ● ● ● ● ● ● ● ● ● ● ● ● ● ● ● ● ● ● ● ● ● ● ● ● ● ● ● ● ● ● ● ● ● ● ● ● ● ● ● ● ● ● ● ● ● ● ● ● ● ● ● ● ● ● ● ● ● ● ● ● ● ● ● ● ● ● ● ● ● ● ● ● ● ● ● ● ● ● ● ● ● ● ● ● ● ● ● ● ● ● ● ● ● ● ● ● ● ● ● ● ● ● ● ● ● ● ● ● ● ● ● ● ● ● ● ● ● ● ● ● ● ● ● ● ● ● ● ● ● ● ● ● ● ● ● ● ● ● ● ● ● ● ● ● ● ● ● ● ● ● ● ● ● ● ● ● ● ● ● ● ● ● ● ● ● ● ● ● ● ● ● ● ● ● ● ● ● ● ● ● ● ● ● ● ● ● ● ● ● ● ● ● ● ● ● ● ● ● ● ● ● ● ● ● ● ● ● ● ● ● ● ● ● ● ● ● ● ● ● ● ● ● ● ● ● ● ● ● ● ● ● ● ● ● ● ● ● ● ● ● ● ● ● ● ● ● ● ● ● ● ● ● ● ● ● ● ● ● ● ● ● ● ● ● ● ● ● ● ● ● ● ● ● ● ● ● ● ● ● ● ● ● ● ● ● ● ● ● ● ● ● ● ● ● ● ● ● ● ● ● ● ● ● ● ● ● ● ● ● ● ● ● ● ● ● ● ● ● ● ● ● ● ● ● ● ● ● ● ● ● ● ● ● ● ● ● ● ● ● ● ● ● ● ● ● ● ● ● ● ● ● ● ● ● ● ● ● ● ● ● ● ● ● ● ● ● ● ● ● ● ● ● ● ● ● ● ● ● ● ● ● ● ● ● ● ● ● ● ● ● ● ● ● ● ● ● ● ● ● ● ● ● ● ● ● ● ● ● ● ● ● ● ● ● ● ● ● ● ● ● ● ● ● ● ● ● ● ● ● ● ● ● ● ● ● ● ● ● ● ● ● Blob Overall 0 CDSBP CC FD SC 25 50 75 100
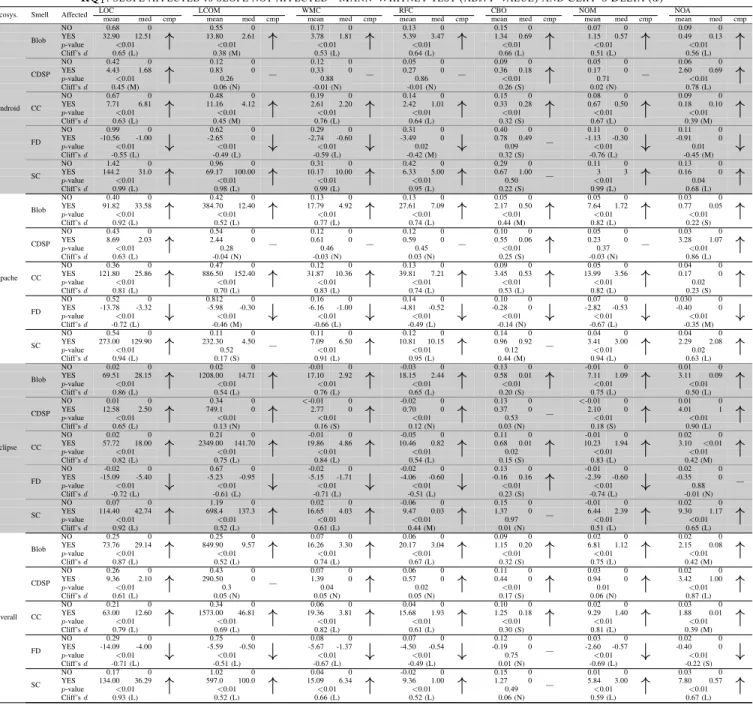
Fig. 2. Number of commits required by a smell to manifest itself.
III. ANALYSIS OF THERESULTS
This section reports the analysis of the results achieved aiming at answering our two research questions.
A. When are code smells introduced?
Fig. 2 shows the distribution of the number of commits required by each type of smell to manifest itself. The results are grouped by ecosystems; also, we report theOverallresults (all ecosystems together). As we can observe in Fig. 2, in almost all cases the median number of commits needed by a smell to affect code components is zero, except for Blob on Android (median=3) and Complex Class on Eclipse (median=1). In other words, most of the smell instances (at least half of them) are introduced when a code entity is added to the versioning system. This is quite a surprising finding, considering the common wisdom thatsmells are generally the result of continuous maintenance activities[20].
However, the analysis of the box plots also reveals (i) the presence of several outliers; and that (ii) for some smells, in particular Blob and Complex Class, the distribution is quite skewed. This means that besides smell instances introduced in the first commit, there are also several smell instances that are introduced as a result of several changes performed on the file during its evolution. In order to better understand such phenomenon, we analyzed how the values of some quality metrics change during the evolution of such files.
Table V presents the descriptive statistics (mean and me-dian) of the slope of the regression line computed, for each metric, for both smelly and clean files. Also, Table V reports the results of the Mann-Whitney test and Cliff’s d effect size (Large, Medium, orSmall) obtained when analyzing the difference between the slope of regression lines for clean and smelly files. Columncmpof Table V shows a↑(↓) if for the metric m there is a statistically significant difference in the
m’s slope between the two groups of files, with the smelly ones exhibiting a higher (lower) slope; a ”−” is shown when the difference is not statistically significant.
The analysis of the results reveals that for all the smells, but Functional Decomposition, the files affected by smells show a higher slope than clean files. This suggests that the files that will be affected by a smell exhibit a steeper growth in terms
TABLE IV
RQ1:SLOPE AFFECTEDvsSLOPE NOT AFFECTED- MANN-WHITNEY TEST(ADJ.P-VALUE)ANDCLIFF’SDELTA(d)
Ecosys. Smell Affected LOCmean med cmp LCOMmean med cmp WMCmean med cmp RFCmean med cmp CBOmean med cmp NOMmean med cmp NOAmean med cmp
NO 0.68 0 0.55 0 0.17 0 0.13 0 0.15 0 0.07 0 0.09 0 YES 32.90 12.51 13.80 2.61 3.78 1.81 5.39 3.47 1.34 0.69 1.15 0.57 0.49 0.13 p-value <0.01 <0.01 <0.01 <0.01 <0.01 <0.01 <0.01 Blob Cliff’sd 0.65 (L)
↑
0.38 (M)↑
0.53 (L)↑
0.64 (L)↑
0.66 (L)↑
0.51 (L)↑
0.56 (L)↑
NO 0.42 0 0.12 0 0.12 0 0.05 0 0.09 0 0.05 0 0.06 0 YES 4.43 1.68 0.83 0 0.33 0 0.27 0 0.36 0.18 0.17 0 2.60 0.69 p-value <0.01 0.26 0.88 0.86 <0.01 0.71 <0.01 CDSP Cliff’sd 0.45 (M)↑
0.06 (N) — -0.01 (N) — -0.01 (N) — 0.26 (S)↑
0.02 (N) — 0.78 (L)↑
NO 0.67 0 0.48 0 0.19 0 0.14 0 0.15 0 0.08 0 0.09 0 YES 7.71 6.81 11.16 4.12 2.61 2.20 2.42 1.01 0.33 0.28 0.67 0.50 0.18 0.10 p-value <0.01 <0.01 <0.01 <0.01 <0.01 <0.01 <0.01 CC Cliff’sd 0.63 (L)↑
0.45 (M)↑
0.76 (L)↑
0.64 (L)↑
0.32 (S)↑
0.67 (L)↑
0.39 (M)↑
NO 0.99 0 0.62 0 0.29 0 0.31 0 0.40 0 0.11 0 0.11 0 YES -10.56 -1.00 -2.65 0 -2.74 -0.60 -3.49 0 0.78 0.49 -1.13 -0.30 -0.91 0 p-value <0.01 <0.01 <0.01 0.02 0.09 <0.01 0.01 FD Cliff’sd -0.55 (L)↓
-0.49 (L)↓
-0.59 (L)↓
-0.42 (M)↓
0.32 (S) — -0.76 (L)↓
-0.45 (M)↓
NO 1.42 0 0.96 0 0.31 0 0.42 0 0.29 0 0.11 0 0.13 0 YES 144.2 31.0 69.17 100.00 10.17 10.00 6.33 5.00 0.67 1.00 3 3 0.16 0 p-value <0.01 <0.01 <0.01 <0.01 0.50 <0.01 0.04 Android SC Cliff’sd 0.99 (L)↑
0.98 (L)↑
0.99 (L)↑
0.95 (L)↑
0.22 (S) — 0.99 (L)↑
0.68 (L)↑
NO 0.40 0 0.42 0 0.13 0 0.13 0 0.05 0 0.05 0 0.03 0 YES 91.82 33.58 384.70 12.40 17.79 4.92 27.61 7.09 2.17 0.50 7.64 1.72 0.77 0.05 p-value <0.01 <0.01 <0.01 <0.01 <0.01 <0.01 <0.01 Blob Cliff’sd 0.92 (L)↑
0.52 (L)↑
0.77 (L)↑
0.74 (L)↑
0.44 (M)↑
0.82 (L)↑
0.22 (S)↑
NO 0.43 0 0.54 0 0.12 0 0.12 0 0.10 0 0.05 0 0.03 0 YES 8.69 2.03 2.44 0 0.61 0 0.59 0 0.55 0.06 0.23 0 3.28 1.07 p-value <0.01 0.28 0.46 0.45 <0.01 0.37 <0.01 CDSP Cliff’sd 0.63 (L)↑
-0.04 (N) — -0.03 (N) — 0.03 (N) — 0.25 (S)↑
-0.03 (N) — 0.86 (L)↑
NO 0.36 0 0.47 0 0.12 0 0.13 0 0.09 0 0.05 0 0.04 0 YES 121.80 25.86 886.50 152.40 31.87 10.36 39.81 7.21 3.45 0.53 13.99 3.56 0.17 0 p-value <0.01 <0.01 <0.01 <0.01 <0.01 <0.01 0.02 CC Cliff’sd 0.81 (L)↑
0.70 (L)↑
0.83 (L)↑
0.74 (L)↑
0.53 (L)↑
0.82 (L)↑
0.23 (S)↑
NO 0.52 0 0.812 0 0.16 0 0.14 0 0.10 0 0.07 0 0.030 0 YES -13.78 -3.32 -5.98 -0.30 -6.16 -1.00 -4.81 -0.52 -0.28 0 -2.82 -0.53 -0.40 0 p-value <0.01 <0.01 <0.01 <0.01 <0.01 <0.01 <0.01 FD Cliff’sd -0.72 (L)↓
-0.46 (M)↓
-0.66 (L)↓
-0.49 (L)↓
-0.14 (N)↓
-0.67 (L)↓
-0.35 (M)↓
NO 0.54 0 0.11 0 0.11 0 0.12 0 0.14 0 0.04 0 0.04 0 YES 273.00 129.90 232.30 4.50 7.09 6.50 10.81 10.15 0.96 0.92 3.41 3.00 2.29 2.08 p-value <0.01 0.52 <0.01 <0.01 0.12 <0.01 0.02 Apache SC Cliff’sd 0.94 (L)↑
0.17 (S) — 0.91 (L)↑
0.95 (L)↑
0.44 (M) — 0.94 (L)↑
0.63 (L)↑
NO 0.02 0 0.02 0 -0.01 0 -0.03 0 0.13 0 -0.01 0 0.01 0 YES 69.51 28.15 1208.00 14.71 17.10 2.92 18.15 2.44 0.58 0.01 7.11 1.09 3.11 0.09 p-value <0.01 <0.01 <0.01 <0.01 <0.01 <0.01 <0.01 Blob Cliff’sd 0.86 (L)↑
0.54 (L)↑
0.76 (L)↑
0.65 (L)↑
0.20 (S)↑
0.75 (L)↑
0.50 (L)↑
NO 0.01 0 0.34 0 <-0.01 0 -0.02 0 0.13 0 <-0.01 0 0.01 0 YES 12.58 2.50 749.1 0 2.77 0 0.70 0 0.37 0 2.10 0 4.01 1 p-value <0.01 <0.01 <0.01 <0.01 0.53 <0.01 <0.01 CDSP Cliff’sd 0.65 (L)↑
0.13 (N)↑
0.16 (S)↑
0.12 (N)↑
0.03 (N) — 0.18 (S)↑
0.90 (L)↑
NO 0.02 0 0.21 0 -0.01 0 -0.05 0 0.11 0 -0.01 0 0.02 0 YES 57.72 18.00 2349.00 141.70 19.86 4.86 10.46 0.82 0.68 0.01 10.23 1.94 3.10 <0.01 p-value <0.01 <0.01 <0.01 <0.01 0.02 <0.01 <0.01 CC Cliff’sd 0.82 (L)↑
0.75 (L)↑
0.84 (L)↑
0.54 (L)↑
0.15 (S)↑
0.83 (L)↑
0.42 (M)↑
NO -0.02 0 0.67 0 -0.02 0 -0.02 0 0.13 0 -0.01 0 0.02 0 YES -15.09 -5.40 -5.23 -0.95 -5.15 -1.71 -4.06 -0.60 -0.16 0.16 -2.39 -0.60 -0.35 0 p-value <0.01 <0.01 <0.01 <0.01 <0.01 <0.01 0.88 FD Cliff’sd -0.72 (L)↓
-0.61 (L)↓
-0.71 (L)↓
-0.51 (L)↓
0.23 (S)↑
-0.74 (L)↓
-0.01 (N) — NO 0.07 0 1.19 0 0.02 0 -0.06 0 0.15 0 -0.01 0 0.02 0 YES 114.40 42.74 698.4 137.3 16.65 4.03 9.47 0.03 1.37 0 6.44 2.39 9.30 1.17 p-value <0.01 <0.01 <0.01 <0.01 0.97 <0.01 <0.01 Eclipse SC Cliff’sd 0.92 (L)↑
0.52 (L)↑
0.61 (L)↑
0.44 (M)↑
0.01 (N) — 0.51 (L)↑
0.65 (L)↑
NO 0.25 0 0.25 0 0.07 0 0.06 0 0.09 0 0.02 0 0.02 0 YES 73.76 29.14 849.90 9.57 16.26 3.30 20.17 3.04 1.15 0.20 6.81 1.12 2.15 0.08 p-value <0.01 <0.01 <0.01 <0.01 <0.01 <0.01 <0.01 Blob Cliff’sd 0.87 (L)↑
0.52 (L)↑
0.74 (L)↑
0.67 (L)↑
0.32 (S)↑
0.75 (L)↑
0.42 (M)↑
NO 0.26 0 0.43 0 0.07 0 0.06 0 0.11 0 0.03 0 0.02 0 YES 9.36 2.10 290.50 0 1.39 0 0.57 0 0.44 0 0.94 0 3.42 1.00 p-value <0.01 0.3 0.04 0.02 <0.01 0.01 <0.01 CDSP Cliff’sd 0.61 (L)↑
0.05 (N) — 0.05 (N)↑
0.05 (N)↑
0.17 (S)↑
0.06 (N)↑
0.87 (L)↑
NO 0.21 0 0.34 0 0.06 0 0.04 0 0.10 0 0.02 0 0.03 0 YES 63.00 12.60 1573.00 46.81 19.36 3.81 15.68 1.93 1.25 0.18 9.29 1.40 1.88 0.01 p-value <0.01 <0.01 <0.01 <0.01 <0.01 <0.01 <0.01 CC Cliff’sd 0.79 (L)↑
0.69 (L)↑
0.82 (L)↑
0.61 (L)↑
0.30 (S)↑
0.81 (L)↑
0.39 (M)↑
NO 0.29 0 0.75 0 0.08 0 0.07 0 0.12 0 0.03 0 0.02 0 YES -14.09 -4.00 -5.59 -0.50 -5.67 -1.37 -4.50 -0.54 -0.19 0 -2.60 -0.57 -0.40 0 p-value <0.01 <0.01 <0.01 <0.01 0.75 <0.01 <0.01 FD Cliff’sd -0.71 (L)↓
-0.51 (L)↓
-0.67 (L)↓
-0.49 (L)↓
0.01 (N) — -0.69 (L)↓
-0.22 (S)↓
NO 0.17 0 1.02 0 0.04 0 -0.02 0 0.15 0 0.01 0 0.03 0 YES 134.00 36.29 597.0 100.0 15.09 6.34 9.36 1.00 1.27 0 5.84 3.00 7.80 0.57 p-value <0.01 <0.01 <0.01 <0.01 0.49 <0.01 <0.01 Overall SC Cliff’sd 0.93 (L)↑
0.52 (L)↑
0.66 (L)↑
0.52 (L)↑
0.06 (N) — 0.59 (L)↑
0.67 (L)↑
of metric values than files that are not becoming smelly. In other words, when a smell is going to appear, its symptoms (metric value increases) occur very fast, and not gradually. For example, considering the Apache ecosystem, we can see a clear difference between the growth of LOC in Blob and clean classes. Indeed, this latter have a mean growth in terms of LOC characterized by a slope of 0.40, while the slope for Blobs is, on average, 91.82. To make clear the interpretation of such data, let us suppose we plot both regression lines on the Cartesian plane. The regression line for Blobs will have an inclination of 89.38◦, indicating an abrupt growth of LOC, while the inclination of the regression line for clean classes will be 21.8◦, indicating less steep increase of LOC. The same happens when considering the LCOM cohesion metric
(the higher the LCOM, the lower the class cohesion). For the overall dataset, the slope for classes that will become Blobs is 849.90 as compared to the 0.25 of clean classes. Thus, while the cohesion of classes generally decreases over time, classes destined to become Blobs exhibit cohesion metric loss orders of magnitude faster than clean classes. In general, the results in Table V show strong differences in the metrics’ slope between clean and smelly files, indicating that it could be possible to create recommenders warning developers when the changes performed on a specific code component show a dangerous trend that could lead to the introduction of a bad smell.
The Functional Decomposition (FD) smell deserves a sep-arate discussion. As we can see in Table V, the slope of the regression line for files affected by such a smell is negative.
This means that during the evolution of files affected by Functional Decomposition we can observe a decrement (rather than an increment) of the metric values. The rationale behind such a result is intrinsic in the definition of this smell. Specif-ically, one of the symptoms of such a smell is represented by a class with a single action, such as a function. Thus, the changes that could introduce a Functional Decomposition might be the removal of responsibilities (i.e.,methods). This clearly results in the decrease of some metrics, such as NOM, LOC and WMC. As an example, let us consider the class DisplayKMeansof Apache Mahout. The class implemented the K-means clustering algorithm in its original form. How-ever, after three commits the only operation performed by the class was the visualization of the clusters. Indeed, developers moved the actual implementation of the clustering algorithm in the class Job of the package kmeans, introducing a Functional Decomposition in DisplayKMeans.
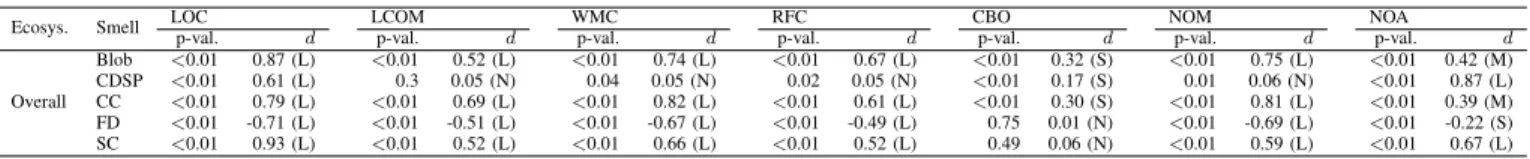
Overall, from the analysis of Table V we can conclude that (i) LOC characterizes the introduction of all the smells; (ii) LCOM, WMC, RFC and NOM characterize all the smells but Class Data Should be Private; (iii) CBO does not characterize the introduction of any smell; and (iv) the only metrics characterizing the introduction of Class Data Should be Private are LOC and NOA.
Summary for RQ1.Most of the smell instances are introduced
when files are created. However, there are also cases, espe-cially for Blob and Complex Class, where the smells manifest themselves after several changes performed on the file. In these cases, files that will become smelly exhibit specific trends for some quality metric values that are significantly different than those of clean files.
B. Why are code smells introduced?
To answer RQ2, we analyze the percentage of
smell-introducing commits classified according to the category of tags,i.e.,commit goal,project status, anddeveloper status.
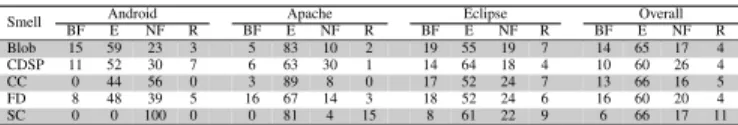
Commit-Goal: Table VII reports the percentage of
smell-introducing commits assigned to each tag of the category commit-goal. Among the three different ecosystems analyzed, results show that smell instances are mainly introduced when developers perform enhancement operations on the system. When considering the three ecosystems altogether, for all the considered types of smells the percentage of smell-introducing commits tagged as enhancement ranges between 60% and 66%. Note that by enhancement we mean changes applied by developers on existing features aimed at improving them. For example, a Functional Decomposition was introduced in the class CreateProjectFromArchetypeMojo of Apache Maven when the developer performed the “first pass at implementing the feature of being able to specify additional goals that can be run after the creation of a project from an archetype” (as reported in the commit log).
Note that when considering bothenhancement or new fea-turethe percentage of smell-introducing commits exceeds, on average, 80%. This indicates, as expected, that the most smell-prone activities are performed by developers when adding
TABLE VII
RQ2: COMMIT-GOAL TAGS TO SMELL-INTRODUCING COMMITS. BF: BUG
FIXING; E: ENHANCEMENT; NF: NEWFEATURE; R: REFACTORING Smell BF AndroidE NF R BF EApacheNF R BF EclipseE NF R BF EOverallNF R Blob 15 59 23 3 5 83 10 2 19 55 19 7 14 65 17 4 CDSP 11 52 30 7 6 63 30 1 14 64 18 4 10 60 26 4
CC 0 44 56 0 3 89 8 0 17 52 24 7 13 66 16 5
FD 8 48 39 5 16 67 14 3 18 52 24 6 16 60 20 4
SC 0 0 100 0 0 81 4 15 8 61 22 9 6 66 17 11
new features or improving existing features. However, there is also a non-negligible number of smell-introducing commits tagged asbug fixing(between 6% and 16%). This means that also during corrective maintenance developers might introduce a smell, especially when the bug fixing is complex and requires changes to several code entities. For example, the class SecuredModel of Apache Jena builds the security model when a semantic Web operation is requested by the user. In order to fix a bug that did not allow the user to perform a safe authentication, the developer had to update the model, implementing more security controls. This required changing several methods present in the class (10 out of 34). Such changes increase the whole complexity of the class (the WMC metric increased from 29 to 73) makingSecuredModel a Complex Class.
Another interesting observation from the results reported in Table VII is related to the number of smell-introducing commits tagged asrefactoring(between 4% and 11%). While refactoring is the principal treatment to remove smells, we found 394 cases in which developers introduced new smells when performing refactoring operations. For example, the classEC2ImageExtensionof Apache jClouds implements the ImageExtension interface, which provides the meth-ods for creating an image. During the evolution, developers added methods for building a new image template as well as a method for managing image layout options (e.g., its align-ment) in the EC2ImageExtension class. Subsequently, a developer performed an Extract Class refactoring operation aimed at reorganizing the responsibility of the class. Indeed, the developer split the original class into two new classes, i.e.,ImageTemplateImpl andCreateImageOptions. However, the developer also introduced a Functional Decom-position in the class CreateImageOptions since such a class, after the refactoring, contains just one method,i.e.,the one in charge of managing the image options. This result sheds light on the dark side of refactoring; besides the risk of introducing faults [8], when performing refactoring operations, there is also the risk of introducing design problems.
Looking into the ecosystems, the general trend discussed so far holds for Apache and Eclipse. Regarding Android, we notice something different for Complex Class and Spaghetti Code smells. In these cases, the smell-introducing commits are mainly due to the introduction of new features. Such a differ-ence could be due to the particular development model used for Android apps. Specifically, we manually analyzed the in-stances of smells identified in the 70 Android apps, and we ob-served that in the majority of cases classes affected by a smell are those extending the AndroidActivityclass,i.e.,a class extended by developers to provide features to the app’s users.
TABLE V
RQ1: DESCRIPTIVESTATISTICS OF THESLOPE FOR THEREGRESSIONLINESBUILT FOR EACHMETRIC FORFILESAFFECTED/NOTAFFECTED BY EACH
BADSMELL MAX Iminor note never use ”average” to indicate ”mean” because also the median is a measure of averageJ
Ecosys. Smell Affected LOCmean med LCOMmean med WMCmean med RFCmean med CBOmean med NOMmean med NOAmean med
Blob NO 0.68 0 0.55 0 0.17 0 0.13 0 0.15 0 0.07 0 0.09 0 YES 32.90 12.51 13.80 2.61 3.78 1.81 5.39 3.47 1.34 0.69 1.15 0.57 0.49 0.13 CDSP NO 0.42 0 0.12 0 0.12 0 0.05 0 0.09 0 0.05 0 0.06 0 YES 4.43 1.68 0.83 0 0.33 0 0.27 0 0.36 0.18 0.17 0 2.60 0.69 Android CC NO 0.67 0 0.48 0 0.19 0 0.14 0 0.15 0 0.08 0 0.09 0 YES 7.71 6.81 11.16 4.12 2.61 2.20 2.42 1.01 0.33 0.28 0.67 0.50 0.18 0.10 FD NO 0.99 0 0.62 0 0.29 0 0.31 0 0.40 0 0.11 0 0.11 0 YES -10.56 -1.00 -2.65 0 -2.74 -0.60 -3.49 0 0.78 0.49 -1.13 -0.30 -0.91 0 SC NO 1.42 0 0.96 0 0.31 0 0.42 0 0.29 0 0.11 0 0.13 0 YES 144.2 31.0 69.17 100.00 10.17 10.00 6.33 5.00 0.67 1.00 3 3 0.16 0 Blob NO 0.40 0 0.42 0 0.13 0 0.13 0 0.05 0 0.05 0 0.03 0 YES 91.82 33.58 384.70 12.40 17.79 4.92 27.61 7.09 2.17 0.50 7.64 1.72 0.77 0.05 CDSP NO 0.43 0 0.54 0 0.12 0 0.12 0 0.10 0 0.05 0 0.03 0 YES 8.69 2.03 2.44 0 0.61 0 0.59 0 0.55 0.06 0.23 0 3.28 1.07 Apache CC NO 0.36 0 0.47 0 0.12 0 0.13 0 0.09 0 0.05 0 0.04 0 YES 121.80 25.86 886.50 152.40 31.87 10.36 39.81 7.21 3.45 0.53 13.99 3.56 0.17 0 FD NO 0.52 0 0.812 0 0.16 0 0.14 0 0.10 0 0.07 0 0.030 0 YES -13.78 -3.32 -5.98 -0.30 -6.16 -1.00 -4.81 -0.52 -0.28 0 -2.82 -0.53 -0.40 0 SC NO 0.54 0 0.11 0 0.11 0 0.12 0 0.14 0 0.04 0 0.04 0 YES 273.00 129.90 232.30 4.50 7.09 6.50 10.81 10.15 0.96 0.92 3.41 3.00 2.29 2.08 Blob NO 0.02 0 0.02 0 -0.01 0 -0.03 0 0.13 0 -0.01 0 0.01 0 YES 69.51 28.15 1208.00 14.71 17.10 2.92 18.15 2.44 0.58 0.01 7.11 1.09 3.11 0.09 CDSP NO 0.01 0 0.34 0 <-0.01 0 -0.02 0 0.13 0 <-0.01 0 0.01 0 YES 12.58 2.50 749.1 0 2.77 0 0.70 0 0.37 0 2.10 0 4.01 1 Eclipse CC NO 0.02 0 0.21 0 -0.01 0 -0.05 0 0.11 0 -0.01 0 0.02 0 YES 57.72 18.00 2349.00 141.70 19.86 4.86 10.46 0.82 0.68 0.01 10.23 1.94 3.10 <0.01 FD NO -0.02 0 0.67 0 -0.02 0 -0.02 0 0.13 0 -0.01 0 0.02 0 YES -15.09 -5.40 -5.23 -0.95 -5.15 -1.71 -4.06 -0.60 -0.16 0.16 -2.39 -0.60 -0.35 0 SC NO 0.07 0 1.19 0 0.02 0 -0.06 0 0.15 0 -0.01 0 0.02 0 YES 114.40 42.74 698.4 137.3 16.65 4.03 9.47 0.03 1.37 0 6.44 2.39 9.30 1.17 Blob NO 0.25 0 0.25 0 0.07 0 0.06 0 0.09 0 0.02 0 0.02 0 YES 73.76 29.14 849.90 9.57 16.26 3.30 20.17 3.04 1.15 0.20 6.81 1.12 2.15 0.08 CDSP NO 0.26 0 0.43 0 0.07 0 0.06 0 0.11 0 0.03 0 0.02 0 YES 9.36 2.10 290.50 0 1.39 0 0.57 0 0.44 0 0.94 0 3.42 1.00 Overall CC NO 0.21 0 0.34 0 0.06 0 0.04 0 0.10 0 0.02 0 0.03 0 YES 63.00 12.60 1573.00 46.81 19.36 3.81 15.68 1.93 1.25 0.18 9.29 1.40 1.88 0.01 FD NO 0.29 0 0.75 0 0.08 0 0.07 0 0.12 0 0.03 0 0.02 0 YES -14.09 -4.00 -5.59 -0.50 -5.67 -1.37 -4.50 -0.54 -0.19 0 -2.60 -0.57 -0.40 0 SC NO 0.17 0 1.02 0 0.04 0 -0.02 0 0.15 0 0.01 0 0.03 0 YES 134.00 36.29 597.0 100.0 15.09 6.34 9.36 1.00 1.27 0 5.84 3.00 7.80 0.57 TABLE VI
RQ1:SLOPE AFFECTEDvsSLOPE NOT AFFECTED- MANN-WHITNEY TEST(ADJ.P-VALUE)ANDCLIFF’SDELTA(d)
Ecosys. Smell LOC LCOM WMC RFC CBO NOM NOA
p-val. d p-val. d p-val. d p-val. d p-val. d p-val. d p-val. d
Blob <0.01 0.87 (L) <0.01 0.52 (L) <0.01 0.74 (L) <0.01 0.67 (L) <0.01 0.32 (S) <0.01 0.75 (L) <0.01 0.42 (M) CDSP <0.01 0.61 (L) 0.3 0.05 (N) 0.04 0.05 (N) 0.02 0.05 (N) <0.01 0.17 (S) 0.01 0.06 (N) <0.01 0.87 (L) Overall CC <0.01 0.79 (L) <0.01 0.69 (L) <0.01 0.82 (L) <0.01 0.61 (L) <0.01 0.30 (S) <0.01 0.81 (L) <0.01 0.39 (M) FD <0.01 -0.71 (L) <0.01 -0.51 (L) <0.01 -0.67 (L) <0.01 -0.49 (L) 0.75 0.01 (N) <0.01 -0.69 (L) <0.01 -0.22 (S) SC <0.01 0.93 (L) <0.01 0.52 (L) <0.01 0.66 (L) <0.01 0.52 (L) 0.49 0.06 (N) <0.01 0.59 (L) <0.01 0.67 (L)
Specifically, we observed that quite often developers introduce a Complex Class or a Spaghetti Code smell when adding a new feature to their apps by extending the Activity class. For example, the class ArticleViewActivity of the Aard5 app became a Complex Class after the addition of several new features (spread across 50 commits after its creation), such as the management of page buttons and online visualization of the article. All these changes contributed to increase the slope of the regression line for the RFC metric of a factor of 3.91 and for WMC of a factor of 2.78.
Project status: Table VIII reports the percentage of
smell-introducing commits assigned to each tag of the category project-status. As expected, most of the smells are introduced the last month before issuing a release. Indeed, the percentage of smells introduced more than one month prior to issuing
5Aard is an offline Wikipedia reader.
TABLE VIII
RQ2: PROJECT-STATUS TAGS TO SMELL-INTRODUCING COMMITS Ecosystem Smell
Working on Release Project Startup
One One One
More One One One More
Day Week Month Week Month Year
Blob 7 54 35 4 6 3 35 56 CDSP 14 20 62 4 7 17 33 43 Android CC 0 6 94 0 0 12 65 23 FD 1 29 59 11 0 4 71 25 SC 0 0 100 0 0 0 0 100 Blob 19 37 43 1 3 7 54 36 CDSP 10 41 46 3 3 8 45 44 Apache CC 12 30 57 1 2 14 46 38 FD 5 14 74 7 3 8 43 46 SC 21 18 58 3 3 7 15 75 Blob 19 37 43 1 3 20 32 45 CDSP 10 41 46 3 6 12 39 43 Eclipse CC 12 30 57 1 2 12 42 44 FD 5 14 73 8 2 5 35 58 SC 21 18 58 3 1 5 19 75 Blob 15 33 50 2 5 14 38 43 CDSP 10 29 58 3 6 12 39 43 Overall CC 18 28 53 1 4 13 42 41 FD 7 22 66 5 3 7 42 48 SC 16 20 58 6 2 6 17 75
TABLE IX
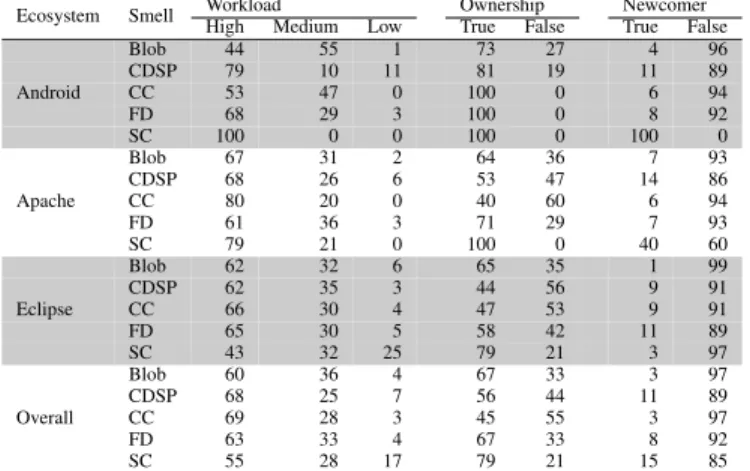
RQ2: DEVELOPER-STATUS TAGS TO SMELL-INTRODUCING COMMITS
Ecosystem Smell Workload Ownership Newcomer
High Medium Low True False True False
Blob 44 55 1 73 27 4 96 CDSP 79 10 11 81 19 11 89 Android CC 53 47 0 100 0 6 94 FD 68 29 3 100 0 8 92 SC 100 0 0 100 0 100 0 Blob 67 31 2 64 36 7 93 CDSP 68 26 6 53 47 14 86 Apache CC 80 20 0 40 60 6 94 FD 61 36 3 71 29 7 93 SC 79 21 0 100 0 40 60 Blob 62 32 6 65 35 1 99 CDSP 62 35 3 44 56 9 91 Eclipse CC 66 30 4 47 53 9 91 FD 65 30 5 58 42 11 89 SC 43 32 25 79 21 3 97 Blob 60 36 4 67 33 3 97 CDSP 68 25 7 56 44 11 89 Overall CC 69 28 3 45 55 3 97 FD 63 33 4 67 33 8 92 SC 55 28 17 79 21 15 85
consideration holds for all the ecosystems and for all the bad smells analyzed, thus confirming the common wisdom that the deadline pressure on developers can be one of the main causes for smell introduction.
Considering the project startup tag, the results are quite unexpected. Indeed, a high number of smell instances are introduced few months after the project startup. This is particu-larly true for Blob, Class Data Should Be Private, and Complex Class, where more than half of the instances are introduced in the first year of system’s lifecycle. Instead, Functional Decomposition, and especially Spaghetti Code, seem to be the types of smells that take more time to manifest themselves with more than 75% of Spaghetti Code instances introduced after the first year. This result contradicts, at least in part, the common wisdom that smells are introduced after several continuous maintenance activities and, thus, are more pertinent to advanced phases of the development process [20], [38].
Developer status: Finally, Table IX reports the percentage
of smell-introducing commits assigned to each tag of the category developer-status. From the analysis of the results it is evident that the developers’ workload negatively in-fluences the quality of the source code produced. On the overall dataset, at least in 55% of cases the developer who introduces the smell has a high workload. For example, on
the InvokerMavenExecutor class in Apache Maven a
developer introduced a Blob smell while adding the command line parsing to enable users alternate the settings. When performing such a change, the developer had relatively high workload while working on nine other different classes (in this case, the workload was classified as high).
We can also observe that generally the developers who introduce a smell are not newcomers while often they are owners of the files. At the first glance, this could look like an unexpected result. The owner of the file—one of the most experienced developers of the file—is the one that has the higher likelihood of introducing a smell. However, as also discussed by Zeller in his book Why programs fail, more experienced developers tend to perform more complex and critical tasks [51]. Thus, it is likely that their commits are more prone to introducing design problems.
Summary for RQ2. Smells are generally introduced by
developers when enhancing existing features or implementing new ones. As expected, smells are generally introduced in the last month before issuing a deadline, while there is a considerable number of instances introduced in the first year from the project startup. Finally, developers that introduce smells are generally the owners of the file and they are more prone to introducing smells when they have higher workloads.
IV. THREATS TOVALIDITY
The main threats related to the relationship between the-ory and observation (construct validity) are due to impreci-sions/errors in the measurements we performed. Above all, we relied on DECOR rules to detect smells. Notice that our re-implementation uses the exact rules defined by Mohaet al. [34], and has been already used in our previous work [37]. Nevertheless, we are aware that our results can be affected by the presence of false positives and false negatives. Moha et al. reported for DECOR a precision above 60% and a recall of 100% on Xerces 2.7.0. As for the precision, other than relying on Mohaet al.assessment, we have manually validated a subset of the 4,627 detected smell instances. This manual validation has been performed by two authors independently, and cases of disagreement were discussed. In total, 1,107 smells were validated, including 241 Blob instances, 317 Class Data Should Be Private, 166 Complex Class, 65 Spaghetti Code, and 318 Functional Decomposition. Such a (stratified) sample is deemed to be statistically significant for a 95% confidence level and ±10% confidence interval [41]. The results of the manual validation indicated a mean precision of 73%, and specifically 79% for Blob, 62% for Class Data Should Be Private, 74% for Complex Class, 82% for Spaghetti Code, and 70% for Functional Decomposition. In addition, we replicated all the analysis performed to answer our two research questions by just considering the smell-introducing commits (2,555) involving smell instances that have been manually validated as true positives. The results achieved in this analysis (available in our replication package [45]) are perfectly inline with those obtained in our paper on the complete set of 9,164 smell-introducing commits, confirming all our findings. Finally, we are aware that our study can also suffer from presence of false negatives. However, (i) the sample of investigated smell instances is pretty large (4,627 instances), and (ii) theDECOR’s claimed recall is very high. As explained in Section II, the heuristic for excluding projects with incomplete history from the Project startup analysis may have failed to discard some projects. Also, we ex-cluded the first commit from a project’s history involving Java files from the analysis of smell-introducing commits, because such commits are likely to be imports from old versioning systems, and, therefore, we only focused our attention (in terms of first commit) on the addition of new files during the observed history period. Concerning the tags used to character-ize smell-introducing changes, the commit classification was performed by two different authors and results were compared and discussed in cases of inconsistencies. Also, a second check
was performed for those commits linked to issues (only 471 out of 9,164 commits), to avoid problems due to incorrect issue classification [2], [24].
The analysis of developer-related tags was performed using the Git author information instead of relying on committers (not all authors have commit privileges in open source projects, hence observing committers would give an imprecise and par-tial view of the reality). However, there is no guarantee that the reported authorship is always accurate and complete. We are aware that theWorkloadtag measures the developers’ activity within a single project, while in principle one could be busy on other projects or different other activities. One possibility to mitigate such a threat could have been to measure the workload of a developer within the entire ecosystem. However, in our opinion, this would have introduced some bias,i.e.,assigning a high workload to developers working on several projects of the same ecosystem and a low workload to those that, while not working on other projects of the same ecosystem, could have been busy on projects outside the ecosystem. It is also important to point out that, in terms of relationship between Workload tag and smell introduction, we obtained consistent results across three ecosystems, which at least mitigates the presence of a possible threat. Also, estimating the Workload by just counting commits is an approximation. However, we do not use the commit size because there might be a small commit requiring a substantial effort as well.
As for the threats that could have influenced the results (internal validity), we performed the study by comparing classes affected (and not) by a specific type of smell. However, there can be also cases of classes affected by different types of smells at the same time. Our investigation revealed that such classes represent a minority (3% for Android, 5% for Apache, and 9% for Eclipse), and, therefore, the interaction between different types of smells is not particularly interesting to investigate, given also the complexity it would have added to the study design and to its presentation. Finally, while in
RQ2we studied tags related to different aspects of a software
project lifetime—characterizing commits, developers, and the project status itself—we are aware that there could be many other factors that could have influenced the introduction of smells. In any case, it is worth noting that it is beyond the scope of this work to make any claims related to causation of the relationship between the introduction of smells and product or process factors characterizing a software project.
The main threats related to the relationship between the treatment and the outcome (conclusion validity) are repre-sented by the analysis method exploited in our study. InRQ1,
we used non-parametric tests (Mann-Whitney) and effect size measures (Cliff’s Delta), as well as regression analysis. Results of RQ2 are, instead, reported in terms of descriptive statistics
and analyzed from purely observational point of view. Finally, regarding the generalization of our findings ( exter-nal validity) this is, to the best of our knowledge, the largest study—in terms of number of projects (200)—concerning the analysis of code smells and of their evolution. However, we are aware that we limited our attention to only five types of
smells. As explained in Section II, this choice is justified by the need for limiting the computation since we wanted to analyze a large number of projects. Also, we tried to diversify the types of smells including smells representing violations of OO principles and “size-related” smells. Last, but not least, we made sure to include smells—such as Complex Class, Blob, and Spaghetti Code—that previous studies indicated to be perceived by developers as severe problems [36]. Nevertheless, further studies aiming at replicating our work on other smells, with projects developed in other programming languages, are desirable.
V. RELATEDWORK
This section discusses work investigating the evolution of code smells in software systems and their effect on mainte-nance activities and on software quality. Khomh et al. [26], [25] studied the relationship between the presence of code smells and software change- and fault-proneness. They found that classes affected by code smells tend to be significantly more change- [25] and fault- prone [26] than other classes. Empirical evidence demonstrating that some bad smells cor-relate with higher fault-proneness has also been reported by Li and Shatnawi [30]. Abbeset al.[1] conducted three controlled experiments with the aim of investigating the impact of Blob and Spaghetti Code smells on program comprehension. Their results indicated that single occurrence of such smells does not significantly decrease developer’s performance, while the coexistence of multiple bad smell instances in the same class significantly reduces developers’ performance during mainte-nance tasks. Similar results were obtained by Yamashita and Moonen [48] when studying the interaction of different code smells. Their results indicate that the maintenance problems are strictly related to the presence of more bad smells in the same file. They also investigated the impact of bad smells on maintainability characteristics [49]. As discussed in Section IV we do not focus on smell co-occurrences because they happen in a very small percentage (< 9%) of affected classes. The controlled experiment conducted by Sjøberg et al. [43] confirmed that smells do not always constitute a problem, and that often class size impacts maintainability more than the presence of smells. Other studies investigate the impact of smells and their perception by surveying project developers. Arcoverdeet al. [3] investigated how developers react to the presence of bad smells in their code. The results of their survey indicate that code smells often remain in source code for a long time and the main reason for postponing their removal through refactoring activities is to avoid API modifications [3]. A recent paper presented an empirical study aimed at investigating the perception of 13 types of smells [36], by showing to the participants code snippets containing (or not) smells. The results of such a study show that smells related to complex/long source code are generally perceived as harmful, while the other types of smells are not perceived or perceived only if the “intensity” of the problem is high. Yamashita and Moonen [50] conducted a survey involving 85 professionals, concerning the perceived severity of code smells and the need
to remove them. Their results indicated that 32% of developers do not know (or know little) about code smells, and those who are aware about the problem, pointed out that in many cases smell removal was not a priority, because of time pressure or lack of adequate tool support. In summary, although with contrasting results, the studies discussed above provide a general evidence that—at least in specific circumstances— code smells have negative effects on software quality. Despite that, however, developers seem reluctant to perform activities aimed at their removal. Chatzigeorgiou and Manakos [15] analyzed this phenomena and their results indicate that in most cases, the design problems persist up to the latest examined version accumulating even more as the project matures. Very few bad smells are removed from the project, and in the vast majority of these cases this was not due to specific refactoring activities, but rather a side-effect of adaptive maintenance [15]. They also pointed out some findings consistent with ourRQ1, i.e., they indicated that a conspicuous percentage of smells were introduced when the affected source code entity was added in the system[15]. However, their study does not provide quantitative data showing the magnitude of such phenomenon, as we do. It is also important to point out that we performed our analysis at commit-level (unlike to the related work that conducted those studies at release level), which allowed us to identify when bad smells appear in the source code. Finally, our results are based on 200 analyzed systems instead of two systems analyzed by the study that we mentioned earlier. Peters and Zaidman [39] analyzed the bad smells’ lifespan focusing on developers’ behavior in the presence of such smells, confirming that often, even if the developers are aware of the bad smells’ presence, they do not perform refactoring activities.
VI. CONCLUSION ANDLESSONSLEARNED
This paper presented a large-scale empirical study con-ducted over the commit history of 200 open source projects and aimed at understanding when and why bad code smells are introduced. These results provide several valuable findings for the research community:
Lesson 1. Most of times code artifacts are affected by bad
smells since their creation. This result contradicts the common wisdom that bad smells are generally due to a negative effect of software evolution. Also, this finding highlights that the introduction of most smells can simply be avoided by performing quality checks at commit time. In other words, instead of running smell detector time-to-time on the entire system, these tools could be used during commit activities (in particular circumstances, such as before issuing a release) to avoid or at least limit the introduction of bad code smells.
Lesson 2. Code artifacts becoming smelly as consequence
of maintenance and evolution activities are characterized by peculiar metrics’ trends, different from those of clean artifacts. This is in agreement with previous findings on the historical evolution of code smells [32], [37], [40]. Also, such results encourage the development of recommenders able of alerting software developers when changes applied to a code artifacts
result in worrisome metric trends, generally characterizing artifacts that will be affected by a smell.
Lesson 3. While implementing new features and enhancing
existing ones are, as expected, the main activities during which developers tend to introduce smells, we found almost 400 cases in which refactoring operations introduced smells. This result is quite surprising, given that one of the goals behind refactoring is the removal of bad smells [20]. This finding highlights the need for techniques and tools aimed at assessing the impact of refactoring operations on source code before their actual application (e.g.,see the recent work by Chaparro et al. [14]).
Lesson 4. Newcomers are not necessary responsible for
in-troducing bad smalls, while developers with high workloads and release pressure are more prone to introducing smell instances. This result highlights that code inspection practices should be strengthened when developers are working under these stressful conditions.
These lessons learned represent the main input for our future research agenda on the topic, mainly focused on designing and developing a new generation of code quality-checkers, such as those described in Lesson 2.
REFERENCES
[1] M. Abbes, F. Khomh, Y.-G. Gu´eh´eneuc, and G. Antoniol, “An empirical study of the impact of two antipatterns, Blob and Spaghetti Code, on program comprehension,” in 15th European Conference on Software Maintenance and Reengineering, CSMR 2011, 1-4 March 2011, Old-enburg, Germany. IEEE Computer Society, 2011, pp. 181–190. [2] G. Antoniol, K. Ayari, M. Di Penta, F. Khomh, and Y.-G. Gu´eh´eneuc,
“Is it a bug or an enhancement?: a text-based approach to classify change requests,” inProceedings of the 2008 conference of the Centre for Advanced Studies on Collaborative Research, October 27-30, 2008, Richmond Hill, Ontario, Canada. IBM, 2008, p. 23.
[3] R. Arcoverde, A. Garcia, and E. Figueiredo, “Understanding the longevity of code smells: preliminary results of an explanatory survey,” in Proceedings of the International Workshop on Refactoring Tools. ACM, 2011, pp. 33–36.
[4] V. Arnaoudova, M. Di Penta, G. Antoniol, and Y.-G. Gu´eh´eneuc, “A new family of software anti-patterns: Linguistic anti-patterns,” in17th European Conference on Software Maintenance and Reengineering, CSMR 2013, Genova, Italy, March 5-8, 2013. IEEE Computer Society, 2013, pp. 187–196.
[5] A. Bachmann, C. Bird, F. Rahman, P. T. Devanbu, and A. Bernstein, “The missing links: bugs and bug-fix commits.” in Proceedings of the 18th ACM SIGSOFT International Symposium on Foundations of Software Engineering, 2010, Santa Fe, NM, USA, November 7-11, 2010. ACM, 2010, pp. 97–106.
[6] R. Baeza-Yates and B. Ribeiro-Neto, Modern Information Retrieval. Addison-Wesley, 1999.
[7] G. Bavota, G. Canfora, M. Di Penta, R. Oliveto, and S. Panichella, “The evolution of project inter-dependencies in a software ecosystem: The case of apache,” in 2013 IEEE International Conference on Software Maintenance, Eindhoven, The Netherlands, September 22-28, 2013, 2013, pp. 280–289.
[8] G. Bavota, B. D. Carluccio, A. De Lucia, M. Di Penta, R. Oliveto, and O. Strollo, “When does a refactoring induce bugs? an empirical study,” inProceedings of the IEEE International Working Conference on Source Code Analysis and Manipulation. Riva del Garda, Italy: IEEE Computer Society, 2012, pp. 104–113.
[9] G. Bavota, A. Qusef, R. Oliveto, A. De Lucia, and D. Binkley, “An empirical analysis of the distribution of unit test smells and their impact on software maintenance,” in 28th IEEE International Conference on Software Maintenance, ICSM 2012, Trento, Italy, September 23-28, 2012. IEEE Computer Society, 2012, pp. 56–65.