Iowa State Research Farm Progress Reports
2011
Corn Population Research
Kenneth T. PecinovskyIowa State University, [email protected]
Follow this and additional works at:http://lib.dr.iastate.edu/farms_reports
Part of theAgricultural Science Commons, and theAgriculture Commons
This report is brought to you for free and open access by Iowa State University Digital Repository. It has been accepted for inclusion in Iowa State Research Farm Progress Reports by an authorized administrator of Iowa State University Digital Repository. For more information, please contact [email protected].
Recommended Citation
Pecinovsky, Kenneth T., "Corn Population Research" (2011).Iowa State Research Farm Progress Reports. 247.
Corn Population Research
AbstractProducers continually question whether they should be increasing corn plant populations based on planting date, soil/weather conditions, and seed company recommendations. Previous high corn yield award winners have claimed that they have used deep tillage and high populations in highly fertile soils to garner their award winning yields. Improvements in genetic traits and seed treatments and in-plant protection from a number of insects have been the main selling points to increase planting populations. Advances in planting equipment (narrow and twin row configurations providing more equidistant plant spacing) have also made increasing plant populations possible. Yield increases for row spacing less than 30 in. (15 in. and twin rows) at Nashua have shown small and inconsistent yield differences with the main yield benefit being from variety selection and to a lesser extent, planting population for increasing grain yields. These trials were designed to collect information to aid in local recommendations.
Keywords
RFR A10112
Disciplines
Iowa State University, Northeast Research and Demonstration Farm ISRF10-13
23
Corn Population Research
RFR-A10112
Ken Pecinovsky, farm superintendent
Introduction
Producers continually question whether they should be increasing corn plant populations based on planting date, soil/weather
conditions, and seed company
recommendations. Previous high corn yield award winners have claimed that they have used deep tillage and high populations in highly fertile soils to garner their award winning yields. Improvements in genetic traits and seed treatments and in-plant protection from a number of insects have been the main selling points to increase planting populations. Advances in planting equipment (narrow and twin row configurations providing more equidistant plant spacing) have also made increasing plant populations possible. Yield increases for row spacing less than 30 in. (15 in. and twin rows) at Nashua have shown small and inconsistent yield differences with the main yield benefit being from variety selection and to a lesser extent, planting population for increasing grain yields. These trials were designed to collect information to aid in local recommendations.
Materials and Methods
Corn population studies were conducted in 2009 and 2010. The previous crops are noted in the tables. Soil type for the 2009 and 2010 corn population × crop rotation × tillage
studies and 2010 corn variety × population
studies were Clyde silty clay loam. Kenyon loam was the soil type for the 2009 corn variety × population study. The trials were
replicated three times with four seeding rates, except for the 2009 corn variety × population
study, which had three seeding rates. Seeding rates ranged from 26,659 to 43,908 seeds/acre based on planter gear transmission settings for
the planter and depending on the study and year. Each plot was six rows wide by the plot length, which varied from 100 to 165 ft depending on the study. All tillage operations occurred in the previous fall using either a White 588 moldboard plow, Glencoe Soil Saver II chisel plow, and an Orthman or Case DMI strip till bar. Moldboard and chisel plow treatments received a Kent Series V field cultivator pass, prior to planting. Tillage systems, crop rotations, and corn varieties were not randomized or replicated, only the population treatments were randomized and replicated in a strip plot design. Nitrogen rates were applied according to crop rotation requirements, based on optimal levels for maximum grain yield. Soil fertility was in the Optimum to Very High range according to ISU Publication 1688 for all studies. A
preemergent grass herbicide was sprayed after planting followed by a postemergent broadleaf herbicide in early June. Final stands were taken in late August and grain yield determined by weigh bin scale on a John Deere 4400 combine.
Results and Discussion
Final plant stands from the tillage × crop
rotation × planting population studies showed
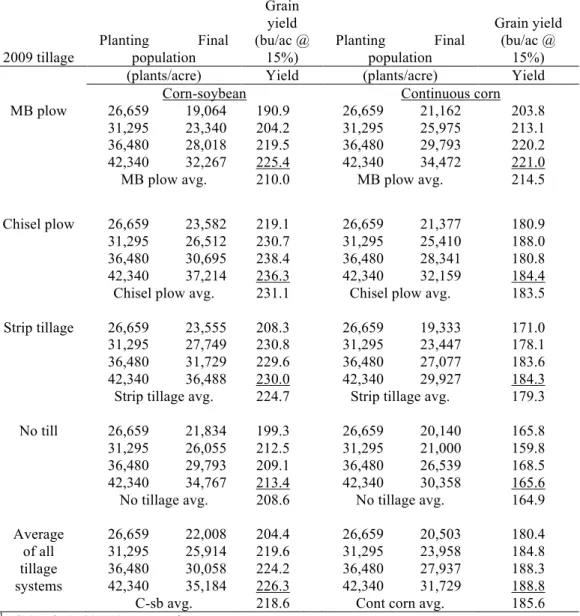
considerable variability when comparing 2009 and 2010 (Tables 1 and 2), which can be attributed to soil and weather conditions following planting. In both years, the plots were planted April 18, followed by an
additional 5.26 and 1.97 in. of April rainfall in 2009 and 2010, respectively. Heavy April 2009 precipitation after planting contributed to the increased seed mortality. Grain yields were generally higher in 2009, despite
increased seed mortality, due to a longer grain fill period following pollination due to mild 2009 temperatures. In 2009, moldboard plow and no tillage systems had the largest
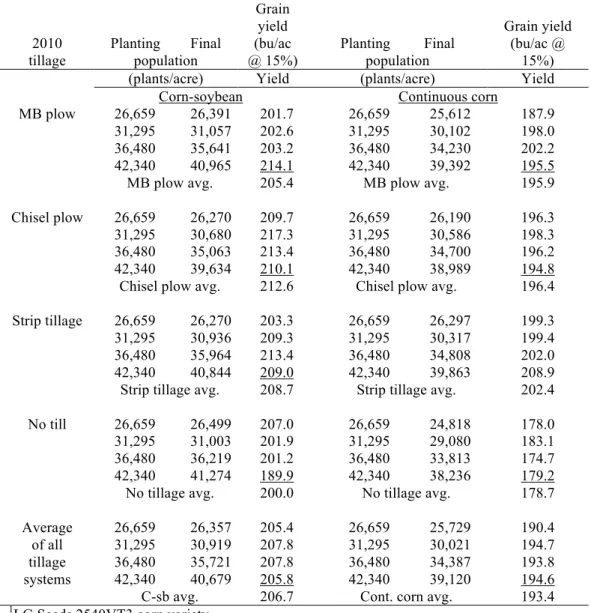
crusting conditions and heavy residue interference, respectively. Looking at tillage averages, final stands of 27,937 (cont. corn) and 30,058 (Csb) seemed to have the optimum yields in 2009. There also seemed to be no trend of yield increases when increasing final populations in 2010 (Table 2). This may be attributable to optimum environmental
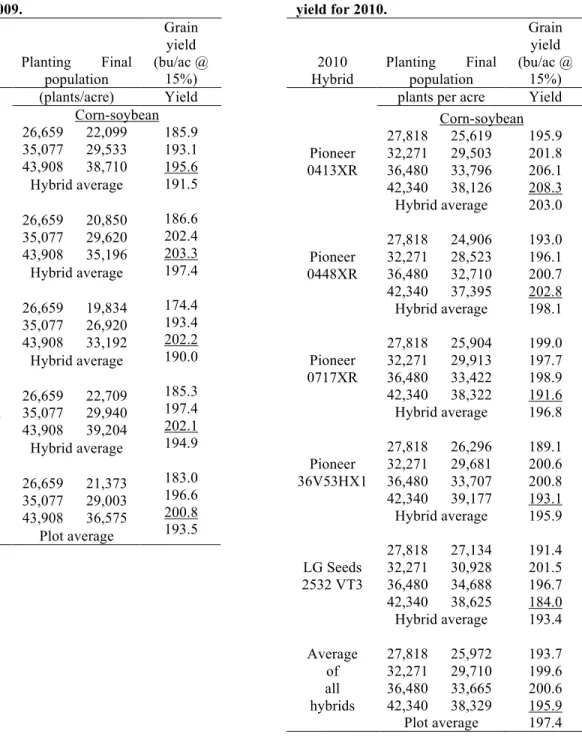
conditions throughout the year. Final results in the corn variety × planting population studies
in 2009 showed a 13.6 and 4.2 bushel/acre increase when yields were averaged by final stands across varieties for 21,373 to 29,003 and 29,003 to 36,575 plants/acre, respectively (Table 3). In 2010, plant population increases for each variety did not show a trend toward higher yields (Table 4).
In general, (based on four studies conducted in two years), when final stands were between 28,000 to 30,000 plants/acre, corn grain yields
seemed to be maximized. Economic returns from increasing planting populations vary between producers due to differences in seed cost. Many factors need to be considered when making decisions on planting rates, such as economics, planting date/conditions, future weather conditions, soil type/fertility, row spacing, variety selection and subsurface drainage. Based on two years of data, plant populations had little effect on final grain yield, but conditions during and after planting seemed to have a greater effect on final plant stands and grain yield.
Acknowledgements
Appreciation is extended to Agrigold Seed Company, LG Seed Company, Crows Seed Company, Dekalb Genetics, and Pioneer Hi-Bred International for seed and Monsanto for crop protection chemicals.
Iowa State University, Northeast Research and Demonstration Farm ISRF10-13
25
Table 1. Plant population influence on final plant population and grain yield for 2009.1
2009 tillage Planting Final population Grain yield (bu/ac @ 15%) Planting Final population Grain yield (bu/ac @ 15%) (plants/acre) Yield (plants/acre) Yield
Corn-soybean Continuous corn MB plow 26,659 31,295 36,480 42,340 19,064 23,340 28,018 32,267 190.9 204.2 219.5 225.4 26,659 31,295 36,480 42,340 21,162 25,975 29,793 34,472 203.8 213.1 220.2 221.0 MB plow avg. 210.0 MB plow avg. 214.5 Chisel plow 26,659 31,295 36,480 42,340 23,582 26,512 30,695 37,214 219.1 230.7 238.4 236.3 26,659 31,295 36,480 42,340 21,377 25,410 28,341 32,159 180.9 188.0 180.8 184.4 Chisel plow avg. 231.1 Chisel plow avg. 183.5 Strip tillage 26,659 31,295 36,480 42,340 23,555 27,749 31,729 36,488 208.3 230.8 229.6 230.0 26,659 31,295 36,480 42,340 19,333 23,447 27,077 29,927 171.0 178.1 183.6 184.3 Strip tillage avg. 224.7 Strip tillage avg. 179.3 No till 26,659 31,295 36,480 42,340 21,834 26,055 29,793 34,767 199.3 212.5 209.1 213.4 26,659 31,295 36,480 42,340 20,140 21,000 26,539 30,358 165.8 159.8 168.5 165.6 No tillage avg. 208.6 No tillage avg. 164.9 Average of all tillage systems 26,659 31,295 36,480 42,340 22,008 25,914 30,058 35,184 204.4 219.6 224.2 226.3 26,659 31,295 36,480 42,340 20,503 23,958 27,937 31,729 180.4 184.8 188.3 188.8 C-sb avg. 218.6 Cont corn avg. 185.6
Table 2. Plant population influence on final plant population and grain yield for 2010.1 2010 tillage Planting Final population Grain yield (bu/ac @ 15%) Planting Final population Grain yield (bu/ac @ 15%) (plants/acre) Yield (plants/acre) Yield
Corn-soybean Continuous corn MB plow 26,659 31,295 36,480 42,340 26,391 31,057 35,641 40,965 201.7 202.6 203.2 214.1 26,659 31,295 36,480 42,340 25,612 30,102 34,230 39,392 187.9 198.0 202.2 195.5 MB plow avg. 205.4 MB plow avg. 195.9 Chisel plow 26,659 31,295 36,480 42,340 26,270 30,680 35,063 39,634 209.7 217.3 213.4 210.1 26,659 31,295 36,480 42,340 26,190 30,586 34,700 38,989 196.3 198.3 196.2 194.8 Chisel plow avg. 212.6 Chisel plow avg. 196.4 Strip tillage 26,659 31,295 36,480 42,340 26,270 30,936 35,964 40,844 203.3 209.3 213.4 209.0 26,659 31,295 36,480 42,340 26,297 30,317 34,808 39,863 199.3 199.4 202.0 208.9 Strip tillage avg. 208.7 Strip tillage avg. 202.4 No till 26,659 31,295 36,480 42,340 26,499 31,003 36,219 41,274 207.0 201.9 201.2 189.9 26,659 31,295 36,480 42,340 24,818 29,080 33,813 38,236 178.0 183.1 174.7 179.2 No tillage avg. 200.0 No tillage avg. 178.7 Average of all tillage systems 26,659 31,295 36,480 42,340 26,357 30,919 35,721 40,679 205.4 207.8 207.8 205.8 26,659 31,295 36,480 42,340 25,729 30,021 34,387 39,120 190.4 194.7 193.8 194.6 C-sb avg. 206.7 Cont. corn avg. 193.4
Iowa State University, Northeast Research and Demonstration Farm ISRF10-13
27
Table 3. Corn variety and plant population influence on final plant population and grain yield for 2009. 2009 Hybrid Planting Final population Grain yield (bu/ac @ 15%) (plants/acre) Yield Corn-soybean Crows 4727VT3 26,659 35,077 43,908 22,099 29,533 38,710 Hybrid average Agrigold 6309VT3 26,659 35,077 43,908 20,850 29,620 35,196 Hybrid average Dekalb 61-69VT3 26,659 35,077 43,908 19,834 26,920 33,192 Hybrid average Pioneer 36V53HX1 26,659 35,077 43,908 22,709 29,940 39,204 Hybrid average Average of all hybrids 26,659 35,077 43,908 21,373 29,003 36,575 Plot average 185.9 193.1 195.6 191.5 186.6 202.4 203.3 197.4 174.4 193.4 202.2 190.0 185.3 197.4 202.1 194.9 183.0 196.6 200.8 193.5
Table 4. Corn variety and plant population influence on final plant population and grain yield for 2010. 2010 Hybrid Planting Final population Grain yield (bu/ac @ 15%) plants per acre Yield
Corn-soybean Pioneer 0413XR 27,818 32,271 36,480 42,340 25,619 29,503 33,796 38,126 195.9 201.8 206.1 208.3 Hybrid average 203.0 Pioneer 0448XR 27,818 32,271 36,480 42,340 24,906 28,523 32,710 37,395 193.0 196.1 200.7 202.8 Hybrid average 198.1 Pioneer 0717XR 27,818 32,271 36,480 42,340 25,904 29,913 33,422 38,322 199.0 197.7 198.9 191.6 Hybrid average 196.8 Pioneer 36V53HX1 27,818 32,271 36,480 42,340 26,296 29,681 33,707 39,177 189.1 200.6 200.8 193.1 Hybrid average 195.9 LG Seeds 2532 VT3 27,818 32,271 36,480 42,340 27,134 30,928 34,688 38,625 191.4 201.5 196.7 184.0 Hybrid average 193.4 Average of all hybrids 27,818 32,271 36,480 42,340 25,972 29,710 33,665 38,329 193.7 199.6 200.6 195.9 Plot average 197.4