Copyright © UNU-WIDER 2007
* Central Bank of Barbados, Bridgetown, Barbados, email: [email protected]
This study has been prepared within the UNU-WIDER project on Fragility and Development, directed by Mark McGillivray and Amelia Santos-Paulino.
UNU-WIDER gratefully acknowledges the financial contributions to the project by The Australian Agency for International Development (AusAID), the Finnish Ministry for Foreign Affairs, and the UK Department for International Development—DFID.
UNU-WIDER [also] acknowledges the financial contributions to the research programme by the governments of Denmark (Royal Ministry of Foreign Affairs), Finland (Ministry for Foreign Affairs), Norway (Royal Ministry of Foreign Affairs), Sweden (Swedish International Development Cooperation Agency—Sida) and the United Kingdom (Department for International Development).
ISSN 1810-2611 ISBN 92-9190-958-0 ISBN 13 978-92-9190-958-2
Research Paper No. 2007/19
Tourism Competitiveness
in Small Island Developing States
Roland Craigwell*
April 2007
Abstract
The tourism industry is the leading segment of the services industries in small island developing states (SIDS). This paper therefore seeks primarily to investigate both the nature and determinants of tourism competitiveness in SIDS. Judging from the various calculated indices of tourism competitiveness, the competitive position of tourism in SIDS is a major issue. More specifically, SIDS are still price uncompetitive and appear to be losing ground in the global tourism market. There is also a need for these countries to improve their levels of investment for the development of the technological infrastructure (telecommunications technology), and more importantly to ensure that the economic gains from tourism are spread to the lower-income households. Additionally, the findings of this study highlight some difficulties (from a macroeconomic perspective) of designing appropriate policies and strategies to enhance tourism competitiveness in SIDS. In particular, price and income considerations, given their predominantly exogenous nature, are not easy to control, but nevertheless must be explicitly taken into account in any policy aimed at improving tourism competitiveness.
Keywords: competitiveness, tourism, SIDS JEL classification: L83, F0, O1
The World Institute for Development Economics Research (WIDER) was established by the United Nations University (UNU) as its first research and training centre and started work in Helsinki, Finland in 1985. The Institute undertakes applied research and policy analysis on structural changes affecting the developing and transitional economies, provides a forum for the advocacy of policies leading to robust, equitable and environmentally sustainable growth, and promotes capacity strengthening and training in the field of economic and social policy making. Work is carried out by staff researchers and visiting scholars in Helsinki and through networks of collaborating scholars and institutions around the world.
www.wider.unu.edu [email protected]
UNU World Institute for Development Economics Research (UNU-WIDER) Katajanokanlaituri 6 B, 00160 Helsinki, Finland
Typescript prepared by Liisa Roponen at UNU-WIDER
The views expressed in this publication are those of the author(s). Publication does not imply endorsement by the Institute or the United Nations University, nor by the programme/project sponsors, of any of the views expressed.
Acknowledgement
I would like to thank Darrin Downes and Winston Moore for their research assistance.
Acronyms
GDP gross domestic product SIDS small island developing states WTO World Tourism Organization WTTC World Travel and Tourism Council
1 Introduction
The global trend towards expanded market access compels the small island developing states (SIDS) to intensify efforts to improve the level of (international) competitiveness in all areas of economic activity. Indeed, the mounting pressure on the traditional goods-producing (manufacturing and agricultural) sectors, which has been fuelled largely by the removal and reduction of tariffs, as well as by massive cuts in trade preferences, means that the services industries, particularly tourism, will be the main focus of the majority of SIDS for sustaining long-term economic and social development. This is because tourism is the leading segment of the services industries in SIDS, with the greatest potential to create significant value not only for establishments involved directly in tourism, but also more importantly for the society as a whole.
The tourist industry is widely recognized as the key engine of growth in SIDS, representing a significant source of foreign exchange earnings and employment both directly in tourism and indirectly in the ancillary sectors (primarily the distributive, agricultural, and transportation sectors) supporting the tourism industry. Since the 1980s, the tourism industry has improved markedly in the majority of SIDS. Over the period 1986-2004, stopover tourist arrivals have risen by almost 10 per cent per annum and visitor expenditure by approximately 11 per cent, with concomitant increases in both direct and indirect contributions to total real output. In addition, foreign exchange earnings from tourism in SIDS were approximately three times that of exports of goods (see Figure 1), and the number of jobs directly related to tourism more than double over the period analysed. Notwithstanding these positive trends, the competitive position in SIDS is still a major issue. More importantly, SIDS are uncompetitive in terms of the price of tourism, which is reflected in the finding that the market share of SIDS in the global tourism market has been stagnant and appears to be on the decline.
The importance of the tourism industry to SIDS, therefore, underscores the need for a greater understanding of the nature of tourism competitiveness. However, the measurement of tourism competitiveness is not a simple task, as it involves consideration of various factors covering the economic, environmental, social, cultural and political dimensions. Ritchie and Crouch (2003) and Dwyer and Kim (2003) manage to integrate all of these factors, predicted on a holistic view of the importance of creating and maintaining tourism competitiveness. These fully integrated models, however, have limited practical applicability to SIDS, primarily because of the paucity of appropriate proxies for some of the factors. Therefore, the indices created by the World Travel and Tourism Council (WTTC), which focuses on different aspects of tourism performance and the operating environment for tourism enterprises and activity, provide a valuable alternative to assessing the level of competitiveness of tourism in SIDS and are used in this study. Following the majority of researchers, this paper concentrates on price competitiveness as the key input in policy decisions regarding tourism. To ensure comparability across countries, the tourism price indices employed have taken into account purchasing power parity and exchange rate considerations. Furthermore, an econometric panel model, which builds on the framework of Sutton (1992), is also specified to explain the variations in tourism market shares in SIDS, predicated on the key assumption that countries compete via prices. The results differ according to source markets and indicate, at one time or another, that relative incomes in the source markets, relative prices, the cost of travel and the capital to income ratio are important determinants of the competitive position of tourism in SIDS. There seems
Figure 1
Tourism expenditure as a percentage of goods exports
Source: WTO (2006).
The paper comprises six sections. After the introduction, section 2 provides a fairly detailed examination of the trends in key tourism performance indicators. Section 3 reviews the literature on measuring tourism competitiveness for both developed and developing countries, and presents a discussion of the basic competitiveness indicators found in the literature. In section 4, a model of tourism competitiveness, the econometric approach and the sources and limitations in the data are outlined. Section 5 discusses the results of the empirical model, while in the final section, some concluding remarks and policy implications for SIDS are made.
2 Tourism industry performance in SIDS
In this section, a review of tourism performance in SIDS is provided, using indicators such as the number of visitor arrivals (by air and sea), visitor expenditure, and tourism contribution to GDP, occupancy rates and average lengths of stay. This investigation allows one to place the performance of SIDS in an international context and also to compare their performance over time.
2.1 Tourism performance
The tourist industry in SIDS has grown significantly over the last 16 years. In 2004, total tourist arrivals to SIDS (both air and sea) was estimated at just over 27 million persons compared to approximately 11 million persons in 1988. This translates into a cumulative increase of 145 per cent over the 16-year period or 9 per cent per annum. In
0.00 50.00 100.00 150.00 200.00 250.00 300.00 350.00 2000 2001 2002 %
contrast, during the same period global tourist arrivals grew by a cumulative 98 per cent or 6 per cent per year.
Figure 2 illustrates the remarkable rate of increase in both air and sea visitors over the review period. One will notice that while sea arrivals were below air passenger arrivals for most of the 16-year period, by 2004 the number of passengers using these two modes of transport had converged. There were two key reasons for this trend. First, expansion of air passenger arrivals slowed significantly in the aftermath of September 11th and the Bali bombings in 2002. Therefore, while the average annual rise in air passenger arrivals was 7 per cent between 1988 and 2004, from 2001 to the end of the review period average annual growth was just 0.4 per cent. Second, the cruise market was boosted by the introduction of larger cruise ships that increased the affordability of cruises, the larger number of retired persons in the Organization for Economic Cooperation and Development (OECD) countries, and the addition of many SIDS to the cruise ship itineraries. During the 16-year period, cruise ship arrivals to SIDS rose by 11 per cent per year, with a slowdown after 2001 to 8 per cent per year.
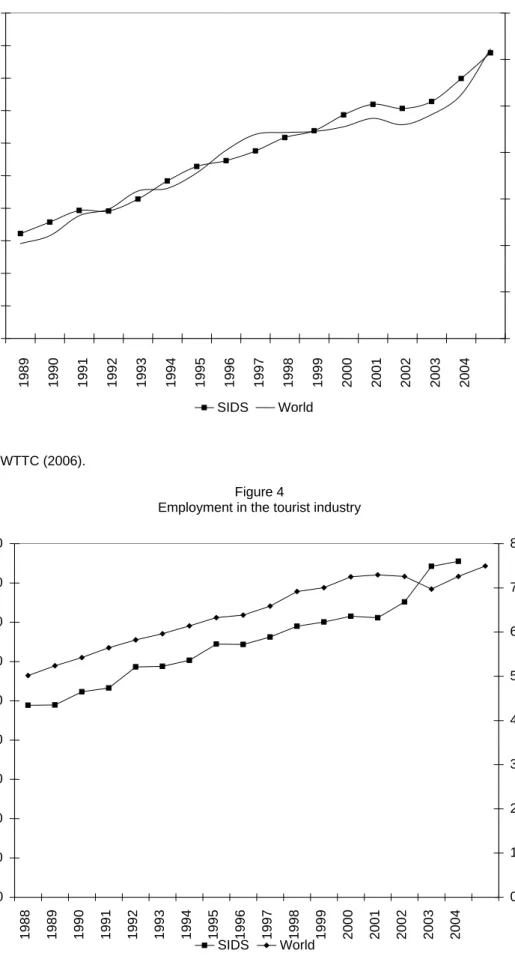
As tourist arrivals to SIDS have expanded, so have earnings from the industry. Figure 3 shows that spending by visitors to SIDS has risen from US$6.4 billion in 1988, to US$17.6 billion in 2004, an average annual rate of increase of about 10.8 per cent; quite similar to the trends for the global travel industry. Consequently, tourism’s direct contribution to gross domestic product (GDP) in these countries has grown from US$3.2 billion in 1988 to US$9.2 billion in 2004, and its direct and indirect contribution has also jumped, from US$6.9 billion to US$18.8 billion.
Figure 2
Total number of air and sea arrivals (1988-2004)
Source: WTO (2006). 0 2 4 6 8 10 12 14 16 198 8 198 9 199 0 199 1 199 2 199 3 199 4 199 5 199 6 199 7 199 8 199 9 200 0 200 1 200 2 200 3 200 4
No. of visitors (milli
ons)
Figure 3 Visitor expenditure
Source: WTTC (2006).
Figure 4
Employment in the tourist industry
Source: WTTC (2006). 0 100 200 300 400 500 600 700 800 900 198 8 198 9 199 0 199 1 199 2 199 3 199 4 199 5 199 6 199 7 199 8 199 9 200 0 200 1 200 2 200 3 200 4 SIDS 0 10000 20000 30000 40000 50000 60000 70000 80000 Wo rld SIDS World 0 2 4 6 8 10 12 14 16 18 20 198 8 198 9 199 0 199 1 199 2 199 3 199 4 199 5 199 6 199 7 199 8 199 9 200 0 200 1 200 2 200 3 200 4 SIDS 0 100 200 300 400 500 600 700 World SIDS World
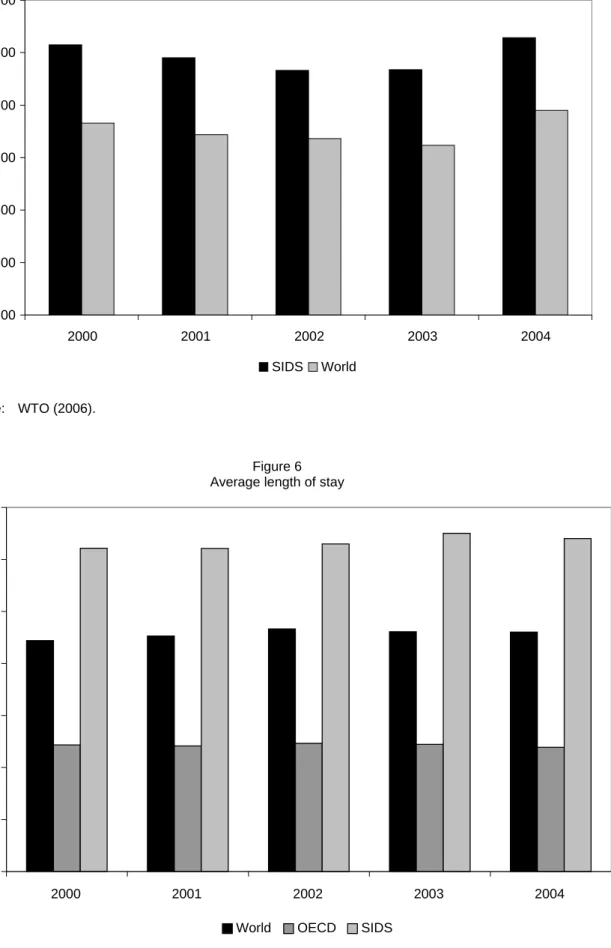
Figure 5 Occupancy rates
Source: WTO (2006).
Figure 6 Average length of stay
Source: WTO (2006). 30.00 35.00 40.00 45.00 50.00 55.00 60.00 2000 2001 2002 2003 2004 % SIDS World 0.000 1.000 2.000 3.000 4.000 5.000 6.000 7.000 2000 2001 2002 2003 2004
The growth of the tourism industry has also generated a significant number of jobs (see Figure 4). The number of persons working in jobs directly related to tourism has risen from 488,000 in 1988, to almost 900,000 in 2004. Given the small size of the labour market in most SIDS, such job growth can substantially reduce unemployment in these countries.
Despite these positive trends, there are still some areas of weakness in terms of the tourism product in SIDS. First, although occupancy rates vary significantly across SIDS, average occupancy rates are relatively low. Between 2000 and 2004, when data are available, average occupancy rates were estimated at 54.7 per cent, compared to 47.6 per cent for the world (see Figure 5). Aruba had the highest average reported occupancy rate of approximately 75 per cent, while Vanuatu and Trinidad and Tobago had rates of 48 per cent and 45 per cent, respectively.
Based on World Tourism Organization data, between 2000 and 2004, the average length of stay by visitors to SIDS was about 5 nights (see Figure 6). In the British Virgin Islands and French Polynesia, average length of stay was around 10 nights, while visitors to New Caledonia, Mauritius, US Virgin Islands, the Cayman Islands and the Bahamas only stayed an average of four nights.
2.2 Trends in major source markets
Analysing the trends in key source markets of tourist arrivals to SIDS can assist in identifying potential reasons for the relatively strong rate of growth in tourist arrivals. Figure 7 presents the SIDS’ share of world arrivals from five key source markets: Africa, the Americas, Europe, East Asia and Pacific and South Asia. Arrivals from the Americas (principally the United States of America and Canada) are the main source markets for island nations. Indeed, SIDS, despite their size, was the destination of choice for, on average, 8.4 per cent of all travellers from the Americas. SIDS share of this market has also been increasing. In 2000, SIDS share of the Americas market was just 7.3, but by 2004, this figure had risen to just under 10 per cent.
The Africa and European markets were also quite strong during the sample period. Although SIDS only account for around 2 per cent of African travel market, this ratio has been expanding. The proportion of African travellers going to SIDS has increased from just 2 per cent in 2000 to 2.8 per cent in 2004, after dipping below 2 per cent in 2002. In the case of Europe, the biggest tourist market in the world at present, island nations have been able to capture on average only 0.85 per cent of this market. Nevertheless, their share has been rising over the review period and was just under 1 per cent in 2004.
The performance of SIDS in the other two markets, East Asia and Pacific and South Asia, was relatively weak. Both regions seemed to have been particularly affected by heightened uncertainty in the aftermath of 9/11. As a result, while SIDS share of the East Asia and Pacific market was 1.43 per cent in 2000, by 2003 this had dipped to as low as 0.79, but rebounded somewhat in 2004 to 1.08. There was also a decline in the South Asian market, but not to the same extent as East Asia and Pacific. Travellers from South Asia fell marginally from 0.58 in 2000 to 0.54 in 2004.
Figure 7
Visitor arrivals to SIDS (percentage of world)
Source: WTO (2006).
Table A1 in the Appendix shows that Mauritius is, by far, the most successful SIDS receiving tourists from Africa, principally due to its proximity to the African mainland. Bahrain, Benin and Togo were the other three lead source markets. In the case of the Americas, Puerto Rico, owing to its ties with the United States, absorbs a large proportion of travel from this source (Table A2). The Bahamas, the Dominican Republic and Jamaica were the other three chief destination countries.
The analysis of trends in arrivals from Europe suggests that the Dominican Republic has also been able to attract a greater number of Europeans to visit the country (Table A3). In 2004, approximately 1.2 million Europeans visited this Caribbean island, by far the largest of all SIDS. The Maldives and Mauritius were other major players in this market. Other than these countries, most SIDS have not been able to fully exploit the European market despite its size. One of the main reasons may be because this market is very price sensitive. In addition, travelling to SIDS is usually quite costly, on account of relatively high airfare and hotel costs.
The East Asia and Pacific market is another unexploited market, mainly due to the costs of travel and lack of direct flights to most SIDS. However, some SIDS, particularly Guam, Fiji and the Northern Marianas Islands, have been successful in the East Asia and Pacific market because of their relative proximity (see Table A4). In 2004, Guam welcomed over one million visitors from East Asia and Pacific, twice the size of its next closest competitor (Northern Marianas Islands).
0.000 2.000 4.000 6.000 8.000 10.000 12.000 2000 2001 2002 2003 2004 %
3 Measuring tourism competitiveness 3.1 Theoretical discussion
Tourism competitiveness is a relative, multidimensional, complex concept when applied to economies and destinations because a range of comparable economic, ecological, social, cultural and political factors determines it. As a result, many definitions and measures of tourism competitiveness, most of which are related but each taking a different viewpoint on the subject and emphasizing several of the above mentioned factors in the process, can be found in the literature. Models that integrate all of the factors include Ritchie and Crouch (2003) and Dwyer and Kim (2003). In these studies, tourism competitiveness is seen as facts and policies that shape the ability of a country to create and maintain an environment that sustains more value creation for its enterprises and more prosperity for its people. However, these fully integrated models are not very practical as appropriate proxies for some factors are not always available, especially for SIDS. The WTTC has recently developed a multifaceted framework that includes relatively accessible factors. The Council has constructed eight separate indices, each of which focuses on a different aspect of tourism performance and the operating environment for tourism enterprise and activity. These eight indices are themselves computed from a series of underlying component indices (see Box 1). These indices are available for over 200 countries, including some of those from the SIDS. The WTTC multidimensional approach is not always possible to calculate, particularly for SIDS where data unavailability and cross-country data differences are more prevalent and pervasive. Also, since this measure has its origin only from 2004, researchers interested in the dynamics of tourism competitiveness would have to seek less demanding alternative methodologies. Consequently, authors like d’Harteserre (2000), Hassan (2000) and Craigwell, Worrell and Smith (2006) have defined competitiveness as the ability of a
Box 1
WTTC tourism competitive component indices
Main indices Component indices
Price competitiveness • Hotel prices, indirect taxes, purchasing power parities Human tourism • Volume and value of inbound and outbound tourism Infrastructure • Roads, railways, water, sanitation
Environment • Population density, CO2 emissions, ratification of international treaties on the environment
Technology • Internet access, telephones, mobile phones, high-tech exports
Human resources • Life expectancy, literacy, enrolment in primary, secondary and tertiary level education, employment in travel and tourism, unemployment, population, gender indicators
Openness • Visa requirements, trade openness, taxes on trade, tourism openness
Social • Human development index, TVs, personal computers, newspapers, crime
destination to maintain its market position relative to its competitors. Buhalis (2000) and Crouch and Ritchie (1999) posit that a competitive position brings prosperity to the residents of the country, although recent studies evaluating the economic contribution of tourism using computable general equilibrium models suggest that rather than playing a catalysing role, the expansion of the tourism industry often ‘crowds out’ other domestic sections, resulting in a transformation of industry composition instead of an increase in economic growth (Dwyer, Forsyth and Spurr 2003; Dwyer et al. 2000; Dwyer and Forsyth 1998; Adams and Parmenter 1992). Measures of tourism competitiveness that reflect these definitions include such variables as visitor numbers, market share, tourist expenditure, employment, valued added by the tourist industry and subjectively measured variables such as ‘richness of culture and heritage’ and ‘quality of the tourism experience’.
Notwithstanding the preceding debate on tourism competitiveness, researchers have become increasingly absorbed with the price of goods and services as the primary yardstick for value in tourism decisionmaking, since data are more readily available for most countries. Earlier studies used exchange rate adjusted expenditures on a similar bundle of goods and services to model tourism price competitiveness in different destinations (see, for example, Martin and Witt 1987 and Edwards 1995). In a major revision, Dwyer, Forsyth and Rao (2000) construct tourism price competitiveness indices for various destinations that account for the travel costs to and from, as well as costs accumulated within these countries. As such, these indices can be employed to assess a country’s price competitiveness from the point of view that visitors originate from different source markets and travel for different purposes. In addition, they can be decomposed into components that reflect relative or absolute influence of the exchange rate changes and domestic inflation rates on destination price competitiveness (Dwyer, Forsyth and Rao 2002). In another paper Dwyer, Forsyth and Rao (2001) extend their work to construct tourism price competitiveness indices with purchasing parity price data to account for international divergences in the price data.
3.2 Empirical evidence
This section uses two readily accessible measures to discuss tourism competitiveness in SIDS. These are the WTTC component indices discussed above (see Box 1) and tourism market share indicators. As stated, the WTTC index is a broad measure of tourism competitiveness that is composed of eight separate indices: price competitiveness; human tourism; infrastructure; environment; technology; human resources; openness; and, social.
An index value of ‘0’ shows the least competitive country and ‘100’ represents the most competitive country. The indices are generated using the United Nations Development Programme’s method, as provided in its human development reports. In this approach, performance (X) is measured by applying the following formula:
i i i i c i c X X X X X min, max, min, , , − − = (1)
Table 1
WTCC’s index of tourism competitiveness
Overall competitiveness index
Antigua and Barbuda 59.85
Aruba 79.61 Bahamas, The 59.80 Bahrain 52.24 Barbados 63.41 Benin 27.58 Bermuda 73.83 Bhutan 30.00 Cape Verde 50.11 Chad 36.68 Comoros 35.03 Cote d'Ivoire 38.13 Dominica 51.79 Dominican Republic 48.36 Fiji 50.42 French Polynesia 63.38 Grenada 57.42 Guam 51.27 Guinea 36.39 Guinea-Bissau 30.80 Guyana 53.68 Haiti 33.50 Jamaica 52.97 Kiribati 19.75 Maldives 52.79 Marshall Islands 4.82 Mauritania 41.15 Mauritius 43.80 Micronesia, Fed. Sts. 7.46 New Caledonia 59.36 Palau 59.95
Papua New Guinea 44.01
Puerto Rico 44.66
Samoa 48.24
Sao Tome and Principe 56.16
Seychelles 59.99
Solomon Islands 38.88
St Kitts and Nevis 58.30
St Lucia 54.99
St Vincent and the Grenadines 57.04
Suriname 41.32
Togo 40.09
Tonga 48.22
Trinidad and Tobago 49.59
Virgin Islands (US) 58.75
SIDS 47.23
OECD 63.09
World 47.06
Table 1 provides an index of overall tourism competitiveness for 45 SIDS in 2004 (the only available year). It reveals that SIDS had an average tourism competitiveness index value of 47.23, which was lower than that of the OECD countries, but slightly above the average for the world. Of the SIDS presented, Aruba and Bermuda had the highest competitiveness scores, while the Marshall Islands and the Federated States of Micronesia were the least competitive.
Most SIDS performed poorly in terms of the technology and social indices. The average SIDS had a technology index score of just 19.83 compared to 77.54 for the OECD countries and 25.6 for the rest of the world. For the social index, SIDS’ average was 33.75, about 48.72 less than in the OECD countries and 4.55 below the world average. These results suggest that SIDS need to invest more funds in technological infrastructural development (internet access, telephone access and mobile technology), as well as to ensure that the benefits from tourism filter down to the poorer members of the society.
Table 2
WTTC’s indices of price competitiveness
Tourism price
competitiveness index Hotel price index
Antigua and Barbuda 21.77 37.58
Aruba – 49.00 Bahamas, The – 41.36 Bahrain 64.90 9.55 Barbados 51.79 26.65 Bermuda – 18.09 Cayman Islands – 25.13 Chad 71.60 30.78 Channel Islands – 15.95 Cote d'Ivoire 80.54 9.78 Dominica 61.29 17.46 Dominican Republic 77.42 12.74 Fiji 20.70 73.35 French Polynesia – 41.45 Guam – 7.86 Guinea 88.62 15.98 Jamaica 42.02 29.61 Mauritania 80.02 26.83 Mauritius 0.00 100.00 New Caledonia – 20.12
Papua New Guinea 88.69 14.26
Puerto Rico – 47.11
St Kitts and Nevis 19.91 59.51
St Lucia 32.76 36.21
Togo 82.09 21.73
Trinidad and Tobago 42.60 18.86
Virgin Islands (US) – 61.06
SIDS 54.51 32.15
OECD 52.18 19.59
As price competitiveness is thought to be one of the most important dimensions in overall competitiveness, Table 2 presents the indices of price competitiveness for 27 SIDS in 2004 (a smaller number of countries due to missing observations). It reveals that SIDS had an average tourism price competitiveness index value of 54.51, which was higher than that for the OECD countries, but below the average for the world (68.28). In terms of price, therefore, SIDS are less competitive than the average country. Of the SIDS depicted, Papua New Guinea and Guinea are the most price competitive, with index values of 88.69 and 88.62, respectively, while Mauritius is the least competitive.
Additionally, the table presents the hotel price index for each of the SIDS, which is also a component of the overall price competitiveness index. For the hotel price index, the higher the index value the greater the hotel room rate. The average hotel price index value for the SIDS was 32.15 compared to 19.59 for the OECD countries and 19.28 for the world. The analysis of the index shows therefore that part of the reason for the price competitiveness result obtained earlier can be traced back to relatively high hotel room rates in SIDS. Of the countries considered, Mauritius had the highest level of hotel room rates, while Guam and Bahrain had the lowest rates.
As mentioned in section 2, another indicator used to measure competitiveness of a tourism destination is market share. However, as Craigwell, Worrell and Smith (2006) point out, evaluating competitiveness through the use of market share indicators is relatively rare in tourism economics, even though a rise in market share is usually associated with a competitive gain. The authors attribute this to the relatively small share of the global market for most tourism destinations. However, this has no impact on the conceptual validity of the measure. Market share indicators are commonly used at the firm level for signs of change in the competitive landscape. It allows one to evaluate how well a firm is doing relative to its competitors. Losses in market share can signal serious long-term problems that require strategic adjustment.
Figure 8 plots SIDS’ global market share from 1988 to 2004. It shows that the share of SIDS of the global travel market is relatively small, less than 2 per cent. In the early half of the review period, 1988 to 1995, there was some growth in the share of world tourists, from 1.6 per cent to about 1.9 per cent. From 1995 onward, however, there has been little or no change in SIDS’ market share of world travel. Indeed, since 2001, SIDS’ market share has actually declined.
Despite lower arrivals, it is possible for a tourism destination to earn more through higher prices. Therefore, as an alternative measure of market share competitiveness, the ratio of visitor expenditure in SIDS to world visitor expenditure is calculated. Figure 9 provides the results. SIDS’ share of global visitor expenditure (2.4 per cent) is relatively larger than their share of world tourist arrivals (1.8 per cent). The trends in visitor expenditure are also quite different from the trends in arrivals. Between 1988 and 1996, visitor expenditure declined to as low as 2.1 per cent, but then levelled off at 2.5 per cent for the remainder of the review period.
The price and market share measures of tourism competitiveness are basically in agreement: SIDS, despite the importance of tourism, do not seem to be as competitive relative to other tourist destinations.
1.000 1.200 1.400 1.600 1.800 2.000 2.200 2.400 2.600 2.800 3.000 1988 1989 1990 1991 1992 1993 1994 1995 1996 1997 1998 1999 2000 2001 2002 2003 2004 % Figure 8
SIDS’ share of global tourist arrivals
Source: WTO (2006).
Figure 9
SIDS’ share of global visitor expenditure 1.000 1.200 1.400 1.600 1.800 2.000 2.200 1988 1989 1990 1991 1992 1993 1994 1995 1996 1997 1998 1999 2000 2001 2002 2003 2004 %
4 Model of tourism competitiveness
Despite the small market size in SIDS, a model that explains variations in tourism market share predicated on the assumption of perfect competition would be inappropriate. This is because tourist destinations are mostly asymmetric, since consumer tastes vary and there is product differentiation. The authors, therefore, use Sutton (1992) as a point of departure, where the key assumption is that firms compete primarily via prices. All variables that are not determined by the producer, exchange rates and transport costs, are treated as exogenous.
For the purposes of this empirical study, a country’s international tourist arrivals (V) is assumed to depend on three key factors: technological advantage (A); industrial organizational advantage (O), and; price advantage (P).
) , ,
(AO P
V =Φ (1)
Amendola, Dosi and Papagni (1993) show that using an ‘evolutionary’ dynamic, the change in a country’s exports, or in the present case, tourist arrivals, from period t – 1 to period t results from deviations in competitiveness conditions in the home country’s tourist industry relative to competing industries abroad:
)} 1 ( * / )] 1 ( ) 1 ( {[ ) 1 ( ) (t −v t− = f E t− −E* t− E t− vi i i i i (2)
where Ei is a vector of variables that influence the competitiveness of the tourist
industry in country i and *
i
E is a weighted average of the competitive conditions in rival countries.
Building on this framework, the authors estimate a panel regression equation of the following form: it it it it it it it RLP TC KY RY AL V V ε β β β β β μ + + + + + + = 1 2 3 4 5 (3) where t it V V
is country i’s share of world tourist arrivals, μ are country-specific effects, RLPit is the relative price, TCit is transport cost, KYit is the capital-output ratio, RYit is
the relative income of country i’s major source markets relative to the income of country j’s major source markets, ALit is relative adult literacy rate and εit is distributed
with mean equal zero and variance given by σi. Each of the relative variables (xitr) is
calculated relative to the weighted average for all SIDS:
⎟ ⎠ ⎞ ⎜ ⎝ ⎛ − =
∑
= − N i i it it r it x N x x 2 1 ) 1 ( λ . (4)where λi are the proportions of arrivals to SIDS accounted for by country i in the year
It is anticipated that tourism market shares will vary inversely with relative price levels and transportation costs (β1, β2 < 0). A positive value for β1 and/or β2 indicates the
validity of the Kaldor paradox. It is expected that the proxy for the technology-gap is positively related to the country’s market share (β3 > 0), since those high-technology
countries would be best able to supply the types of services required by visitors to the island. The relative income and life expectancy variables are also anticipated to be positively associated with market share, as growth in the income of the source market should lead to higher travel expenditure, while a country with a high adult literacy rate is likely to be better able to exploit the benefits of the tourist industry.
4.1 Econometric approach
The estimation of panel data models assumes either fixed effects or random effects specifications. The fixed effects model posits that the ηi, which capture differences in
technological progress across countries, are N fixed unknown parameters. In contrast, the random effects model treats the ηi as random draws from a distribution with mean μ
and varianceση2. Intuitively, the fixed effects model is more appropriate if the individuals cannot be viewed as a random draw from some underlying population, for example, countries, industries, and so on (Verbeek 2000).
The fixed effects specification is therefore used throughout the study. To obtain the fixed effects estimator, one can include a dummy variable (d) for each country in the model, where dij = 1 if i = j and 0 otherwise. Equation (3) is then estimated using
ordinary least squares and the covariance matrix is:
) ( ˆ2 it it E ε ε σε = ′ (5)
One of the principal assumptions of the fixed effects model is that all the variables in Xit
are independent of all εit. This assumption is obviously violated with the inclusion of a
lagged dependent variable. In addition, some variables, such as the capital-labour ratio, may depend on tourist arrivals. If the explanatory variables are not all strictly exogenous, then the coefficient estimates derived from the fixed effects model are biased. However, Nickell (1981) shows that this bias falls as T increases. To correct for this bias, the authors employ an instrumental variable estimator.
4.2 Data
The regressions are estimated from 1988 to 2004 for 45 countries, except for those where the dependent variable is arrivals from the source countries, which use annual data from 2000 to 2004 for 21 countries. The tourism data are obtained from the databases of the WTO and the WTTC. The data on real GDP, gross domestic investment, and prices (GDP deflator) are procured from the United Nations’ National Accounts database,1 The base year in each case is 1990. Air transport costs are
measured as the product of the international price of crude oil and the travelling distance from the source markets of New York, London, and Japan to the capital of each (SIDS) destination. More specifically, in the case of the Asia-Pacific countries, Japan was used, while New York and London were employed for Caribbean countries and African and Middle East states, respectively. The capital-output ratio is measured by the ratio of real
gross investment to real GDP. The adult literacy rate variable, which proxies human development, is sourced from the World Development Indicators CD-Rom (2005). This was the only variable that is available for the sample period and countries.
5 Determinants of tourism competitiveness in SIDS
All regressions are done in the EVIEWS 5.1 statistical software programme. To evaluate the key determinants of competitiveness in SIDS, the authors used as their dependent variable, two measures of competitiveness: the country’s share of world visitor expenditure and the country’s share of world tourism value-added. Before one can estimate Equation (3) with panel regression techniques, the variables must be integrated of the same order to avoid obtaining spurious results.
Table 3 presents the results of the panel unit root tests. The Breitung (2002) test suggests that all the variables are stationary, except for AL. In contrast, the Levin, Lin and Chu and the Im, Pesaran and Shin tests indicate only the dependent variable and the adult literacy rate are stationary at classical levels of testing. Given the conflicting results of the tests, the authors analyse the correlogram for each country and these show that all the variables are indeed stationary in levels.
Equation (3) can now be estimated by the method of OLS and 2SLS, the latter accounts for endogeneity of some of the explanatory variables. The results for the model using visitor expenditure are provided in Table 4. The regression estimates using OLS and 2SLS are quite similar. The relative price variable (RLP) is positive and statistically significant, providing evidence of the Kaldor paradox in the tourism industry of SIDS. In other words, more expensive destinations are able to obtain a larger share of global spending. In line with a priori expectations, the travel cost variable is negative and statistically significant, indicating that the farther the destination from the major airports (New York, London or Tokyo), the less competitive is the country. The capital-output (KY) ratio is negative, which could suggest that most of the investment taking place in SIDS is not directly aimed at increasing tourism capacity. Indeed, this investment may be ‘crowding out’ tourism investment. Relative income is, however, positive and statistically significant, an indication that faster growth in a country’s source markets is the principal source of competitive gains in SIDS. Fluctuations in this variable are, unfortunately, not under the control of the island nation and, therefore, can add to the vulnerability of their tourist industries. The final variable considered is a measure of human capital development in SIDS: adult literacy. The estimated coefficient on this variable had the correct a priori sign, but was statistically insignificant. This does not, however, imply that greater human capital investment does not aid in increasing competitiveness. It could, inter alia, imply that the short-run gains are small; however, in the long run the benefits of having a well-trained labour force could be larger.
Table 3 Panel unit root tests
Levin, Lin and Chu Breitung Im, Pesaran and Shin
∑
i i T T / -2.177** -1.880* -1.317* RLP 13.300 -1.823** 7.182 TC – – – KY 12.729 -15.326** 0.740 RY 0.480 -1.498* 1.482 AL -12.591** 3.377 -4.844**Note: ** and * indicate significance at the 5 and 10 per cent levels of testing, respectively.
Table 4
Determinants of tourism competitiveness in SIDS (Dependent variable = share of visitor expenditure)
OLS 2SLS RLP 0.251 (0.099)** 0.397 (0.118)** TC -0.557 (0.117)** -0.477 (0.117)** KY -0.277 (0.064)** -0.383 (0.076)** RY 0.760 (0.174)** 0.839 (0.181)** AL 0.218 (0.275) 0.212 (0.289) 2 R 0.144 0.158 σ 0.001 0.001 Observations 480 434
Notes: Standard errors are given in parentheses below coefficients.
** and * indicate significance at the 5 and 10 per cent level of testing, respectively.
Table 5 uses the share of world tourism value-added as the dependent variable instead of visitor expenditure. The results are broadly similar to those obtained earlier, that is, the principal sources of fluctuations in the competitiveness of SIDS are changes in travel cost and relative income of source markets.
Table 6 presents the regression estimates for the three major source markets (the Americas, Europe and Asia-Pacific) for 21 SIDS for the shorter sample period of 2000 to 2004 owing to data limitations. The results vary according to source market. For the Americas, the key determinants of changes in tourism competitiveness are relative prices, the capital-to-income ratio and relative income. In contrast, relative prices are the main determinants of fluctuations in tourism competitiveness (market share) in the European market, while the cost of travel and relative income are the key explanatory variables for the Asia-Pacific market.
Table 5
Determinants of tourism competitiveness in SIDS (Dependent variable = share of tourism value-added)
OLS 2SLS RLP 0.078 (0.016)** 0.118 (0.029)** TC -0.134 (0.027)** -0.138 (0.029)** KY -0.070 (0.016)** -0.095 (0.019)** RY 0.181 (0.041)** 0.189 (0.044)** AL 0.079 (0.024) 0.059 (0.070) 2 R 0.133 0.140 σ 0.000 0.000 Observations 496 434
Notes: Standard errors are given in parentheses below coefficients.
** and * indicate significance at the 5 and 10 per cent level of testing, respectively. Table 6
Determinants of tourism competitiveness in SIDS for major markets (Dependent variable = arrivals from particular source market)
Americas Europe Asia-Pacific
RLP 0.187 (0.098)* 0.042 (0.018)** 0.007 (0.008) TC -0.047 (0.797) 0.008 (0.015) 0.021 (0.007)** KY -0.001 (0.000)** -0.013 (0.009) -0.008 (0.005) RY 0.464 (0.144)** 0.042 (0.026) -0.060 (0.013)** AL 0.006 (0.300) -0.000 (0.000) 0.022 (0.036) 2 R 0.124 0.067 0.336 σ 0.003 0.001 0.001 Observations 84 75 60
Notes: Standard errors are given in parentheses below coefficients.
** and * indicate significance at the 5 and 10 per cent level of testing, respectively.
6 Conclusions and policy recommendations
The immense economic and social value of the tourism industry to SIDS cannot be overstated. Indeed, tourism is widely viewed as the main engine of real output growth and a significant contributor to foreign exchange earnings and employment. This study, therefore, seeks to investigate both the nature and determinants of tourism competitiveness in SIDS, with the intention of outlining policy prescriptions for the enhancement of its competitive position in these small island developing states. First, various indices of tourism competitiveness are calculated for 45 SIDS (for the year
2004), covering the price, human, infrastructural, environmental, technological, openness and social aspects. This exercise provides a holistic view of the tourism industry in SIDS. In addition, an empirical model that examines the key determinants of tourism market share (proxied by two measures: the shares in global tourism expenditure and global tourism value-added) is specified and estimated.
With regard to the indices of competitiveness, the overall competitive position of SIDS is below that of developed countries, but slightly higher than the global level. In particular, SIDS are uncompetitive in terms of price (particularly, the price of accommodation). The estimated price index of hotel accommodation is almost twice the comparable values for developed countries and the world. Indeed, when one considers that the cost of accommodation represents the bulk of overall tourism expenditure (a conservative estimate could be as much as two-thirds), then relatively expensive room rates can retard overall price competitiveness, unless these destinations can successfully rationalize high prices with high value of product and service.
In addition, the paper finds that SIDS lag considerably in the areas of technological and social development. Hence these countries require higher levels of investment for the development of the technological infrastructure (telecommunications technology), and more importantly that the economic gains from tourism are spread to the lower-income households.
Another key indicator examined is the size and change in the share of each destination in the global tourism market, in terms of the number of annual visitor arrivals and expenditure. In the case of tourist arrivals, SIDS’ share of the global tourism market has remained at around 2 per cent over the period analysed and has actually declined moderately since 2001. On a positive note, the share of visitor expenditure in SIDS relative to world visitor expenditure is not only larger relative to the measure using the visitor arrivals, but also appears to be trending upwards. However, taking both the price and market share measures of competitiveness together indicates that SIDS are not competitive relative to other tourism destinations examined.
The estimated results of the model of tourism competitiveness imply that the determinants of tourism market share depend on the origin of the tourist. At one time or another, relative source income, relative prices, cost of travel and capital-to-output ratio are found to be key explanatory factors in the regression estimates. The empirical results using either the share of visitor expenditure or value-added in the world market as the dependent variable suggest a positive relationship between relative price and market share, providing evidence of the Kaldor paradox, which suggests that the more expensive destinations are able to obtain a larger share of global tourism spending. Although unlikely in most SIDS, this result could potentially occur in those countries that successfully target the upper-end of the tourism market. In addition, relative income (of the source country to destination) is positively related to market share, implying that an increase in real incomes in the source countries is expected to, ceteris paribus, add impetus to an expansion in overall market share, primarily through increased visitor arrivals. However, this depends critically on the destination at least maintaining its competitive position in that particular source market. The exogenous nature of this variable, however, signifies its limited capacity to be viewed as a key policy (target) variable in SIDS. This does not preclude its importance in the calculus of decisionmaking, since wide fluctuations in this variable could significantly increase the
The cost of airline travel (travel cost) is found to be negatively related to market share, which indicates that the farther the destination from the source market, the less competitive that destination is likely to be. This is not a surprising finding. For quite some time tourism planners in SIDS have faced considerable challenges with respect to cost of boosting airline capacity. These challenges have forced tourism officials to be highly creative in their marketing campaigns to try to offset as much as possible the high transportation cost that can intensify in an environment of volatile oil prices and other geopolitical risks. One possible avenue would be to offer discounts on airfare, accommodation, and accompanying attractions. The drawback to such a programme, however, is its costliness. In the case of Barbados, when the negative impacts of the September 11th attacks dampened tourism, the ‘best of Barbados’ campaign was launched in key tourist markets. This discount programme was mainly responsible for the rebound in tourist arrivals during that difficult period. Another interesting result was that the estimated sign on capital-output ratio variable was found to be negative, suggesting that the majority of the investment in SIDS may not be necessarily improving the competitiveness of the industry. This could very well mean that tourism investment is being crowded out by investment in other areas of the economy. In this regard, governments could make available financing arrangements for tourism establishments.
Unfortunately, but not surprisingly, the findings of this study highlight the difficulties (from a macroeconomic perspective) of designing appropriate policies and strategies to enhance tourism competitiveness in SIDS. In particular, price and income considerations, given their predominantly exogenous nature, are not easy to control, but must nevertheless be explicitly taken into account in any policy aimed at improving tourism competitiveness. For instance, the volatility of international oil prices over the past two years and its resultant impact on production, domestic prices and the balance of payments is a case in point.
How can governments of SIDS insulate the economy from such shocks and their impact on the competitiveness of tourism? In view of tourism’s importance to sustaining national long-term economic and social goals, governments of SIDS must seek out every avenue possible to control the price of key tourism inputs, most critically energy, as well as improve existing infrastructure and focus on human resource development. Indeed, essential non-traded inputs (such as energy and other utilities, telecommunications, and business services) must be appropriately priced so as not to restrict the improvement in the competitive position of tourism. This involves, inter alia, a rationalization of the tax structure to ensure that these inputs are not burdened by high taxation. In addition, governments of SIDS can seek to create comparable investment incentives for future development of the tourism plant. In the case of human resource development, governments can provide incentives wherever possible to encourage various training in hospitality and a shift in specialization in tertiary-level and university level education. Notwithstanding the limited budgets available for tourism planners in SIDS and the numerous challenges, planners will have to be creative in their marketing and promotional strategies to efficiently rationalize price and quality to maintain market share.
References
Adams, P., and B. Parmenter (1992). The Medium Term Significance of International Tourism in the Australian Economy. Canberra: Bureau of Tourism Research
Amendola, G., G. Dosi, and E. Papagni (1993). ‘The Dynamics of International Competitiveness’. Weltwirtschaftliches Archiv, 129: 451-71.
Breitung, J. (2002). ‘Nonparametric Tests for Unit Roots and Cointegration’. Journal of Econometrics, 108 (2): 343-63.
Buhalis, D. (2000). ‘Marketing the Competitive Destination in the Future’. Tourism Management, 21 (1): 97-116.
Craigwell, R., D. Worrell, and S. Smith (2006). ‘The Competitiveness of Selected Caribbean Tourism Markets’. Paper presented at the 2006 Annual Review Seminar of the Central Bank of Barbados. Bridgetown, Barbados.
Crouch, G. I., and J. R. B Ritchie (1999). ‘Tourism, Competitiveness, and Societal Prosperity’. Journal of Business Research, 44 (3): 137-52.
D’Harteserre, A. (2000). ‘Lessons in Managerial Destination Competitiveness in the Case of Foxwoods Casino Resort’. Tourism Management, 21 (1): 23-32.
Dwyer, L., and P. Forsyth (1998). ‘Estimating the Employment Impacts of Tourism to a Nation’. Tourism Recreation Research, 23 (2): 3-12.
Dwyer, L., and C. Kim (2003). ‘Destination Competitiveness: Determinants and Indicators’. Current Issues in Tourism, 6 (5): 369-414.
Dwyer, L., P. Forsyth, and P. Rao (2000). ‘The Price Competitiveness of Travel and Tourism: A Comparison of 19 Destinations’. Tourism Management, 21 (1): 9-22. Dwyer, L., P. Forsyth, and P. Rao (2001). ‘PPP and the Price Competitiveness of
International Tourism Destinations’. Paper presented at the Joint World Bank-OECD Seminar on Purchasing Power Parities, 30 January-2 February. Washington, DC. Dwyer, L., P. Forsyth, and P. Rao (2002). ‘Destination Price Competitiveness:
Exchange Rate verses Domestic Inflation’. Journal of Travel Research, 40 (3): 328-36.
Dwyer, L., P. Forsyth, and R. Spurr (2003). ‘Inter-Industry Effects of Tourism Growth: Implications for Destination Managers’. Tourism Economics, 9 (2): 117-32.
Dwyer, L., P. Forsyth, J. Madden, and R. Spurr (2000). ‘Economic Impact of Inbound Tourism under Different Assumptions about the Macroeconomy’. Current Issues in Tourism, 3 (4): 325-63.
Edwards, A. (1995). Asia-Pacific Travel Forecasts to 2005. London: Economist Intelligence Unit.
Hassan, S. (2000). ‘Determinants of Market Competitiveness in an Environmentally Sustainable Tourism Industry’. Journal of Travel Research, 38: 239-245.
Hadri, K. (2000). ‘Testing for Stationarity in Heterogeneous Panel Data’. The Econometrics Journal, 3: 148-61.
Im, K. S., M. H. Pesaran, and Y. Shin (2002). ‘Testing for Unit Roots in Heterogeneous Panels’. Orlando/Cambridge/Edinburgh: University of Central Florida, University of Cambridge and the University of Edinburgh. Mimeo.
Kao, C., and M. H. Chiang (2000) ‘On the Estimation and Inference of a Cointegrated Regression in Panel Data’. Advances in Econometrics, 15: 179-222.
Levin, A., C. F. Lin, and C. S. J. Chu (2002). ‘Unit Root Tests in Panel Data: Asymptotic and Finite- Sample Properties’. Journal of Econometrics, 108 (1): 1-24. Markusen, J. (1992). Productivity, Competitiveness, Trade Performance and Real
Income: The Nexus Among Four Concepts. Ottawa: Supply and Services Canada. Martin, C. A., and S. F. Witt (1987). ‘Tourism Demand Forecasting Models: Choice of
Appropriate Variable to Represent Tourists’ Cost of Living’. Tourism Management, 8: 223-45.
Nickell, S. (1981). ‘Biases in Dynamic Models with Fixed Effects’. Econometrica, 49: 1417-26.
Ritchie, J. R. B., and G. Crouch (2003). The Competitive Destination: A Sustainable Tourism Perspective. Walllingford: CABI Publishing.
Sutton, J. (1992). Sunk Costs and Market Structure. Cambridge, MA: MIT Press
Verbeek, M. (2000). A Guide to Modern Econometrics. Sussex: John Wiley and Sons Ltd.
World Bank (2005). World Development Indicators, 2005. CM-Rom. Washington, DC: World Bank.
WTO (World Travel Organization) (2006). Compendium of Tourism Statistics, 2006 Edition. Madrid: WTO.
WTTC (World Travel and Tourism Council) (2006). Tourism Satellite Accounting. Available at: www.wttc.org/eng/WTTC_Research/Tourism_Satellite_ Accounting_ Tool/ index.php .
Appendix
Appendix Table A1 Arrivals from Africa (‘000 persons)
Country 2000 2001 2002 2003 2004
Antigua and Barbuda – – – – –
Aruba – – – – – Bahamas, The 2 1 1 1 1 Bahrain 32 39 47 60 76 Barbados 1 1 1 1 1 Benin 50 50 49 149 148 Cape Verde 4 3 10 5 10 Chad 13 17 8 5 – Comoros 16 12 9 6 6 Grenada – – – 1 1 Guinea 13 18 22 19 18 Guinea-Bissau 2 – – – Jamaica 1 1 1 1 1 Maldives 2 2 3 4 5 Mauritius 164 168 172 174 175 New Caledonia 1 1 1 – 1
Sao Tome and Principe 1 3 – – –
Seychelles 14 14 14 14 13
Togo 30 34 29 31 44
Trinidad and Tobago 1 1 1 1 1
Virgin Islands (US) – – 1 – –
SIDS 345 367 369 472 501
World 16,508 17,757 19,199 19,111 17,914
Appendix Table A2
Arrivals from Americas (‘000 persons)
Country 2000 2001 2002 2003 2004
Antigua and Barbuda 107 107 108 113 129
Aruba 670 643 595 585 665 Bahamas, The 1,407 1,418 1,406 1,393 1,455 Bahrain 121 139 177 192 200 Barbados 278 256 275 292 301 Benin 5 1 1 1 1 Bermuda 287 241 244 222 236 Bhutan 3 2 2 2 4 Cape Verde 2 2 2 2 1 Cayman Islands 327 310 282 272 242 Chad 8 5 6 4 – Dominica 57 54 58 61 67 Dominican Republic 1,153 1,239 1,261 1,494 1,592 Fiji 63 68 69 69 – French Polynesia – 107 72 89 86 Grenada 62 66 77 80 77 Guam 42 43 43 – 47 Guinea 4 4 3 4 4 Guyana 96 89 95 91 111 Haiti 128 129 127 125 91 Jamaica 1,109 1,083 1,076 1,120 1,162 Kiribati 1 1 1 – – Maldives 7 7 7 8 9 Marshall Islands 2 2 2 2 2 Mauritius 8 8 7 8 8 Micronesia, Fed. Sts. 9 7 8 8 8 New Caledonia 2 2 2 2 2
Northern Mariana Islands 52 35 36 35 37
Palau 7 5 5 5 7
Papua New Guinea 7 6 7 5 5
Puerto Rico 2,501 2,635 2,230 2,471 2,754
Samoa 9 9 9 9 8
Sao Tome and Principe 1 – – –
Seychelles 6 7 4 3 4
St Kitts and Nevis 45 59 60 – –
St Lucia 168 165 175 183 197
St Vincent and the Grenadines – 51 58 60 67
Suriname 8 3 4 7 45
Togo 2 2 2 2 3
Tonga 8 7 8 8 8
Trinidad and Tobago 309 286 308 324 347
Virgin Islands (US) 533 541 494 531 561
SIDS 9613 9845 9406 9882 10543
World 130,757 125,931 121,691 115,562 107,998
Appendix Table A3 Arrivals from Europe (‘000 persons)
Country 2000 2001 2002 2003 2004
Antigua and Barbuda 90 78 82 99 113
Aruba 47 45 44 55 60 Bahamas, The 104 94 79 92 83 Bahrain 216 235 256 260 334 Barbados 262 247 219 234 246 Benin 40 36 21 25 25 Bermuda 36 29 31 26 26 Bhutan 142 146 147 141 143 Cape Verde 101 122 106 135 136 Cayman Islands 24 21 19 19 16 Chad 21 32 15 10 – Comoros 7 7 9 8 11 Dominica 11 11 10 11 – Dominican Republic 1,283 1,142 1,031 1,249 1,270 Fiji 52 51 65 72 French Polynesia – 84 76 80 80 Grenada 46 40 39 43 36 Guam 2 1 1 – 2 Guinea 14 13 12 17 16 Guinea-Bissau – 4 – – – Guyana 7 9 8 8 9 Haiti 11 11 11 8 4 Jamaica 200 182 180 219 243 Kiribati – – – – – Maldives 362 364 373 443 476 Mauritius 440 438 452 466 477 New Caledonia 34 28 33 32 30
Northern Mariana Islands 2 1 1 – –
Palau 1 1 1 1 2
Papua New Guinea 5 5 5 4 5
Samoa 6 6 5 5 5
Sao Tome and Principe 4 4 – – –
Seychelles 105 103 108 100 99
St Kitts and Nevis 15 11 – – –
St Lucia 99 83 76 90 97
St Vincent and the Grenadines 19 18 17 19
Suriname 46 49 54 74 87
Togo 25 18 24 24 30
Tonga 6 4 4 4 3
Trinidad and Tobago 83 89 71 79 90
Virgin Islands (US) 12 9 6 8 16
SIDS 3961 3872 3692 4158 4289
World 466,014 452,822 455,205 460,555 457,662 Source: WTO (2006).
Appendix Table A4
Arrivals from East Asia and Pacific (‘000 persons)
Country 2000 2001 2002 2003 2004 Bahamas, The 16 11 8 6 7 Bahrain 107 135 187 212 268 Barbados 2 2 2 4 3 Benin 1 – – – – Bermuda 1 1 1 1 1 Bhutan 1 1 1 1 1 Cape Verde – – – – – Cayman Islands 2 2 1 1 1 Chad – 2 1 – – Dominican Republic 3 2 1 2 2 Fiji 178 226 262 288 – French Polynesia – 36 40 42 45 Grenada 1 1 1 1 1 Guam 1,231 1,077 984 – 1,069 Guinea 1 2 2 2 2 Jamaica 11 9 8 9 8 Maldives 73 69 77 84 100 Marshall Islands 3 3 3 4 5 Mauritius 24 24 25 22 27 Micronesia, Fed. Sts. 10 7 9 9 10 New Caledonia 72 70 68 65 66
Northern Mariana Islands 474 407 437 423 495
Palau 49 46 52 61 84
Papua New Guinea 43 40 39 46 48
Samoa 71 73 75 78 85
Seychelles 3 3 3 2 2
Suriname 2 1 1 1 –
Togo 1 1 1 1 3
Tonga 21 21 24 28 29
Trinidad and Tobago 4 4 3 3 3
Virgin Islands (US) 1 – – – –
SIDS 2406 2276 2316 1396 2336
World 168,239 175,029 189,029 175,596 215,444