Citation: Wonders, Martin (2016) Activity Recognition in Monitored Environments using utility Meter disaggregation. Doctoral thesis, Northumbria University.
This version was downloaded from Northumbria Research Link: http://nrl.northumbria.ac.uk/31614/
Northumbria University has developed Northumbria Research Link (NRL) to enable users to access the University’s research output. Copyright © and moral rights for items on NRL are retained by the individual author(s) and/or other copyright owners. Single copies of full items can be reproduced, displayed or performed, and given to third parties in any format or medium for personal research or study, educational, or not-for-profit purposes without prior permission or charge, provided the authors, title and full bibliographic details are given, as well as a hyperlink and/or URL to the original metadata page. The content must not be changed in any way. Full items must not be sold commercially in any format or medium without formal permission of the copyright holder. The full policy is available online: http://nrl.northumbria.ac.uk/policies.html
Activity Recognition in Monitored
Environments using utility Meter
disaggregation
M A Wonders
PhD
2016
Activity Recognition in Monitored
Environments using utility Meter
disaggregation
Martin Anthony Wonders
A thesis submitted in partial fulfilment
of the requirements of the
University of Northumbria at Newcastle
for the degree of
Doctor of Philosophy
research undertaken in the
Faculty of Engineering and Environment
1
Declaration
I declare that the work contained in this thesis has not been submitted for any other award and that it is all my own work. I also confirm that this work fully acknowledges opinions, ideas and contributions from the work of others.
Any ethical clearance for the research presented in this thesis has been approved. Approval has been sought and granted by the Faculty Ethics Committee, January 2012.
I declare that the Word Count of this Thesis is 45,556 words excluding references, table of contents, table of figures and title pages.
Name: Martin Wonders
Signature:
2
Abstract
Activity recognition in monitored environments where the occupants are elderly or disabled is currently a popular research topic and is being proposed as a possible solution that may help maintain the independence of an aging population within their homes, where these homes are adapted as monitored environments. Current activity recognition systems implement ubiquitous sensing or video surveillance techniques which inherently, to varying degrees, impinge on the privacy of the occupants of these environments. The research presented in this thesis investigates the use of Ubiquitous sensors within a smart home setting with a view to establishing whether activity recognition is possible with a reduced, less intrusive subset of sensors that can be realised using utility meter disaggregation techniques. The thesis considers the selection of sensors as a feature selection problem and concludes that data produced from water, electricity and PIR sensors contribute significantly to the recognition of selected activities. With an established method of activity recognition that implements a reduced number of sensors it can be argued that occupants of the monitored environment maintain a greater level of privacy. This level of privacy, however, is dependent on such systems being practically implementable into homes that are designed to assist and monitor the residents, and as such configuration and maintenance of these systems are also considered here. The utility meter disaggregation technique presented proves to perform exceptionally well when trained with large quantities of data, but gathering and labelling this data is, in itself, an intrusive process that requires significant effort and could compromise the practicality of such promising systems. This thesis considers methods for implementing synthesised, labelled training data for both disaggregation and activity recognition systems and shows that such techniques can significantly reduce the quantity of labelled training data required. The work presented shows a significant contribution, in the areas of sensor selection and the use of utility meter disaggregation for activity recognition, and also the use of synthesised labelled training data to reduce significant system training times. The work is carried out using a combination of publicly available datasets and data collected from a purpose built smart home which includes water and electricity meter disaggregation. It is shown that a system
3 for non-intrusive monitoring within an ambient environment, occupied by a single resident, is achievable using repurposed versions of the standard domestic infrastructure. More specifically it is demonstrated that a minimum baseline accuracy of 93.45% and F1-measure of 91.22 can be achieved using disaggregation at the water and electricity meters combined with locality context provided by home security PIR sensors. Methods of speeding up the deployment and commissioning process are proven to be viable, further demonstrating the potential practical application of the proposed system.
4
Acknowledgements
I would like to express my sincere appreciation to Prof. Fary Ghassemlooy for his patience and guidance through the early stages of this research. Without his encouragement at the beginning this work would never have been started. I would also like to thank Prof. Ahmed Bouridane for his guidance during the final year of the research, without which, this work would never have seen the light of day.
I also owe a debt of gratitude to Prof Alamgir Hossain for the encouragement and conviction of striving for the highest standards in the publication of research.
Finally I would like to thank Dr Graham Sexton for over 15 years of constant, professional, guidance and support that have culminated in the production of this thesis.
5
Publications
“Training with synthesised data for disaggregated event classification at the water meter”, Expert Systems with Applications, Volume 43, pp. 15-22.
“Sensor selection for Human Activity Recognition in ambient environments using a Hybrid feature selection technique.”, to be submitted to IEEE Intelligent Systems.
“Human Activity Recognition using disaggregation at the utility meters.” to be submitted to Expert Systems with Applications.
“Synthetic Minority Oversampling using Gaussian Mixture Models to balance training data in Human activity recognition.”, to be published to IEEE Computational Intelligence.
6
Table of Contents
Chapter 1 Introduction ... 12
1.1 The Research Aims ... 14
1.2 Challenges in the field of Activity Recognition ... 16
1.2.1 Insufficient labelled data ... 16
1.2.2 Intra and inter-class variations... 17
1.2.3 Multiple Occupancy ... 18
1.2.4 Privacy ... 18
1.3 Thesis structure and contributions ... 19
Chapter 2 Background ... 23
2.1 Definitions used in HAR... 23
2.2 Classes of Activity ... 25
2.3 Approaches to HAR ... 26
2.3.1 Recognition of physical activity ... 27
2.3.2 Activity recognition using environmental sensors ... 30
2.3.3 Sensors and Activity definitions ... 40
2.4 Human Activity Recognition Summary ... 43
Chapter 3 Machine Learning for HAR ... 44
3.1 Machine Learning ... 45
3.1.1 Supervised Learning ... 47
3.2 Machine learning analysis framework ... 58
3.2.1 Data collection ... 59
3.2.2 Data pre-processing and Segmentation... 62
3.3 Machine Learning Evaluation and Performance Metrics... 66
3.4 Summary of machine learning in HAR ... 69
Chapter 4 Feature Selection for HAR ... 70
4.1 Feature Selection ... 71
4.1.1 Filter Methods ... 73
4.1.2 Wrapper Methods ... 74
4.1.3 Embedded Methods ... 74
4.2 Algorithm Evaluation ... 79
4.2.1 Algorithm Evaluation (Balanced dataset) ... 80
4.2.2 Algorithm Evaluation (Unbalanced dataset) ... 82
7
4.3.1 Feature selection analysis (Balanced dataset) ... 85
4.3.2 Feature selection analysis (Unbalanced dataset) ... 86
4.4 Summary and Conclusion of Feature Selection for Activity Recognition ... 90
Chapter 5 Repurposed Smart Meters ... 92
5.1 Using a water meter as sensors ... 93
5.1.1 Related Work ... 93
5.1.2 Synthesising labelled training data ... 96
5.1.3 Comparison of ANN, SVM and KNN algorithms ... 97
5.1.4 Artificial Neural Networks (ANN) ... 97
5.1.5 Support Vector Machine (SVM) ... 98
5.1.6 K-Nearest Neighbours (KNN) ... 100
5.1.7 The problem with labelled training data ... 100
5.2 Evaluation of Machine Learning Algorithms for water meter Disaggregation ... 101
5.3 Learning with synthesised training data ... 108
5.4 Experimental Results and Discussion ... 111
5.5 Summary and Conclusion of Repurposed smart meters ... 115
Chapter 6 HAR using sensor Fusion ... 117
6.1 Activity recognition in an Ambient Environment... 118
6.2 The Reduced Sensor set ... 123
6.2.1 Data Collection ... 124
6.2.2 Data pre-processing and feature selection ... 126
6.3 The chosen activity set ... 126
6.3.1 Activity segmentation ... 128
6.4 Evaluation of Machine Learning algorithms ... 129
6.4.1 The addition of temporal features ... 133
6.4.2 Using disaggregated water data ... 136
6.5 Balancing training data with synthesis ... 138
6.5.1 Synthetic Minority Over-sampling (SMOTE) ... 138
6.5.2 Model evaluation using data from SMOTE ... 139
6.6 Summary of Activity Recognition using sensor Fusion ... 144
Chapter 7 Conclusions and future work ... 146
7.1 Future work ... 149 References 150
8
List of Figures
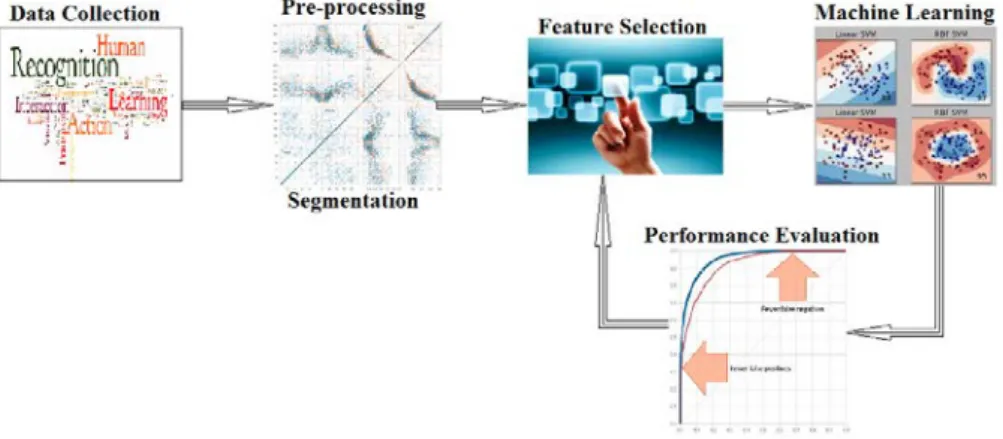
Figure 3.1: Off-line Machine Learning Framework. ...58
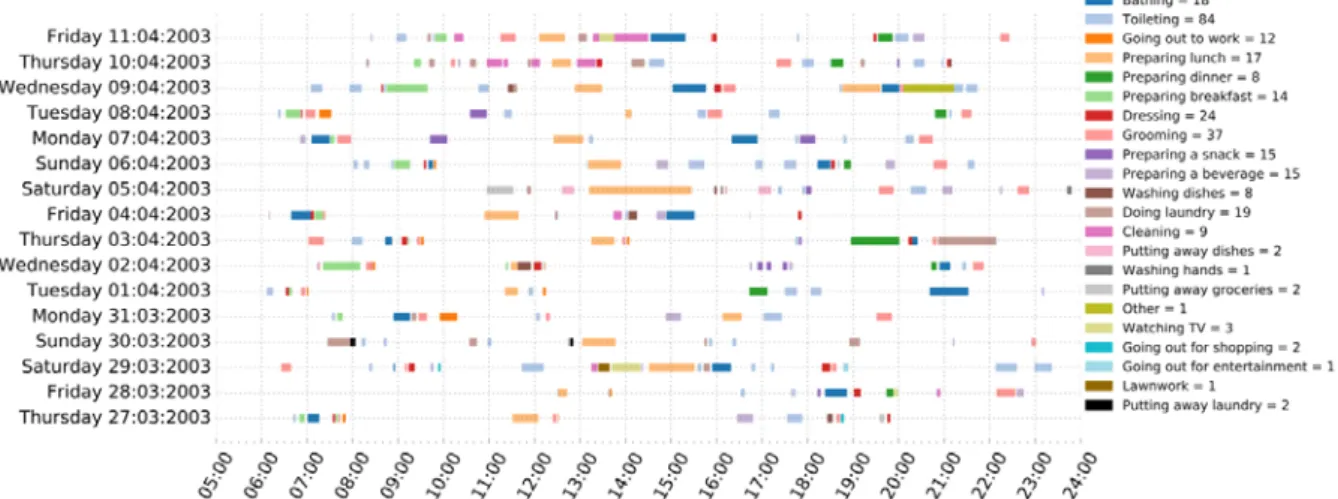
Figure 3.2 Daily activities generated from the Tapia Data set. Data Source (Tapia, et al., 2004) .64 Figure 3.3 Daily activities generated from the CASAS Dataset. Data Source (Cook & Schmitter-Edgecombe, 2009) ...64
Figure 4.1: Activity counts for balanced dataset. Data source: (Crandall & Cook, 2008). ...80
Figure 4.2: Activity counts before and after reduction. Data source (Tapia, et al., 2004) ...82
Figure 4.3 Logistic Regression with L1 penalty. Data Source (Cook & Schmitter-Edgecombe, 2009) ...84
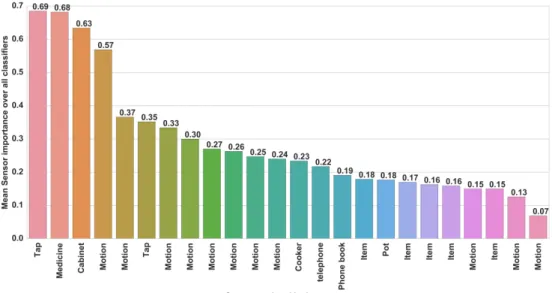
Figure 4.4 Mean Sensor Importance. Data Source (Cook & Schmitter-Edgecombe, 2009) ...85
Figure 4.5 Sensor Importance SVM with linear kernel. Data Source (Tapia, et al., 2004) ...87
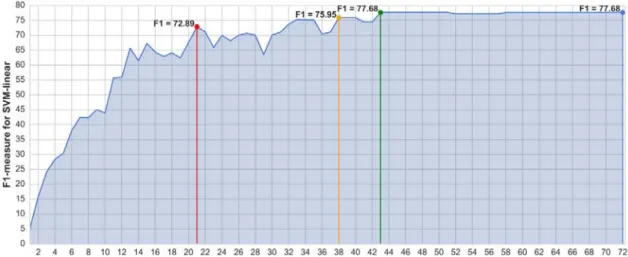
Figure 4.6 Sensor subset Performance SVM with linear kernel. Data Source (Tapia, et al., 2004) ...88
Figure 4.7 Sensor subset Importance. Data Source (Tapia, et al., 2004) ...88
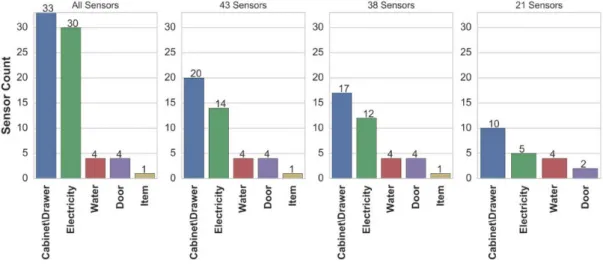
Figure 4.8 Sensor subset counts - SVM with linear kernel. Data Source (Tapia, et al., 2004) ...89
Figure 4.9 Electrical sensors from the 38 sensor subset. Data Source (Tapia, et al., 2004) ...89
Figure 5.1 Flow event signature representing combined toilet flush and wash basin usage. ...101
Figure 5.2 Precision chart for SVM, ANN and KNN classifiers ...106
Figure 5.3 Recall chart for SVM, ANN and KNN classifiers ...107
Figure 5.4 F1 chart for SVM, ANN and KNN classifiers ...107
Figure 5.5 Accuracy chart for SVM, ANN and KNN classifiers ...108
Figure 5.6 Precision chart using synthesised training data. ...111
Figure 5.7 Recall chart using synthesised training data. ...112
Figure 5.8 F1 chart using synthesised training data....112
Figure 5.9 Accuracy chart for synthesised training data. ...113
Figure 5.10 Screen shot from online water disaggregation meter ...114
Figure 6.1: Ambient environment floor plans showing only those sensors used in the study. ...120
Figure 6.2: PIR and ground truth, water meter sensor counts for 7 week monitoring period ...123
Figure 6.3: Electrical sensor counts for 7 week monitoring period ...123
Figure 6.4: Sample of an XML file showing a single Microwave event. ...124
Figure 6.5: Comma-separated value files showing Light, Activity and PIR data. ...125
Figure 6.6: Sample of an XML file showing a single en-suite wash basin event. ...125
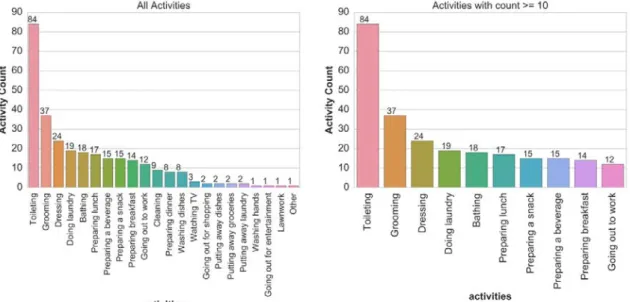
Figure 6.7 Activities chosen and counts over the monitoring period ...127
Figure 6.8 Gantt chart of ground truth activity labels over the 7 week monitoring period. ...128
Figure 6.9: Training and Test set spit of activities. ...130
Figure 6.10: Test set confusion matrix for the SVM classifier using a linear kernel. ...131
9 Figure 6.12: Confusion matrix for the Random Forest classifier using gini as the split criterion. ...132 Figure 6.13: Confusion matrix for the AdaBoost, DT classifier using entropy as the split criterion. ...132 Figure 6.14: Activity counts at each hour of the day for the entire dataset. ...133 Figure 6.15: Confusion matrix for the SVM classifier using a linear kernel and an "Hour of Day" feature. ...134 Figure 6.16: Confusion matrix for Logistic Regression classifier using an L2 penalty and an "Hour of Day" feature. ...135 Figure 6.17: KNN water meter sensor counts for 7 week monitoring period. ...136 Figure 6.18: Confusion matrix for Logistic Regression classifier using an L1 penalty and using water disaggregation with a KNN classifier. ...137 Figure 6.19: Parallel coordinate plot showing sensor counts for each activity in the training set. ...139 Figure 6.20: Parallel coordinate plot showing sensor counts for each activity after SMOTE data synthesis of training data. ...140 Figure 6.21: Confusion matrix for Logistic Regression classifier using an L2 penalty and water disaggregation and SMOTE. ...141 Figure 6.22: Confusion matrix for a linear SVM classifier using water disaggregation and SMOTE. ...142 Figure 6.23: Gantt chart showing 18 days of ground truth activity data used for algorithm testing. ...143 Figure 6.24: Gantt chart showing 18 days of activity data as predicted by the LR classifier using an L2 penalty, trained on data that was balanced using SMOTE, where water utility data was produced using KNN disaggregation. ...144
10
List of Tables
Table 2.1: List of activities and group classifications (Atallah, et al., 2011) ...28
Table 3.1 Sample of data from (Tapia, et al., 2004)...60
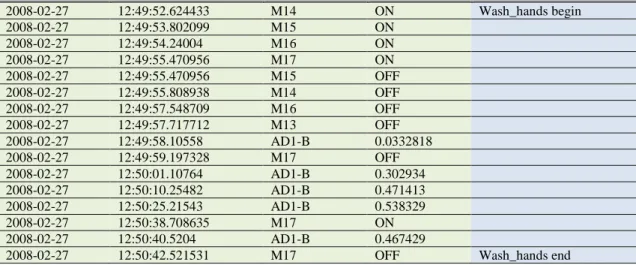
Table 3.2 Sample of data from (Cook & Schmitter-Edgecombe, 2009) ...61
Table 3.3 Sensor count representation of sample data from (Tapia, et al., 2004) ...65
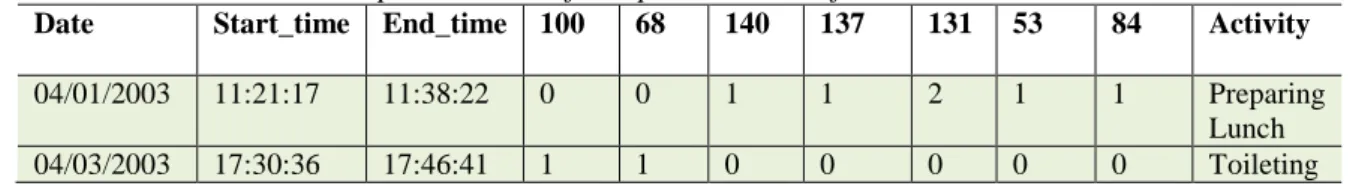
Table 3.4 Sensor count representation of sample data from (Cook & Schmitter-Edgecombe, 2009) ...66
Table 4.1 Machine Learning classifier performance: Data source (Crandall & Cook, 2008) ...81
Table 4.2 Machine Learning classifier performance. Data source (Tapia, et al., 2004) ...83
Table 4.3 Classifier performance using sensor subset. Data source (Crandall & Cook, 2008) ....86
Table 5.1 Event name and quantity of clean events captured ...102
Table 5.2 Sample values that make up the majority of the 376 features of a shower event. ...103
Table 5.3 SVM kernel accuracy using 2-fold cross validation and 100 features ...104
Table 5.4 ANN accuracy using 2-fold cross validation and 100 features...105
Table 5.5 KNN Accuracy using 2-fold cross validation and 100 features ...105
Table 5.6 Summary of best performing model trained and tested with real data ...105
Table 5.7 Event type with the quantity of original real events, and the quantity of synthesised events synthesised from only 2 of the extreme data points from originals. ...110
Table 5.8 Summary of the best performing model trained with synthesised data and tested with real data. ...111
Table 6.1: Sample of labelled activity data using sensor count as features. ...126
Table 6.2: Machine learning model evaluation using activity data collected over 7 weeks. ...130
Table 6.3: Machine learning model evaluation with added “Hour of Day” feature. ...134
Table 6.4: Machine learning model evaluation using activity data with disaggregated water data using a KNN classifier. ...137
Table 6.5: Machine learning model evaluation using training data synthesised using the SMOTE technique. ...141
List of Acronyms
Activities of Daily Living (IADL), 25 Ambient Intelligence (AmI), 14 Artificial Neural Network (ANN), 21
Centre for Advanced Studies in Adaptive Systems (CASAS), 32 Decision Trees (DT), 49
Dynamic Bayesian Network (DBN), 73 False Negatives (FN), 67
Feature Space Remapping (FSR), 39 Finite State Machines (FSM), 42 Hidden Markov models (HMMs), 32 Human Activity Recognition (HAR), 13 Intel Next Unit of Computing (NUC), 119 K-Nearest Neighbours (KNN), 100 Logistic Regression (LR), 49
Managing An intelligent Versatile (MAV), 34 Markov Chains (MCs), 32
Message Queuing Telemetry Transport (MQTT), 119 Mobile and Pervasive Computing Laboratory (MPCL), 31 Multi Home Transfer Learning (MHTL), 38
Naïve Bayes (NB), 35
National Health Service (NHS), 12 Radial basis function (RBF), 99
Radio Frequency Identification (RFID), 31 Random Forests (RF), 49
Regularised Logistic Regression (RLR), 76 Support Vector Machine (SVM), 21
Synthetic Minority Over-sampling (SMOTE), 118 television (TV), 35
True Negatives (TN), 66 True Positives (TP), 66 voice over IP (VOIP), 32 water closet (WC), 101
12
Chapter 1
Introduction
According to a report commissioned by Ofcom in 2010 (Lewin, et al., 2010), there were around 1.8 million people with moderate to severe disabilities in the UK, with 72% of these aged 65 or above. The same report predicts that the requirements for health care within the home will increase by 16% over the next 20 years. The 2015 key issues for parliament report (Young, 2015) states that between 2015 and 2020 the general population of the UK is expected to rise by 3%, the population of people over 65 is expected to increase by 12%, the population of people over 85 by 18% and the population of people aged 100 or above by 40%. Currently from an estimated UK population of around 61 million, 11.5 million people are of pensionable age and 4 million are living alone. As the UK population ages these numbers are expected to increase and will undoubtedly put a substantial strain on care providers, whether formal i.e. National Health Service (NHS) or informal i.e. family, friends or neighbours. According to a 2009 Help the Aged report (Help The Aged, 2009)an increase in divorce rates, as well as smaller family units and the increased global mobility in family members, will make it much more difficult to maintain the current input from those involved in informal health care.
Technology in the domestic environment is proposed as one of the strategies that can help to minimise the impact, as well as maintain the independence of an ageing population, and by incorporating more and more computational technology to produce smarter living environments, there exists the potential to provide more flexible assisted living spaces for people with the special needs that come with age or disability. Many of the studies carried out in this area, for example (Kumar & John, 2016), (Benmansour, et al., 2016), (Cook & Krishnan, 2015), (Steinhauer, et al., 2010) and (Logan, et al., 2007) focus around the use of ubiquitous sensitised spaces or video based surveillance and use activity recognition systems to interpret the data. These methods are generally intrusive and require expensive computational input as well as a high level of deployment impracticality.
The aim of this research is to investigate a system for non-intrusive monitoring of the elderly, or those with special needs, that can potentially form a practical implementation of use within assisted living environments that can aid in Human Activity Recognition (HAR) and so monitor
13 the behaviour of a resident. The proposed system incorporates a method of sensor fusion that implements disaggregation techniques, at both the water (Froehlich, et al., 2009) and electricity meters (Gupta, et al., 2010), to infer the activities of the inhabitants. The data from each meter is complemented with contextual, temporal data from movement sensors positioned in each room. Such a system can be implemented by utilising more computationally advanced versions of existing components of the home infrastructure, for example an unobtrusive monitoring system can be created by repurposing, the meter points and standard alarm system sensors with minimal disruption to the occupant. The advantages of the proposed system include reduced implementation time and effort, as the existing utility meter upgrade is the only requirement in terms of sensors used. Reduced training times as synthesis of training data reduces the quantity of labelled data required from the environment, this in turn leads to less invasive systems.
HAR has emerged as an active area of research over the past decade and finds context in many applications and fields such as video surveillance (Lin, et al., 2008), Human Computer Interaction (Zhang, 2012), health care (Zhu & Sheng, 2011) as well as personal proactive health monitoring (Zhang & Sawchuk, 2013). The purpose of any activity recognition system is to recognize the actions of an agent from a series of sensor observations using computational intelligence. For example in the work produced by (Lin, et al., 2008) the actions are categorised as walking, running, fighting, active and inactive, the agent in this system is a Human and the sensor observations are a sequence of frames taken from short video clips. By contrast in the research produced by (Zhang & Sawchuk, 2013) the agent is again a human and the activities are walk forward, walk left, go upstairs, jumpetc. but the sensor observations are taken from a three axis accelerometer, a three-axis gyroscope, and a three-axis magnetometer. Specifically these systems of activity recognition are referred to as HAR systems and are a multidisciplinary branch of activity recognition research that leverage the fields of sensor systems, ubiquitous computing, data mining, machine learning and data analysis with the aim of inferring the specific activity of the human in question. Once inferred, this activity can be used in the specific context of an application for example in (Lin, et al., 2008) the application context may be to determine whether there is a breach of security on a premises. The application context in (Zhang, 2012) could be to
14 interact with a computer software application or game. The context in (Zhu & Sheng, 2011) could be to determine if an elderly person is in need of assistance or in (Zhang & Sawchuk, 2013) it could be to inform the user of their calorific output throughout the day.
It follows that HAR system can be viewed as just one part of a more general ambient environment (Emiliani & Stephanidis, 2005) dedicated to the field of assisted living. Ambient environments take advantage of the ever increasing use of small scale, low cost sensing, computing, and network equipment to create computational intelligence within the environments that work with the occupant to enhance their daily lives. A fundamental aspect of ambient environments, based on the description and definition provided by (Juan Carlos Augusto, 2007) where the term Ambient Intelligence (AmI) is used, is that they are designed and built to interact with the inhabitant or user of the environment and thus there is an inherent requirement to establish and monitor the activities of that user.
An example high level design of an AmI system is described by (Augusto, et al., 2010) and places the HAR system (pose/activity and detection) within a processing layer between a sensor network and a middleware tier that indicates a level of knowledge accumulation, validation and user input.
1.1
The Research Aims
The previous section provided a brief, high level overview that placed the role of HAR systems within the more general field of ambient intelligent systems, and the high-level reasoning and visualisation components shown in (Augusto, et al., 2010) hint at a dependency or relationship to the use-case of a particular system. For example the activities to be recognised for a security system may be fundamentally different from the activity requirements for an ambient assisted living environment and so the context of the use case is of fundamental importance when developing and evaluating such systems.
One method of establishing a use-case context is to consider a combination of what is termed the “Context Quintet” (Brooks, 2003) of “when”, “where”, “what”, “who” and “why”:
15
• When: Temporal awareness, a system maintains some representation of time and seeks to record when events and activities occur, e.g. each event within the system may be represented by a time stamp of the interactions between the agents and the system.
• Where: Agent localisation, a system has some sense of location of the agents that interact
with it, either geographically or within predetermined bounds such as a map or floor plan.
• What: Activity Recognition, a system has the means to determine the activities of the agents; the activities will often be drawn from a predetermined set of activities based on the system use-case.
• Who: Identity Awareness, a system is able to identify the main agents that interact with it and determine the significance of that interaction based on the identification.
• Why: As stated in (Brooks, 2003), this is perhaps the most difficult element of a system to determine and refers to the ability of a system to understand intention, however here it will be defined as the underlying intention for the system by the designers i.e. its purpose (why) in recognising a particular activity (what), at a particular time (when), by an agent (who) in an ambient environment (where).
This thesis is primarily concerned with the “what” and the “when” of the context quintet, but these elements do not provide context without some input from the remaining quintet and indeed the scope is significantly narrowed by the thesis aim. In general the aim of this research is to investigate, develop and evaluate a system for non-intrusive monitoring within an ambient environment (the “where”) occupied by a single elderly occupant (the “who”), to recognise the activities (the “what”), and hence offer a system solution in the area of assisted living (the “why”), that is more practically deployable than systems that are currently proposed. Specifically the research seeks to investigate the use of Ubiquitous sensors within a smart home setting with a view to establishing whether activity recognition is possible with a reduced, less intrusive subset of sensors that can be realised using utility meter disaggregation techniques. The research considers the selection of sensors as a feature selection problem and with an established method of activity recognition that implements a reduced number of sensors it can be argued that occupants of the monitored environment maintain a greater level of privacy.
16
1.2
Challenges in the field of Activity Recognition
Recognising human activity from data produced by sensors in an ambient environment has many challenges. These challenges manifest in the ability to train HAR systems on quality labelled training data that is relevant to the sensors in the environment and also the complexity and stochastic nature of human activity. For HAR systems to be useful in practice they will need to be deployed in real environments with minimum disruption to the occupants while maintaining an ability to respond effectively to useful data produced by that environment. These systems should require the minimum of system training, configuration and tuning and should be flexible enough to adapt to the occupants and moreover, accepted as usable by those occupants. What follows is a more detailed discussion of some of these challenges:
1.2.1
Insufficient labelled data
HAR systems use classification of data from sensors to detect activities within the assisted living environment. Although machine learning is the most common technique in the literature, and will be discussed in detail in the chapters that follow, rule based systems have also been proposed with some degree of success (Bae, 2014), (Storf, et al., 2009). Rule based systems require domain knowledge to establish the rules and so suffer from the same period of pre-monitoring that is a requirement of machine learning systems and so are not considered here.
In order to train the models used for classification with machine learning, there is a requirement for reasonable quantities of accurately labelled training data that reflect the activities of the environment that it is used in. This labelled training data may be required at each level of human motion, as described in chapter 2, for example an HAR system using a video camera may need labelled training data to determine if the current series of frames represents an event caused by the movement of the occupant turning on the cooker. At the next level, labelled training data is required to learn a generalisation of the activity instances that represent the activities that are the focus of the HAR system in question, for example the various sequences of previous level events that signify the activity of “cooking” will need to be learned from numerous labelled sequences of such an activity taking place, and at the next level there may be a requirement for the HAR
17 system to model habitual patterns of behaviour, and so may require labelled training data to determine the patterns that signify the cooking of breakfast, Lunch and dinner over a weekly cycle lasting a year. In laboratory environments the most common methods of collecting labelled training data use hand labelling techniques (Tapia, et al., 2004), (Crandall & Cook, 2008), (Fishkin, et al., 2005). This is not a practical approach for useful deployment in an assisted living environment as it indicates a need for long term annotation of data by a combination of the commissioning engineer and the resident. Any deployed system that is reliant on data that is labelled by the resident, even if the resident is meticulous and the annotation is highly accurate, will suffer from an imbalance in labelled data. That is to say that; those activities that are rare will be underrepresented in the learned model (He & Garcia, 2009). The system proposed here uses a novel method of data synthesis that alleviates the need for long periods of data capture and labelling by using synthesis of labelled training data at both utility meter and at the activity recognition stage.
1.2.2
Intra and inter-class variations
When classifying human activity, challenges manifest when activity instances of the same class can have sensor signals that appear in a different order in the sequence, appear a varying number of times or do not appear at all in some instances but do in others. This is referred to as Intra-class variations and was studied by (Rashidi & Cook, 2009) in the context of HAR, and is also evident when sensors deployed from environment to environment have different viewpoints or variations in the way the occupants carry out the same activity in different ways. Problems also exist when differentiating between instances of different activity classes; these are referred to as Inter-class variations and were also studied by (Rashidi & Cook, 2009), and are defined by a lack of variation between sensor sequences of different activity classes. Such similar sequences can often confuse a machine learning algorithm, particularly if it is trained with limited labelled data and the activity is represented by a large number of features (Friedman, 1997), ultimately resulting in the misclassification of the activity. Ideally an HAR system should be designed to minimise Intra-class variations and maximise Inter-class variations.
18
1.2.3
Multiple Occupancy
When an environment is occupied by more than one person the sophistication of the HAR learning system will need to increase exponentially for each extra occupant, if each occupant’s event sequence for each activity differs significantly (Crandall & Cook, 2009). There are three aspects to this particular challenge, one of which relates directly to Intra class variations, where each occupant may perform the same activity using different variations in the sequence of actions that define that activity, thus suggesting that the HAR system must be trained on each activity for each occupant. Another aspect to this challenge is that of collaborative engagement in an activity where multiple occupants cooperate to share the actions that make up an activity sequence. The final aspect is when an environment has multiple active occupants, where the actions of each occupant and hence the movement events sensed for each occupant will occur in parallel and so these actions become interleaved, the challenge here is to associate each sensor signal with the action of the occupant that triggered it.
1.2.4
Privacy
Privacy is a common concern and remains a challenge to the practical implementation of HAR systems. Privacy is defined by the Oxford English Dictionary (Anon., 2007) as “The state or condition of being alone, undisturbed, or free from attention”. Clearly the very aim of HAR systems is to recognise and monitor the actions of people in an ambient environment, so they are inherently designed to observe and hence infringe on the privacy of the occupants. In a review of future applications in dementia care by (Bharucha, et al., 2009) the authors state that ‘the very systems that are designed to promote independence require varying degrees of privacy impingements’.
There are several means for collecting movement data within HAR environments that can be arranged into two main categories; vision-based systems and sensor-based systems (Chen, et al., 2012). Out of these two categories, vision-based systems raise the most concerns over the violation of the occupant’s privacy (Magnusson & Hanson, 2003). This is especially the case if the occupants have no control over the video devices. This does not mean that sensor-based
19 systems, with no visual element, are accepted entirely but there seems to be a granularity in the type of movement data that is perceived as either highly sensitive or generic (Garg, et al., 2014). In the research conducted by (Garg, et al., 2014) the results suggest that the 101 elderly residents were reluctant to share highly sensitive information unless there was an explicit utility for sharing this information, the example provided is when the activity data is used to indicate an alert if a resident falls. The study concludes that very specific and explicit needs, fulfilled by HAR systems, could well outweigh the privacy concerns indicated.
1.3
Thesis structure and contributions
This research makes contributions in the following areas:
• A significant contribution is made and the thesis hypothesis is validated by showing comparable activity recognition using a reduced sensor set that is represented by movement, electrical appliance and water usage. A novel feature sub selection algorithm is demonstrated that uses embedded feature selection followed by wrapper sub selection using backward elimination. This contribution is in the process of adaptation for publication.
• A published contribution was made (Wonders, et al., 2016) which demonstrates a technique for synthesis of labelled training data for use with machine learning algorithms when disaggregating at the water meter.
• A significant contribution is made in the development of an environment using disaggregation at the utility meters and motion sensors to infer the activities of the inhabitant. Published work on such a system of activity recognition is not available at the time of writing and the work is in the process of adaptation for publication.
A summary of the contents of each chapter follows highlighting the areas where the contributions are discussed.
20 Chapter 2: Background Information and Literature Review
Chapter 2 introduces the definitions that underpin the fundamental concepts in the field of Human Activity Recognition. A three tier hierarchical representation of human activity is suggested using relevant literature from the field and a context has been provided that relates these three tiers to computational classification of human behaviour. The challenges in activity recognition, as defined in section 1.2, are highlighted within a review of common approaches to human activity recognition and separated into two distinct fields that utilise either body worn sensors or environmental sensors. The chapter concludes by defining the computational representation of movement events, activities and behaviour for use by activity recognition algorithms.
Chapter 3: Machine learning for Human Activity Recognition
Chapter 3 discusses the privacy challenge faced for Human Activity Recognition Systems and positions this challenge in the context of HAR in ambient environments, indicating why activity recognition using binary sensors may be a more acceptable and practical method for use in assisted living applications. The underpinning principles of Machine Learning are introduced as the dominant technology in the field with supervised learning and classification being highlighted as the dominant techniques. Examples of how supervised algorithms have been used and their performance for activity recognition to date are provided. A Machine Learning analysis framework is introduced for use throughout the remainder of the thesis and data pre-processing is discussed with a view to justifying the use of simple features that relate transparently to the sensors of interest, that relate directly to the key aims of the thesis, as provided in section 1.1. The chapter introduces two publicly available datasets as generated in studies by (Tapia, et al., 2004) and (Crandall & Cook, 2008) chosen as they go some way to highlighting some of the challenges in the field relating to the quantity of labelled training data and the stochastic and unbalanced nature of human activity data. The metrics used for evaluation of classification results are discussed in light of these challenges with more enlightening metrics being suggested to provide more realistic comparisons of algorithm performance.
21 Chapter 4: Feature Selection for activity recognition
Chapter 4 describes the analysis of two data sets that was carried out with a view to determine those sensors that contribute most to the performance of Machine Learning classification models that perform well on the publically available, Human Activity, datasets used. The concept of feature selection is discussed and definitions of three common feature selection methods are introduced. These methods are reviewed in terms of appropriate use for sensor selection and a novel hybrid feature selection method, that suits the purposes of Activity recognition in ambient environments, is proposed. Six classification algorithms are evaluated using appropriate tools and on the selected, publicly available datasets with the significance of the results discussed. The performance of the proposed feature selection strategy is evaluated and appropriate visualisations produced throughout. The chapter is summarised with a discussion of the results and confirming that, using the (Tapia, et al., 2004) dataset the number of sensors can be reduced from 72 to 43 with no reduction in classifier performance. This chapter forms a significant contribution as it validates the thesis hypothesis with comparable activity recognition using a reduced sensor set that is represented by movement, electrical appliance and water usage. This work is in the process of adaptation for publication.
Chapter 5: Repurposed Smart Meters
Chapter 5 proposes and demonstrates a method of water disaggregation at the meter point using a purpose built water meter and compares the classification accuracy of Artificial Neural Network (ANN), Support Vector Machine (SVM) and K-Nearest Neighbors (KNN) classifiers on predicting the fixture responsible for an event. A method of disaggregation using both labelled data, collected over a two month period, and synthesised data generated from only two extreme examples per class are evaluated. The chapter is a significant contribution to the field of activity recognition as for such HAR systems to be practical, the implementation and training times of the upstream disaggregation system must also be practical. The chapter demonstrates that by using synthesised data, automatically generated by algorithms developed from knowledge of the domain, that training times for water meter disaggregation can be reduced to minutes rather than hours or days. An accuracy of 84.97%, is comparable to that of (Chen, et al., 2005), (Fogarty, et
22 al., 2006), (Froehlich, et al., 2009), (Srinivasan, et al., 2011), (Larson, et al., 2012), (Nguyen, et al., 2013a), and (Nguyen, et al., 2013b), however these systems rely on real data for training and calibration resulting in significant limitations in terms of time and access to occupants of the environment under study.
Chapter 6: HAR using Sensor Fusion
Chapter 6 describes the development of an ambient environment and the experimentation and evaluation of a Human Activity recognition system that implements the fusion of utility meter disaggregation and movement sensor data for activity classification. Using supervised classification algorithms and single occupancy activity data, collected over a period of 28 days, a base line evaluation of classification performance is documented using “bag of words” sensor counts as the features. These baseline performance results are then compared to those achieved when a temporal feature is added to the feature vector. Both baseline classification results and those obtained with the addition of temporal data are achieved using ground truth labels for water meter disaggregation, therefore the evaluation is repeated using labels provided through classified water disaggregation and compared with the baseline. The chapter concludes with the presentation and demonstration of the effect of using data synthesis of training data at the activity level to balance unbalanced datasets and so avoid training bias toward majority activity labels. This chapter forms a significant contribution as published work on such a system of activity recognition that implements fusion of disaggregation at the utility meters is not available at the time of writing. The work is in the process of adaptation for publication.
23
Chapter 2
Background
This chapter outlines the underpinning definitions from the field of activity recognition as used in the relevant research literature. In order to establish a common language for discussion, the chapter begins by defining three levels of human motion as used in the context of the research aims and identifies relevant activity classes based on the literature in the field. The main challenges in the field of activity recognition, as described in Chapter 1, are further pointed out in a literature review and related to the aims of the research. Common approaches to Activity recognition are discussed with a view to the evaluation of how appropriate they are to the fulfilment of the research aims. The chapter concludes by defining the data representation of sensor output for computational detection of activities and behaviour.
2.1
Definitions used in HAR
Within the field of HAR and ambient environments several terms are used extensively to describe the hierarchical characterisation of human activity, the definition of these terms varies depending on the sensors and the environment under discussion. The work by (Bobick, 1997) is prominent in the field for providing some early work on human activity, and provides useful definitions based on the concept of the machine perception of human motion where it is hierarchically categorised by movements, activities, and actions. Here the definitions provided by (Bobick, 1997) are used with the exception of the term “behaviour”, the definition of which is taken from the work carried out by (Hull, 1943). A definitive description of each level of human motion is provided and followed up with a definition for the classes of activity that are commonly used in the field.
Level 1 - Human Movement: At the atomic level of human motion lies movement, this motion
is characterised by body movements with no temporal or contextual element. Movements are defined by (Bobick, 1997) as being consistent, in terms of execution, from one instance to the next. In video based HAR “the pixel-based description of the motion under different possible viewing conditions is the only knowledge required to see the movement” (Bobick, 1997), for
24 example the motion required to “turn on a tap” may have little variation from one person to the next. In an environment that implements ubiquitous sensors the simple actuation of a sensor is the only knowledge required to see the movement, for example a sensor designed to detect the turning on of a tap detects the same motion from one individual to the next.
Level 2 - Human Activity: The next level of human motion is the activity; (Bobick, 1997)
defines this as a combination of “statistical sequences of movements” and states where “The motion is no longer a single, primitive, consistent movement”. Instances of the same activity may have sequences of movements that are ordered differently or there may be more or less movements in the activity across instances. There is also a temporal element to an activity that may have variations between, and during movements across instances. The instance variations across an activity introduce uncertainty that may or may not be modelled statistically, depending on the activity in question. Following from the example provided in the definition of a movement; the activity of “bathing” is a sequence of movements that can have numerous instance variations in terms of sequence and time. The “bathing” activity will probably involve the “turn on a tap” movement but may include one or two taps in a different order and over varying durations of time. This example further illustrates that seeing a sequence of movements can provide context to the movement in question, for example a sequence of video frames could be used to detect the “turn on tap” movement just after detecting the “enter bathroom” movement followed by the “insert bath plug” movement. In this case the simple atomic movement in question, “turn on tap” is given context by the movements before and after.
Level 3 - Human Behaviour (Action): In the definitions used by (Bobick, 1997) the highest
level human motion is described as an action, the description of which seems to overlap that of activity with the addition of high level causal reasoning. For the purposes of this thesis a more intuitive notion of human motion, that includes causal reasoning and encapsulates a sequence of activities, is provided by (Hull, 1943). In the book, Principles of Behaviour, Hull describes animals as “aggregations of need” and the behaviour required to alleviate a particular need is conditioned on the environment at the time of need. (Hull, 1943) Further defines behaviour as an
25 “innate molar response” that consists of a sequence of actions, often formed from habit. This particular high level definition of movements suits the purposes of this thesis well, as when the conditions within an environment developed for assisted living can be controlled, (Hull, 1943) suggests that human behaviour, brought on by a specific need, in such an environment may be deterministic and thus could be generalizable and classified. Note that here we substitute the term “action” in the definition provided by (Hull, 1943), with the previously defined term; activity. An example of behaviour as a sequence of activities formed from habit and involving causal reasoning could be the behaviour of taking a bath on a Friday before dinner.
2.2
Classes of Activity
Much of the research carried out in HAR requires definitions and terms based around the activities being detected by that system, the sensors used, the applied models, and the ultimate aim of the system. As a result there is commonly a divergence of disparate terminology, labelling and structure of data across the research field and It follows that not all of the research can be generalised for comparison with past, current and future work. The terms used in this field do vary somewhat, but are generally drawn from the work produced in (Lawton & Brody, 1988) where the Instrumental Activities of Daily Living (IADL) was defined for use in clinical practice as part of a comprehensive assessment to determine the functional ability of elderly patients in the home. The IADL scale defines 8 categories of functional measurement; Ability to use the telephone, Shopping, Food preparation, Housekeeping, Laundry, Mode of Transportation, Responsibility for Own Medications and ability to handle finances, each of these domains include a number of assessment activities. It can be seen from the list of activities and domains defined in this scale that some of the general definitions may be difficult to measure with a sensor based environment, and it may be difficult to ethically determine an inhabitant’s ability to handle finances using current HAR techniques. These types of scales are also designed for use as an assessment tool with a requirement for a skilled assessor to make judgements regarding the performance of a task by the patient/inhabitant and so often do not translate well to the automated world of software and sensors. In light of the difficulties in adapting these scales to the recognition of activities using computational methods with limited sensor capabilities, this work
26 will propose a method of pre-monitoring of an environment to determine the activities that are carried out during the normal daily routine of a resident. This is justifiable as there are no current agreed activity set definitions for comparison across studies and it should be noted that the views of the researcher are reflected in the work by (Krishnan, et al., 2013) , where it is argued that in order for significant progress to be made in human activity recognition research, there is a need for standardisation of the definitions used so that studies can be repeated and research data scaled and adapted across disparate environments.
2.3
Approaches to HAR
The problem of HAR can be defined as the classification of the computational perception of movement data produced by sensing devices that are focused on that human movement. That is, the aim of an HAR system is to map the raw data provided by the sensing devices, either vision-based, sensor-based or both, onto a class label taken from a set of activity labels. This section provides an overview of some of the literature in the field of HAR with a focus on the challenges mentioned in chapter 1. The literature in the field of HAR points to two main areas for the location of sensors; Sensors that are located on the body and used to determine the physical activity of the wearer as described in (Aminian, et al., 1999), (Najafi, et al., 2003), (Parkka, et al., 2006), (Atallah, et al., 2011), (Liu, et al., 2012) and (Anjum & Ilyas, 2013) as well as sensors that are located in the environment and are used to detect environmental movement and interaction, (Cook, et al., 2003), (Hayes, et al., 2008), (Cook, et al., 2009), (Augusto, et al., 2010), and (Lee, et al., 2013). It should be stressed at this point that the review of physical activity using body worn sensors is included to provide an overall background to the thesis, and to provide context and continuity in terms of the challenges faced in the field; however the aims of the thesis remain in the area of activity recognition using environmental sensors. In the category of vision-based systems, video cameras have been used to provide a combination of physical activity recognition data (Brand & Kettnaker, 2000), (Ke, et al., 2013) and environmental movement and interaction data (Nguyen, et al., 2003), (Ayers & Shah, 2001), however the focus of this thesis is in part based around tackling the challenge of privacy using
27 activity recognition systems and so sensor based systems are preferred to those using video data for activity classification.
2.3.1
Recognition of physical activity
Physical activity was defined by (Caspersen, et al., 1985) as; “any bodily movement produced by skeletal muscles that results in energy expenditure.”, the authors went on to categorise physical activity in daily life into occupational activity, sports activity, conditioning activity, household activity or other activity. By using suitable sensing devices that can detect or measure, skeletal muscle movement or energy expenditure there is a potential to detect human physical activity and use this for activity recognition. It should be noted that in the following literature review the terminology used by the authors of the publications is maintained within the review, however with reference to the definitions provided in section 2.1 the first level of human motion; “movement” is interchangeable with the term “activity” used throughout the reviews. This is justified as quite often the aim of physical activity recognition is to classify the particular movement of the subject within the situational context, for example sitting, standing or walking.
An early study carried out by (Aminian, et al., 1999) to determine what was termed “daily physical activities” implemented two accelerometers, one attached to the chest to measure vertical acceleration and another attached to the thigh to measure horizontal acceleration. The study focuses on the activities of lying, sitting, standing and treadmill walking. The reported results indicate a misclassification error of 10.7%. It is interesting to note that the authors state that reducing the number of sensors to include only the chest sensors increases the misclassification error and claim that two sensor sites may provide optimum classification for the chosen activity classes.
In contrast to the suggestions made by (Aminian, et al., 1999) the research produced by (Najafi, et al., 2003) implemented a single chest worn device to detect the physical activities of sitting, standing, lying and walking. The study was carried out in the context of assessment for activities of daily living and behaviour monitoring. The three sensors consisted of two accelerometers which measured the vertical and horizontal velocity of the subject and a gyroscope which
28 measured the angular velocity through the sagittal plane. The authors report that by using vertical displacement for the detection of transitional movements improved results from previously reported studies, when combined with vertical acceleration data. The research is interesting because of the use of a single body worn device, where the authors claim minimal interference with the usual activities of the subject. The placement of the sensing device is reported as an important issue and the authors claim that the kinematic and gravitational outputs of the accelerometer and gyroscope, in this study, were dependent on a chest mounted device, but acknowledge the need for further research into sensor count and location.
(Parkka, et al., 2006) Picks up on the issue of sensor count and location and widen the scope by including sensor type, and research the use of a range of sensors to classify the physical activities of lying, sitting/standing, walking, Nordic walking, running, rowing and cycling. It is interesting to see that although the use of many variable sensor types has the potential to provide an abundance of features to aide in the classification process, the features chosen were those taken from devices that were located on moving parts of the body rather than those monitoring the physical health of the wearer. The authors mention that the absence of accelerometers on the lower body was a limitation of the study, but again, backing up the conclusions of (Najafi, et al., 2003) indicate that placement of these sensors should be considered carefully.
This claim is investigated by the work carried out by (Atallah, et al., 2011) on the analysis of sensor placement and feature ranking for physical activity recognition.
Table 2.1: List of activities and group classifications (Atallah, et al., 2011)
Activity group Activity
Very low level activity 1. Lying down
Low level activity 2. Preparing Food
3. Eating and Drinking 4. Socialising
5. Reading 6. Getting Dressed
Medium level activity 7. Walking in a corridor
8. Treadmill walking at 2 km/h 9. Vacuuming
10. Wiping tables
High level activity 11. Running in a corridor
12. Treadmill running at 7 km/h 13. Cycling
Transitional activity 14. Sitting down and getting up (5 repetitions)
29 In this work the researcher’s group fifteen activities of daily living into five categories based on the compendium of physical activities (Ainsworth, et al., 2000). The researchers placed seven, 3-axis accelerometers to the ear, chest, arm, wrist, waist, knee and ankle of the subjects to determine the sensors that had most impact on the classification of the activities listed in Table 2.1. The researchers argue that consistent and practical placement of sensors plays an important role in the accurate classification of low-level activities, as listed in Table 2.1. Consistency of sensor placement is problematic because the majority of studies implement sensors to record data for very specific areas of movement; (Najafi, et al., 2003), (Atallah, et al., 2011). Clearly any practical system of activity recognition should be capable of generic classification despite slight variations in sensor position in a specific area. In conclusion the study backs up the claim made by (Parkka, et al., 2006) that the addition of lower body sensors increases the ability of classifiers to detect physical activities. More importantly the research provides an important insight into the relevance of sensor position as it relates to the activity of interest.
All of the approaches to physical activity recognition mentioned so far include accelerometers as either one in a range of sensors types or the only sensor type used to determine the activity of the subject. It is not surprising then, that with the inclusion of accelerometer sensors within the modern smart phone; researchers have conducted studies on the use of the mobile phone for recognition of physical activities. Although from the reviews discussed so far the key issues have been the number and location of sensors, it seems to be a deviation to suggest that a single sensor in an unknown location (unknown because the wearer is at liberty to carry a mobile phone in any location) can improve on recognition accuracy over that of several sensors measuring various movement locations. The suggestion made in the review of (Liu, et al., 2012) that by using more computationally expensive and adaptable classification techniques such as the SVM classifier it could be possible to create more general classifiers that can cope with variations in sensor location and across sensor subjects. Research carried out by (Anjum & Ilyas, 2013) discusses the issues of practicality when implementing numerous body worn sensors for classification of physical activity and as such developed a mobile phone application to study the use of the built in accelerometer, gyroscope and Global Positioning System (GPS). The aim was to classify the
30 daily activities of walking, running, climbing stairs, descending stairs, cycling, driving and inactivity. The study acknowledges the need for large labelled data sets to create effective classification models that use supervised learning algorithms; this is acknowledged and is highlighted in each of the studies that implement supervised learning algorithms reviewed to this point, the technical details of this particular issue are deferred until discussions in Chapter 3 and 4 of this thesisbut it is noted here as a current challenge. The study reports the use of a relatively balanced data set; i.e. there are a similar number of labelled data points across each activity and the number of data points collected for each mobile phone position is within a reasonable range, again this point will be discussed in further detail in chapters 3, 4, 5 and 6.The results reported are comparable with previous studies and is a promising view into what could be possible when the number of sensors used are restricted to those available from a mobile phone and highlights the requirement for analysis of those sensors that contribute to the accurate recognition of the activity of interest.
2.3.2
Activity recognition using environmental sensors
As well as using sensors that are worn by the subject whose activities are the focus of attention, sensors can also be placed in the environment occupied by the subject, these sensitised environments are often referred to as “ambient intelligent environments” (AmI) as discussed in (Sanchez, et al., 2007). Such an environment is useful when the challenges faced by attaching sensors to the body are considered and the context of the activity of focus is within that environment. The advantage of sensors distributed in a residential environment is that the sensor location is fixed, as the particular subject of focus moves within the environment. It should be noted, however that data produced for one environment may not be relevant to another, as sensors are often attached in varying locations and environments have various configurations. As recognised by (Atallah, et al., 2011), when using multiple body worn sensors to detect the activity of a subject there is a desire, often with the aim of minimising the number of sensors required, to determine which sensors provide data that is relevant to the recognition of that activity, this issue is no different and indeed more pronounced when multiple sensors, often many more than used for activity recognition with body worn sensors, are distributed within an ambient
31 environment. The reviewed literature highlights several research projects that have developed ambient environments with significant contributions to the field of human activity recognition, and also investigate and highlight the challenges mentioned in chapter 1.
Gator Tech Smart House - University of Florida: The Mobile and Pervasive Computing
Laboratory (MPCL) at the University of Florida created the Gator Tech Smart House in 2005 (Helal, et al., 2005) to address the adaptability limitations of what is termed “pervasive computing systems” as new technologies emerge. The environment is a fully functional house with a variety of sensor types ranging from Radio Frequency Identification (RFID) sensors, microphones, video, contact sensors, motion sensors and a smart floor mapping systems that implements pressure sensors on tiles to form a location sensitive pressure grid. There are several interesting publications relating to the use of the Gator tech environment for activity recognition. An example that seems unique to the Gator Tech environment, is an early study carried out by (Bose & Helal, 2008) which focused on the monitoring of walking patterns using the pressure sensor network embedded in the floor of the environment. The research describes the floor as consisting of a grid of piezoelectric force sensors embedded under the floor tiles of a 2,500 square foot floor. These sensors are used to track the motion of a subject within the environment. The study claims that this technique is capable of measuring the three characteristics of walking motion; stride length, gait velocity, and cadence without the need for encumbering body worn sensors, and that these measurements can be derived from simple mathematical calculations that need no a priori knowledge of the subject and hence, no labelled training data is required. The results of experimentation are not provided, so cannot be verified but the mechanism is an intriguing alternative to more invasive vision-based motion tracking systems and also is a consideration when the aim is to mitigate the issues related to the requirement for large quantities of labelled training data. The challenges relating to multiple occupants could also benefit from this type of footfall tracking system, as often one of the related issues in this challenge is that of assigning sensor events to each individual in the environment (Crandall & Cook, 2008).
In an article published by (Helal, et al., 2009) the Gator tech house was presented as one environment used as a Smart Home-based platform for behavioural monitoring of the residents.
32 The report outlines a monitoring and analysis platform that combines personal wearables and ambient environment sensors to form a flexible and extensible system for monitoring the health of the occupants. The test beds used for the system are the Gator tech Smart House (Helal, et al., 2005) and the Centre for Advanced Studies in Adaptive Systems (CASAS) smart apartment at Washington State University (Cook, et al., 2009). The CASAS smart apartment is equipped with a grid of motion sensors to detect the movement of subjects throughout the house as well as sensors to detect the use of hot and cold water as well as the use of a stove burner. Telephone usage is captured by voice over IP (VOIP) and contact sensors monitor the subject’s interactions with items such as a cooking pot and what is termed “key cooking ingredients” as well as a medicine container. (Helal, et al., 2009) Combine the use of body worn sensors and environmental sensors in the development of a flexible system that can be deployed at the point of need such as a laboratory, a clinical environment or assisted living spaces. The system uses Hidden Markov models (HMMs) trained on each activity to probabilistically infer the most likely activity being carried out by the occupants. HMM’s were learned for five activities, looking up and calling a phone number, washing hands, cooking, eating while taking medicine, and washing dishes, and the study reports a classification accuracy of 98% using three-fold cross validation. What is interesting about this study is the reported combined use of body-worn and ambient sensors using flexible plug and play architectures. It’s seems that if activity recognition systems are to be adopted in real world environments this type of plug and play concept will be an essential requirement to enable quick, relatively non-technical retrofit integration into existing spaces and thus allowing the occupant to remain in their home and benefit from non-invasive monitoring of activities. In order to develop such flexible plug and play systems, the challenge of collecting sufficient labelled training data remains a significant challenge. (Mendez-Vazquez, et al., 2009) produced research attributed to the MPCL and the Gator Tech environment, on the production of synthetic labelled training data for use in machine learning model training of activity recognition systems. This publication uses Markov Chains (MCs) to generate simulated activity events, and hypothesises that because Markov chains have been successfully implemented to detect activity patterns the reverse process could feasibly be used to produce activities. This is a reasonable hypothesis because an MC, in the context of activity recognition,
33 uses the probability of transitioning from one movement to the next to determine the probability of a sequence of movements. If each activity is classified by a unique MC then the current activity classification would be the MC, and hence activity, with the most probable sequence. The inverse process, used to generate data for a particular activity, would carry out a random walk, based on the probability transitions, through the MC generating a movement event at each random probability transition, this process can be repeated for each activity and so can be used to generate a large labelled training dataset. In order to capture timestamp information for each event, values are drawn from a Poisson distribution that is created from a priori knowledge. The idea of generating synthesised labelled data sets to aid training of machine learning models for human activity recognition as well as for sharing among the research community is an interesting one and is followed up by the MPCL in (Helal, et al., 2011) where it is suggested that powerful and realistic simulation tools can be used to support and progress research in the field. The research paper presents a software simulator named Persim, designed to synthesise datasets based on human activities. Follow up studies from the MCPL based on the development of Persim include (Helal, et al., 2012) where a virtual three dimensional environment is proposed as the interface to Persim, (Lee, et al., 2013) , (Lee, et al., 2014) , while (Lee, et al., 2015) reports on the development and integration of a context driven algorithm to improve the computational complexity of Persim. Simulation techniques and algorithms provide a convincing mechanism to mitigate the on-going challenge of insufficient labelled training data and as a side effect provide a means of generating large datasets for sharing between the research communities. This thesis contributes in the area of labelled training data syntheses at the level of movement detection where data is simulated for disaggregation at the water meter and for labelled training data to train an activity recognition system.
CASAS smart apartment - Washington State University: The CASAS project lists one of the
active areas of research as “Activity Learning - Discovery, Recognition, and Prediction” and has numerous publications of interest. A notable example is (Cook, et al., 2009) where the focus of the publication is on collecting and disseminating sensor data from the CASAS environment where the researchers argue that “shared home behaviour datasets are critical in order to test,
34 compare and enhance smart home user modelling and activity recognition”. The initial sensor data collected was based on five activities; Telephone use, Hand washing, Meal Preparation, Eating and Medication Use (Note: this was a combined activity) and Cleaning, all selected from the IADL scale discussed in section 2.1. The format of the data collected from the sensors is as defined in section 2.3.3, and includes a timestamp, a label representing the ID of the sensor and a message relating to the state of the sensor. The initial dataset was generated from subjects performing the activities of interest, while events were continuously recorded, no time scale is provided but the study resulted in a dataset of 5,312 sensor events. The publication discusses several datasets that were collected during experimentation some of which relate to the challenges of activity recognition discussed in chapter 1. Datasets that represent incomplete or Erroneous activities, Interweaved activities (these are activities that start when another is not yet complete etc.) and Multiple Resident Activity Data. Interestingly the researchers have documented the challenges that were faced when collecting activity recognition data as:
1) Clean Data: The difficulty in collecting clean data and state failures in sensors and equipment as dramatic setbacks in the data collection process.
2) Data Annotation: The labelling of data sequences with the activity class that the sequence represents.
3) Generating sufficiently varied data: The datasets collected cannot be guaranteed to have captured all possible variations that would be encountered in a natural environment; as such the algorithms used for classification must be robust to these variations which are a much greater issue when trying to create generic data sets that can be used across environments.
It is an interesting observation that the challenges of labelled data collection and disse