COMPARISON OF UCG CAVITY GROWTH WITH CFD MODEL PREDICTIONS
Yonggang LUO *, Margaretha COERTZEN and Stephen DUMBLE
Linc Energy Ltd, Brisbane, Queensland 4001, AUSTRALIA
*Corresponding author, E-mail address: [email protected]
ABSTRACT
Underground coal gasification (UCG) is an emerging energy source where coal is gasified in-situ by injection of a suitable oxidant (air or oxygen) for the production of synthetic gas. In this paper, a two-dimensional mathematical model of cavity growth for in-situ UCG is presented that takes into account the effects of natural and forced convection driving forces on heat and mass transfer in cavity. Based on this 2D cavity model, assuming that cavity growth is uniformly expanded towards side wall and roof wall, a three-dimensional cavity shape was concluded. The UCG process modelled was progressed by forward combustion through an initial linked connection between injection and production points. A CFD software package (FLUENT 6.3.26) was used to simulate combustion and gasification reactions on the interface between coal seam and cavity. The temperature distribution and heat and mass transfer rates for the UCG process were also obtained. The predictions from the model included the cavity shape, temperature profile and coal consumption. These parameters showed reasonable agreement with the data that were obtained and calculated from trial work at Linc Energy’s Chinchilla site. The model was also used to compare published data from other UCG trials with the cavity shape, dimensions and coal consumption as calculated by the model. The model proved to have a high degree of correlation with the reported measurements.
NOMENCLATURE
A cross-sectional area of cavity n
A pre-exponential factor n
E activate energy
H cross section radius to cavity boundary n
k kinetic rate for reaction n m
.
mass flow rate n reaction number p pressure
r radius in cylindrical coordinates R gas constant
T temperature u local velocity
U velocity of uniform stream V volume of cavity
x distance along axis from injection well through link zone
y cross section radius of cavity n
α dimensionless power
θ angle between x axis and radius in cavity
ψ stream function φ velocity potential ρ density of blast
∞ blast region outside of cavity boundary layer
INTRODUCTION
Since the first experimental work on UCG began in 1912 in Durham, the United Kingdom (website link, http://en.wikipedia.org/wiki/Underground_coal_gasificati on), currently, various countries have attempted to develop UCG technology with the objective of demonstrating its commercial application. These countries include the USA, Australia, China, South Africa and India (BURTON, 2004). In Australia, four energy companies, of which Linc Energy is one, are exploring UCG technology with the aim of demonstrating its commercial feasibility and application. The intended end uses for the gas generated through UCG include production of ultra clean fuel (diesel), electrical power and chemicals. UCG is regarded as a preferred coal conversion method, due to its enhanced energy efficiency when used in combined cycle power generation and due to its lower capital investment when compared to conventional mining and above-ground gasification. UCG also has a reduced environmental impact as it avoids ground disturbance associated with coal mining and provides opportunity for carbon capture and storage particularly as in some instances, UCG suitable coals are often located in sedimentary basins that also have potential for CO2
sequestration.
UCG involves the gasification of coal in the seam, utilising a well to inject the oxidant and steam if required (injection well) and another well to extract the product gas (production well). The two wells are linked using one of several proven techniques. Linc Energy relies on horizontally drilled connections. The coal is initially ignited and a cavity develops as the coal is gasified. Coal undergoes heating, drying, devolatilisation, char reaction, gas reaction, gas mixing and particle dispersion and mass and heat transfer on the interface between overburden and cavity. UCG is mainly controlled by these chemical and physical reactions, but the interaction between geological factors and physicochemical effects is complicated and cannot be modelled in a detailed manner that reflects the fundamentals of these processes. The cavity growth directly impacts on the coal resource recovery and energy efficiency and therefore the economic feasibility. Cavity growth is also related to other potential design considerations including avoiding surface subsidence and groundwater contamination. More importantly perhaps,
Copyright © 2009 CSIRO Australia 2 cavity growth modelling assists in developing an
understanding of what is happening underground during gasification for process control and operational optimisation.
In this paper, a two-dimensional mathematical model of cavity growth for UCG is presented, considering the effects of natural and forced convection driving forces on the heat and mass transfer in cavity. This fundamentally derived cavity model can be used to predict the generator’s life, its performance and the development of the cavity shape. Parameters in the model can be changed including coal properties, coal seam thickness and air/oxygen enrichment injection rate. The UCG process was assumed to progress by forward combustion through some form of direct linkage. A CFD software, package (FLUENT 6.3.26) was used to simulate combustion and gasification reactions on the interface between coal seam and cavity. The temperature distribution and heat and mass transfer for UCG process as applied in site were also obtained. The interface temperature between the coal seam and cavity is important for sub-models of drying, devolatisation and spalling sub-model. Temperature profile on the interface was simulated to determine the effects when the cavity develops from the coal seam into the overburden. The model was also used to compare cavity shape and dimensions and the coal consumed against published data from other UCG trials. The model can also be used to predict re-ignition requirements, cavity shape, coal consumption rate and gas quality for any assumed gas production rate.
MODEL DESCRIPTION
UCG cavity flow
The model presented here is based upon the modelling approach by SCHWARTZ (1978). For irrotational fluid flow, the stream function and velocity potential in a uniform flow were defined as Equations (1) and (2) (KUNDU, 2004). Stream function sin ( ) 2 cos( 4 2 2 . θ π θ π π ψ = m − ++Ur − (1) Velocity potential cos( ) 4 . θ π π φ= +Ur − r m (2)
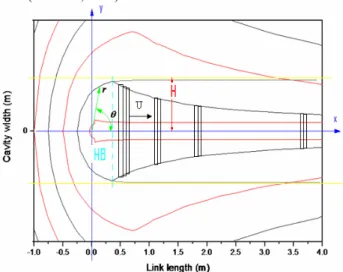
UCG cavity flow is regarded as flow passing a semi-infinite body with a smooth nose, generally called a half-body. The streamline is plotted in Figure 1. Cavity volume is defined by Equation (3): =
∫
x x dx x A V 0 ) ( (3) Where, θ θ π cos sin ) ( 2 r x r y y x A = = =For a specific coal seam thickness, the half-width of the cavity is defined as equation (4):
U m H 4 . = (4)
The pressure distribution in the cavity can be found from Bernoulli’s equation as (5): p ρu p ρU 2 1 2 1 2 + = + ∞ (5)
If the injection flow rate and pressure are fixed for a uniform stream, the right side of equation (5) is constant, so that the pressure in the cavity is a function of the local velocity. The half-body volume is calculated from equation (6), which is the result of integrating equation (3) between Л and θ and combining equations (1), (2) and (4):
] 3 2 2 csc 2 sin 2 sin 3 2 [ 2 3 3 − + − =πH θ θ θ V (6)
The cavity growth simulation is based on equation (6), substituting different positions along the link tunnel between the injection and production well at different stages of cavity development.
Assumptions and solution
UCG processes include coal heating, drying, devolatilisation, combustion and gasification and spalling of material from the cavity roof. The drying process is related to moisture release and water influx from overburden. Moisture is released into the gas stream, reducing the gas temperature. Devolatilisation produces char, volatile matter and tars. In reality, all these processes are involved in the UCG cavity expansion. However, in this model, the combustion and gasification reactions are assumed to be the major factors to cause cavity growth. The maximum cavity growth is regarded to be around the injection well, as a result of the well-mixed and developed nature of air (oxidant) flow around the injection well. In the combustion zone, oxygen is consumed, producing high temperature gas. The very fast, exothermic combustion reactions in the oxidation zone provide energy for the endothermic gasification reactions. The coal/char gasification zone consequently develops next to the combustion zone, typically with some overlap between the combustion and the gasification zones. In order to infer the size of the gasification zone, the rate of water consumption assumed to be related to the coal consumption by way of the in-situ water content of the coal. Other assumptions include the following:
Figure 1: UCG cavity flow as an irrotational flow passing a two-dimensional half-body.
(a) Oxygen concentration along the link direction from injection well to production well at a constant recession rate.
(b) Cavity growth is uniformly expanded towards side wall and roof wall using symmetric two-dimensional geometry.
(c) The rate of cavity growth is governed by the rate at which oxygen diffuses towards the cavity wall. (d) Due to the high temperature and pressure inside the
cavity spalled coal blocks are immediately gasified. (e) Oxygen diffusion along the link direction and
towards the overburden is controlled by natural and forced diffusive convections.
The volume of section HB (separated by blue dash line) was calculated at a specific moment in the generator life, as shown in Figure 1. It was assumed that all coal located in this volume was consumed in reaction with oxygen. With a constant concession rate of oxygen along the link direction, the cylindrical zone next to section of HB was further calculated by considering that coincidence of coal combustion and coal gasification. The oxygen diffusion rate was calculated by natural and forced convective heat and mass coefficient.
CFD simulation
When the cavity size was simulated based on the combustion and gasification reactions at a certain time, the coal consumption rate could be obtained. In these series of cavity domain from time to time, the simulation of UCG process using FLUENT 6.3.26 was explored. Both heterogenous (char reaction on the roof and side walls) and homogeneous reactions (gas reaction in cavity) were considered.
Heterogenous chemical reactions on the surface of wall C O2 1CO2 k → + (7) C 2H2 2CH4 k → + (8) C H2O 3CO H2 k + → + (9) C CO CO k 2 4 2→ + (10)
Homogeneous chemical reaction in the space of cavity H O H O k 2 2 2 2 2 + →5 (11) 2CO O2 62CO2 k → + (12) CH O CO H O k 2 2 2 4 2 2 7 + → + (13) CO H2O 8CO2 H2 k + → + (14)
The kinetic rate of reactions kr from (7) to (14) is given by
(E /RT) n
n AT ne n
k = α − (15)
Using the standard equations of conservation of momentum, mass and energy, which were built using FLUENT 6.3.26 software, the flow and temperature distributions at the wall and in the cavity were simulated. The standard k-ε model for the transport of turbulent kinetic energy and dissipation was used to quantify the turbulent intensity. The pressure outside the boundary of cavity (P∞) was assumed to be 8 bar. The reaction rate
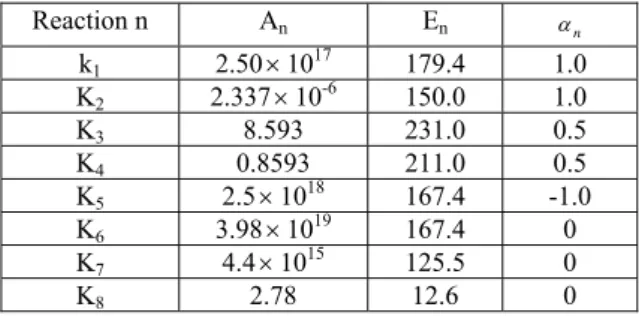
was modelled as a kinetics/diffusion controlled process. The mechanism for homogeneous chemical reactions was guided by using a finite rate/eddy dissipation model. Surface reaction was applied for coal/char reaction. The kinetic parameters used for equation (15) are listed in Table 1. Reaction n An En αn k1 2.50×10¹⁷ 179.4 1.0 K2 2.337×10⁻⁶ 150.0 1.0 K3 8.593 231.0 0.5 K4 0.8593 211.0 0.5 K5 2.5×10¹⁸ 167.4 -1.0 K6 3.98×10¹⁹ 167.4 0 K7 4.4×10¹⁵ 125.5 0 K8 2.78 12.6 0
Table 1 Kinetic parameters for the simulation of UCG process by PERKINS (2008).
For the Chinchilla UCG trial, a 10 m thick coal seam located at 140 m below the ground was gasified. Operating pressures were between 6.5 bar and 8.5 bar. Air was typically injected at rates of between 400 nm3/h and
800 nm3/h. Coal properties are shown in Table 2.
Proximate analysis (ar) (wt%)
Moisture Fixed carbon Volatile matter Ash
7.0 38.3 37.4 24.3 Ultimate analysis (ad) (wt%)
C H O N S 58.5 4.7 4.59 0.64 0.3 Gross calorific value (MJ/kg) 18.3
Table 2 Coal properties as analysed for UCG in Chinchilla.
RESULTS AND DISCUSSION
Coal consumption
Figure 2 shows the coal consumption as determined from the model and trial field data. The model result is slightly higher for the first 120 days of the trial than what was determined from the field data. This is assumed to be because part of unburnt char or uncollected tar stayed in the cavity and was not included in the gas composition. However, the cavity model assumed that all coal in the cavity was burnt or gasified by oxygen or water shift reaction based on the diffusion rate of oxygen and water amount up to 30% total amount of coal .
2D cavity shape 0 20 40 60 80 100 120 0 200 400 600 800 1000 1200 trial data modeling simulation coal am o unt (t on)
Copyright © 2009 CSIRO Australia 4 The cavity size was predicted as shown in Figure 3. In this
graph, “I” represents the injection well and “P” is the production well. Ignition was started at the bottom of injection well and gasification proceeded along the horizontal link direction. The cavity was expanded uniformly toward both sides around the link tunnel. The cavity size and coal consumed are both functions of time. For example, after 8.4 days, the amount of coal consumed was 114.2 tons and the cavity width was 2.25 m as shown in Figure 3(a). After 64.9 days, however, the cavity width was 4.05 m and amount of coal consumed was 639.7 tons as shown in Figure 3(b).
Validation
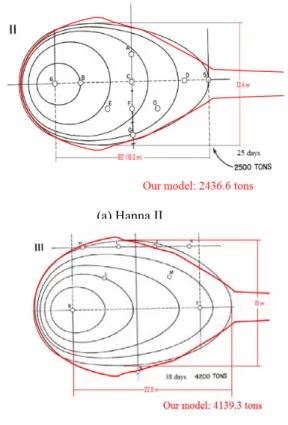
The 2D model was validated by Chinchilla trial outcomes as mentioned above. Further validation was done using data from the Hanna II and III UCG trials. BRANDENBURG (1978) reported that 2500 tons of coal was gasified during the Hanna II trial which lasted 25 days and 4200 tons of coal was gasified during the Hanna III in 38 days. Figure 4 (a) and (b) shows results from the 2D model. The model predicts a coal consumption of 2436.6 tons coal in 25 days using the Hanna II conditions and 4139.3 tons in 38 days when the Hanna III conditions are used. There is less than 5% error between the results generated with the model and reported data.
-5 0 5 10 15 20 -6 -4 -2 0 2 4 6
(b) 64.9 day, 639.7 ton and 4.05 m (b)
(a)
(a) 8.4 day, 114.2 ton and 2.25 m
P I Ca vi ty wi dth (m ) Link length (m)
Figure 3. 2D cavity growth predictions for Chinchilla trial
(b) Hanna III (a) Hanna II
Figure 4. Comparison of sweep cavity geometry with Hanna II and III
(a) At 2.5 days, the cavity touched the overburden
(b) 5 days cavity size and shape
(c) 10 days cavity size and shape
Figure 5. Cavity growth for 4 meters coal seam thickness in 10 days at 10000 nm3/h gas production
3D Cavity growth
A 3D cavity growth was formed based on the 2D cavity growth model. The 3D cavity is uniformly expanded towards side wall and roof wall at a symmetric two-dimensional geometry. UCG process in a 4 m thickness of coal seam was simulated at 10000 nm3/h gas production
flow rate. It was estimated that the cavity would develop into the overburden after 2.5 days as shown in Figure 5 (a). The estimated cavity after 5 days and 10 days are shown in Figures 5 (b) and (c). The cavity expands around the injection well, but once the cavity develops into the overburden, the cavity only expands in the horizontal direction. The model could be used to predict the UCG generator’s effective life based on predicted gas quality which will see an increasing concentration of CO2 as the
combustion zone moves towards the production well and gasification and pyrolysis zones becoming smaller. Temperature distribution
Temperature in the cavity was predicted using a FLUENT-based model. Figure 6 shows the temperature profile in the cavity, especially on the boundary of the cavity at different stages of generator development. Figure 6 (a) shows the temperature when the cavity reaches the overburden at 2.5 days. The temperatures were in the range of 300 K to 1540 K. Figure 6 (b) shows the temperature distribution in the cavity at 5 days (300 K to 1480 K). Figure 6 (c) shows the temperature profile in the cavity at 10 days (300 K to 1450 K). The overall temperature after the cavity reaches the overburden decreases. This is one of the signals that the generator has reached the end of its useful life as the gas quality will deteriorate gradually from this point. When the cavity develops into the overburden, the combustion zone area starts to decrease and moves forward towards the production well. Consequently, the gasification and pyrolysis zones move towards the production well as well. Figure 5 shows how all three zones are expected to move towards the production well. Figure 6 shows how the temperature decreases over time.
CONCLUSION
A 2-D model for UCG cavity growth was developed and applied to predict the size of a UCG cavity in 3D and the amount of coal consumed at various stages of generator development (days). Based on the assumption of stream function in fluid dynamic, the shape and volume of the cavity are obtained. Based on the coal seam thickness and the length between the injection well and production well, the life of generator can be predicted based on relationships derived between cavity shape, generator temperature and gas quality.
The model is sensitive to changes of site-specific parameters like the coal properties (ultimate analysis, density, thermal conductivity, etc.). The 2-D model can be adapted to predict the cavity growth of a UCG generator at any site. Results obtained with the model after changing process parameters like the air injection rate and oxygen concentration in the oxidant were compared. It was found that the model is suitable to predict the cavity development over a range of process conditions. The model was validated using Chinchilla and Hanna II and III trial data. The error in coal consumption prediction is less than 5%.
Temperature profiles in the cavity were calculated over the lifetime of the generator. This will allow the calculation of coal seam surface temperatures at different positions at different times over the life of the generator. This data can be used to calculate the heat transfer rate. When the temperature distribution and heating rate in coal seam are known, the total tar amount produced during pyrolysis can also be estimated.
REFERENCES
BRANDENBURG, C.F., FISCHER, D.D., BOYD, R.M., KING, S.B. and HUMPHREY, A.E., “A review of LERC’s in situ coal gasification project”, Proceeding 3rd Annual UCC Symposium, Fallen Leaf Lake, CA, June. 1977, p66-76
BURTON, E., FRIEDMANN, J., UPADHYE, R., “Best practices in underground coal”, Lawrence Livermore National Laboratory, https://co2.llnl.gov/pdf/Best
PracticesinUCG-draft.pdf
http://en.wikipedia.org/wiki/Underground_coal_gasifica tion
KUNDU, P.K., COHEN, I.M., “Fluid Mechanics”, Third Edition, Elsevier Academic Press, 2004, p164-165
PERKINS, G, and SAHAJWALLA, V., “Steady-state model for estimating gas production from underground coal gasification”, Energy & Fuels 2008, 22, 3902-3914
SCHWARTZ, S.Y, EDDY, T.L., MEHTA, K.H., LUTZ, S.A., and BINAIE-KONDOLOJY, M.B., “Cavity growth mechanisms in UCG with side wall burn gasification”, SPE Annual Fall Technical Conference and Exhibition, 1-3 October 1978, Houston, Texas
ACKNOWLEDEMENT
The authors are grateful to Linc Energy Ltd giving the financial support to present this work in the conference. (a)
(b)
(c)
Figure 6. Temperature distributions in the boundary of cavity