A Survey of App Store Analysis
for Software Engineering
William Martin, Federica Sarro, Yue Jia, Yuanyuan Zhang and Mark Harman
Abstract—App Store Analysis studies information about applications obtained from app stores. App stores provide a wealth of information derived from users that would not exist had the applications been distributed via previous software deployment methods. App Store Analysis combines this non-technical information with technical information to learn trends and behaviours within these forms of software repositories. Findings from App Store Analysis have a direct and actionable impact on the software teams that develop software for app stores, and have led to techniques for requirements engineering, release planning, software design, security and testing. This survey describes and compares the areas of research that have been explored thus far, drawing out common aspects, trends and directions future research should take to address open problems and challenges.Index Terms—App Store, analysis, mining, API, feature, release planning, requirements engineering, reviews, security, ecosystem
F
1
I
NTRODUCTIONApp stores are a recent phenomenon: Apple’s App Store and Google Play were launched in 2008, and since then both have accumulated in excess of 1 million downloadable and rateable apps. Google announced that there were 1.4 billion activated Android devices in September 2015 [32]. Mobile app stores are also extremely lucrative: the set of online mobile app stores were projected to be worth a combined 25 billion USD in 2015 [152]. The success of app stores has coincided with the mass consumer adoption of smartphone devices. Smartphones existed prior to the launch of these stores, but it was not until 2008 that users could truly exploit their extra computing power and resulting versatility through downloadable apps. In-house and even commercial applica-tions had been available before the launch of app stores, but app stores had some differences: availability, compatibility, ease of use, variety, and user-submitted content.
It is the user-submitted content that fundamentally dis-tinguishes app stores from the ad-hoc commercially available applications that existed beforehand. As a result, software engineering researchers have access to large numbers of software applications together with customer feedback and commercial performance data, unavailable in previous soft-ware deployment mechanisms.
Furthermore, through readily available, downloadable toolkits, users can write their own applications to make use of a smart device’s hardware. They can subsequently publish their software in the central app store for users to download (and possibly pay for). This publication process is subject to the store’s in-house review and certification policies, but in general apps and app updates can be made available quickly (typically within hours/days).
In this paper we provide a survey of literature that per-forms “App Store Analysis for Software Engineering” between 2000 and November 27, 20151. Our contributions are as
follows: i) We provide formal definitions of apps, stores, and technical and non-technical attributes, which are used
1. This paper is an updated version of an earlier technical report [157].
category price in-app purchases description name size rank of downloads installs what’s new release date version platform version API usage version control issues
discussions number of ratings
rating
reviews reviewers
Technical Attributes Non-technical Attributes author
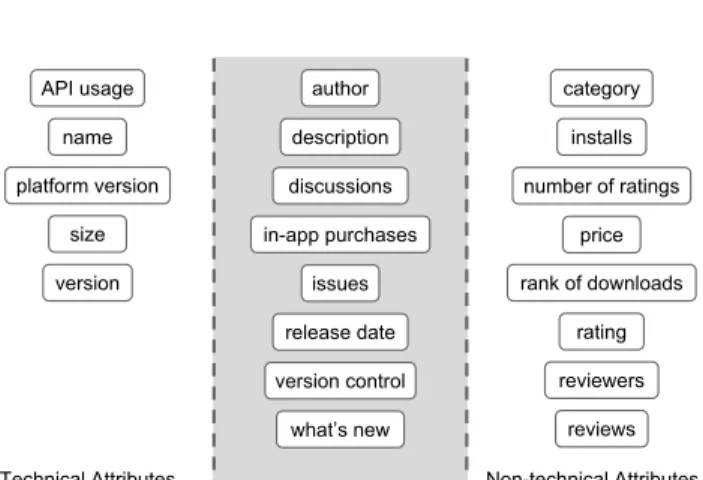
Fig. 1.Example attributes showing mined attributes that are strictly technical (left) or non-technical (right), and attributes that may be in either category (centre in box).
for App Store Analysis research. ii) We study the growth patterns of App Store Analysis literature both overall, and in each emergent subcategory.iii)We analyse the scale of app samples used, and discuss how this is likely to progress in the future.iv)We identify some of the key ideas published in App Store Analysis, in addition to common aspects, trends and future directions, to help readers to understand the progression of the field overall.
1.1 Definitions
The following definitions help to clarify key components of App Store Analysis literature. We used them to find all the relevant literature.
App: An item of software that anyone with a suitable plat-form can install without the need for technical expertise. App Store: A collection of apps that provides, for each app, at least one non-technical attribute.
Technical attribute: An attribute that can be obtained solely from the software.
Non-technical attribute: An attribute that cannot be ob-tained solely from the software.
Examples of attributes are shown in Figure 1, based on the data we collected in previous studies [92], [154], [202]. As our diagram shows, some attributes are distinctly technical or non-technical in a boolean sense, but others lie in a grey area, depending on the precise interpretation of what can be obtained from software alone. Those in the grey box cannot be considered technical in the strictest sense of the definition, because they are not guaranteed to be obtainable solely from the software in all cases. These attributes can be both non-technical and non-technical, depending on how they are obtained. They are attributes that, in some cases, can be provided by the developer and not the app store, whilst attributes that are strictly non-technical may only be provided by an app store. For example, consider the ‘author’ attribute. In the case of Android software, the author can be obtained solely from the distributedapkfile. However, in the case of a compiled
Cbinary such as a simple “hello world” program, the author cannot be obtained directly from the binary file. The ‘author’ attribute therefore belongs in the grey area. We can obtain the size of theCbinary, and so this attribute is technical; we cannot obtain the price from either of these example files, and so this is a non-technical attribute.
Our definition of App Store may seem simplistic. However, at the time of writing, app stores serve as more than just collections of apps, but enable more developers than ever to produce and distribute content, and enable a communication channel between users and developer via reviewing systems. Therefore, our definition is aimed at inclusivity. In only 7 years since the launch of the two biggest app stores, there are already over 180 papers devoted to their study, and each of these stores has well over 1 million apps each. As this rapid development has shown, the concept of apps and app stores is very likely to evolve over the coming years. It is our aim to encompass this evolution as best we can through the stated definitions, in the hope that future surveys will be able to build upon this work and the App Store Analysis literature to come.
1.2 Overview
This survey is structured as follows: Section 2 describes the process used to find the included literature; Section 3 breaks down the growth trends in non-technical research compared with technical-only research, and Section 4 breaks down the growth of scale of apps used; key ideas in each subfield of app store analysis are identified in Section 5.
We define the following App Store Analysis subfields, based on the literature gathered through the process ex-plained in Section 2: “API Analysis”, which is discussed in Section 6; “Feature Analysis”, which is discussed in Section 7; “Release Engineering”, which is discussed in Section 8; “Re-view Analysis”, which is discussed in Section 9; “Security”, which is discussed in Section 10; “Store Ecosystem”, which is discussed in Section 11; and “Size and Effort Prediction”, which is discussed in Section 12.
Closely related work is discussed in Section 13; guidelines and recommendations for future app store analysis authors are outlines in Section 14; we identify potential future direc-tions in Section 15, and conclude our findings in Section 16.
2
L
ITERATURES
EARCHIn this section, we describe the process used to find litera-ture, including our scope, search terms and repositories and lessons learned for future app store analysis surveyors. 2.1 Scope
App Store Analysis literature encompasses studies that per-form analysis on a collection of apps mined from an App Store. We are particularly interested in studies that com-bine technical with non-technical attributes, as these studies pioneer the new research opportunities presented by app stores. However, we also include studies that use app stores as software repositories, to validate their tools on a set of real world apps, or by using specific properties such as the malware verification process apps go through before being published in the major app stores.
Our survey is not a Systematic Literature Review (SLR). The area of App Store Analysis is still developing, but has not reached a level of maturity at which research questions can be chosen and asked of a well-defined body of literature. Our study aims to define, collect and curate the disparate liter-ature, arguing and demonstrating that there does, indeed, exist a coherent area of research in the field that can be termed “App Store Analysis for Software Engineering”. We hope that this will prove to be an enabling study for future SLRs in this area.
We apply the followinginclusion criteria:
i) The paper is related to software engineering, and may have actionable consequences for software users, developers or maintainers.
ii)The paper is related to mobile app stores, concerning the use of collections of apps or non-technical data gathered from one or more app stores.
We apply the followingexclusion criteria:
i) The paper focuses on mobile app development but does not extend to collections of apps nor to app stores.
ii) The paper uses an arbitrary collection of apps to test a tool, but it was not mined from an app store, and the study does not extend to app stores.
2.2 Search Methodology
In order to collect all relevant literature to date that meets the scope defined in Section 2.1, we perform a systematic search for the terms defined below, from each repository (also defined below). Unique papers are collected into a table, and a decision is made based on the inclusion criteria in three stages:
Title:We remove publications that are clearly irrelevant from the title.
Abstract: We inspect the abstract and remove publications which are clearly irrelevant according to the scope defined in Section 2.1.
Body: Results are read fully and a judgement is made on whether the paper a) meets the key requirements on what is defined as “app store analysis” in our scope, or b) is very relevant to the field and so should be included as “expanded literature”, to put the main literature into context. Papers matching the requirements of a) or b) are included in this survey.
A summary of the number of papers found through the search, as well as the number of papers accepted at each stage of validation, can be found in Table 1. All of the references for papers discussed in this survey are available in an online repository [201].
2.2.1 Search Repositories
We performed a search in each of the following repositories for papers to include in the study: Google Scholar, Scopus, JSTOR, ACM, IEEE and arXiv.
2.2.2 Terms
We searched for the following terms and phrases, to encom-pass the sub-fields of App Store Analysis that we identify: “App Store”, mining, API, feature, release, requirements, re-views, security, and ecosystem. We performed searches for the following specific queries, where terms joined by an ‘AND’ must appear, and phrases in quotes must appear verbatim:
“app store analysis”
“app store analysis” AND mining
“app store analysis” AND mining AND API “app store analysis” AND mining AND feature
We performed the following more general searches to ensure that no relevant literature was missed from the survey:
“app store” AND analysis AND API
“app store” AND analysis AND API AND mine “app store” AND analysis AND feature AND mine “app store analysis” AND mining AND requirements “app store analysis” AND mining AND release “app store analysis” AND mining AND reviews “app store analysis” AND mining AND security “app store analysis” AND mining AND ecosystem
We mitigate the threat of missing papers by conducting searches for “app store analysis” AND “mining” and also each of the names of each of the major subfields of App Store Analysis literature. Since, by our definition, app store analysis research uses collections of apps, this should encompass much of the field. We also performed snowballing, which further helps to mitigate the threat of potentially missing papers. However, the threat of missing papers is a threat to the validity of any survey, including this one.
2.3 Snowballing
In addition to the repository searches specified in Section 2.2, we also perform snowballing [244] on many of the included studies. To do this we inspect the studies cited by the study, and the publications that subsequently cited the study, using Google Scholar and ACM. By performing this process in addition to repository keyword searching, we reduce the risk that relevant literature is omitted from this survey.
2.4 Search Results
Search results can be found in Table 1.
We set the time window to start with the year 2000, yet the earliest reported study is 2010. This is likely because the App Stores that propelled mobile app usage to become widely adopted were launched in 2008. Yet, it is interesting that studies incorporating technical with non-technical app store information did not emerge until two years later. Papers were collected until November 27, 2015.
2010 2011 2012 2013 2014 2015 Year 0 5 10 15 20 25 30 35 40 45 50 55 60 65 70 75 Studies
Technical-only
Technical and non-technical
Fig. 2.Histogram showing number of research papers incorporat-ing non-technical information and technical-only research papers showing the period from 2010 to November 27, 2015.
2010 2011 2012 2013 2014 2015 Year 0 5 10 15 20 25 30 35 40 45 50 55 60 65 70 75 Studies
API
Feature
Release
Reviews
Security
Store Ecosystem
Prediction
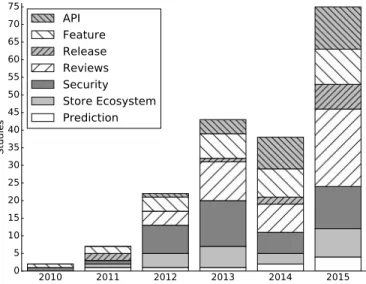
Fig. 3.Histogram of sub-field trendsshowing the period from 2010 to November 27, 2015.
An overlap was found between search queries performed, and thus the total number of discovered papers through search queries was fewer than suggested by the sum of the bottom rows in Table 1. Many papers were discovered through snowballing, which do not appear in the table.
We present a summary of the included literature in Ta-bles 3 to 9. Histograms depicting the growth of publications studied on App Store Analysis for software engineering can be found in Figures 2 to 4, which show the split between technical-only and technical and non-technical research, the split between different subfields identified as subsections in this survey, and the split between scale of studies in terms of the number of apps used, respectively. A breakdown of these studies in each sub-field that we identify is also presented in Figure 5.
2.5 Lessons Learned
As can be seen from Table 1, for some queries, there were large drops in the number of papers upon inspection of their
TABLE 1
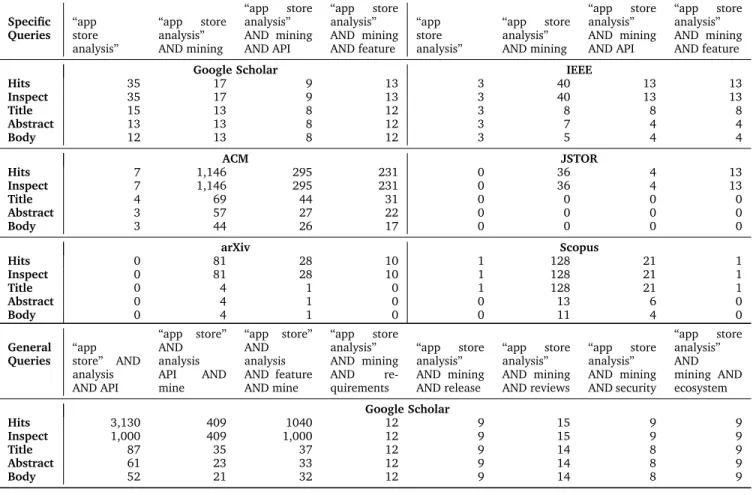
Search query resultsindicating the number of hits each query generates, the number of these that were available to be inspected, the number of titles and subsequent abstracts and paper bodies that were accepted as valid. The top boxes indicate more specific queries run in multiple paper repositories, and the lower boxes indicate the more general queries run only in Google Scholar. In the case of Google Scholar, only the top 1,000
results were accessible to inspect at the time of search.
Specific Queries “app store analysis” “app store analysis” AND mining “app store analysis” AND mining AND API “app store analysis” AND mining AND feature “app store analysis” “app store analysis” AND mining “app store analysis” AND mining AND API “app store analysis” AND mining AND feature
Google Scholar IEEE
Hits 35 17 9 13 3 40 13 13 Inspect 35 17 9 13 3 40 13 13 Title 15 13 8 12 3 8 8 8 Abstract 13 13 8 12 3 7 4 4 Body 12 13 8 12 3 5 4 4 ACM JSTOR Hits 7 1,146 295 231 0 36 4 13 Inspect 7 1,146 295 231 0 36 4 13 Title 4 69 44 31 0 0 0 0 Abstract 3 57 27 22 0 0 0 0 Body 3 44 26 17 0 0 0 0 arXiv Scopus Hits 0 81 28 10 1 128 21 1 Inspect 0 81 28 10 1 128 21 1 Title 0 4 1 0 1 128 21 1 Abstract 0 4 1 0 0 13 6 0 Body 0 4 1 0 0 11 4 0 General Queries “app store” AND analysis AND API “app store” AND analysis API AND mine “app store” AND analysis AND feature AND mine “app store analysis” AND mining AND re-quirements “app store analysis” AND mining AND release “app store analysis” AND mining AND reviews “app store analysis” AND mining AND security “app store analysis” AND mining AND ecosystem Google Scholar Hits 3,130 409 1040 12 9 15 9 9 Inspect 1,000 409 1,000 12 9 15 9 9 Title 87 35 37 12 9 14 8 9 Abstract 61 23 33 12 9 14 8 9 Body 52 21 32 12 9 14 8 9 2010 2011 2012 2013 2014 2015 Year 0 5 10 15 20 25 30 35 40 45 50 55 60 65 70 75 Studies 106−107
apps
105−106apps
104−105apps
103−104apps
102−103apps
10−102apps
1−10apps
0apps
Fig. 4. Histogram showing number of research papers grouped into app quantity rangeseach year, showing the period from 2010 to November 27, 2015. Each histogram depicts a range such as102 -103apps, which means that the studies included used between102and
103apps.
title or abstract, when performing the more general searches on Google Scholar: searches for “app store” with many of the combinatoral words resulted in several thousand papers
Prediction 9 Store Ecosystem 22 Security 41 Reviews 45 Release Eng. 12 Feature 32 API usage 26
Fig. 5.Pie chart showing overall sub-field distributionshowing the period from 2010 to November 27, 2015.
which may have mentioned “app store” only once. We found that searching for “app store analysis” as a phrase narrowed the results down a lot, but did miss some relevant papers.
Searches that included “mining” as a keyword did en-compass much of app store analysis research due to the
TABLE 2
Number of research papers studying each app quantity rangefrom 2010 to November 27, 2015.
No. Apps Range Papers No. Apps Range Papers
0 5 [103,104) 36
[1,10) 19 [104,105) 39
[10,102) 21 [105,106) 28
[102,103) 31 ≥106 3
focus on collections of apps that meets our app store def-inition. However, we found that the snowballing technique was crucial in our literature search, because paper discovery through many of the paper repositories we used could not be replied upon to find all relevant papers; in a growing field terms of reference are not fully stabilized. We therefore encourage future surveyors to visit the App Store Analysis paper repository [201], which can assist in the discovery of app store analysis literature.
3
N
ON-T
ECHNICALR
ESEARCHWhile software engineering deals primarily with code, it is not confined to deal with strictly technical sources of informa-tion. We can combine data from multiple (technical and non-technical) sources, and app stores provide a wealth of such information. There are 127 of 187 (68%) papers included in this study that incorporate non-technical information mined from app stores in order to either infer technical attributes (such as features), or to extract useful information such as bug reports and feature requests from users.
The histogram in Figure 2 shows that the number of studies incorporating non-technical information is growing year-on-year. We can see from Figure 2 that even including the boom in technical-only research, there is growth year-on-year (with the exception of 2014). Using linear regression, we are able to fit the growth trend with high accuracy (R2 = 0.9067,p = 0.003373), which indicates that we can
draw a straight line and predict (with 90% accuracy) the publications for a given year.
4
S
CALE OFS
TUDIESIn order to discuss the number of apps that are studied by research papers, we first need to define a set of ranges. We assign the papers studied to app quantity ranges in ascending powers of 10, according to the number of apps that they consider. The ranges that we assign, and the number of research papers that study them, are shown in Table 2.
The median number of apps used in the considered litera-ture is 1,679, and the mean is 44,807. This result shows that half of the papers study fewer than 2,000 apps, but the other half study a quantity of apps several orders of magnitude larger. This is reflected in Figure 4, where the range[104,105)
is shown to grow and in 2015 represents almost half of the app usage literature.
The histogram for the studies using between104and105
apps shows growth from 2011 to 2015, and this result is reflected in the histogram for studies using between105and 106apps as well, up to 2014. It is important to note that we
did not have complete data for 2015, so this result is subject to change. Studies using smaller scales of apps show an
TABLE 3
Chronological summary of API-related App Store Analysis literatureshowing the authors, publication year, publication venue, and
the number of apps used in the study.
Authors [Ref], Year Venue No. apps
Ruiz et al. [195], 2012 ICPC 4,323
Linares-V´asquez et al. [138], 2013 FSE 7,097
Shirazi et al. [196], 2013 EICS 400
Minelli and Lanza [163], 2013 ICSM 20
Minelli and Lanza [164], 2013 CSMR 20
Ruiz et al. [193], 2014 IEEE Soft. 236,245
Hao et al. [91], 2014 MobiSys 3,600
Dering and McDaniel [57], 2014 MILCOM 450,000 Linares-V´asquez et al. [140], 2014 MSR 24,379 Ruiz et al. [192], 2014 IEEE Soft. 208,601 Linares-V´asquez [137], 2014 ICSE comp. 0 Viennot et al. [226], 2014 SIGMETRICS 1,107,476 Bartel et al. [18], 2014 IEEE Soft. Eng. 1,421
Zhang et al. [250], 2014 WiSec 10,311
Borges and Valente [30], 2015 PeerJ C. S. 396 Bavota et al. [21], 2015 IEEE Soft. Eng. 5,848
Kim et al. [121], 2015 ASE 350
Khalid et al. [114], 2015 IEEE Soft. 10,000 Watanabe et al. [242], 2015 SOUPS 200,000
Zhou et al. [254], 2015 WiSec 36,561
Wan et al. [236], 2015 ICST 398
Wang et al. [237], 2015 ISSTA 105,299
Syer et al. [214], 2015 Soft. Qual. 5
Azad [15], 2015 Masters thesis 950
Wang et al. [238], 2015 UbiComp 7,923
Seneviratne et al. [204], 2015 WiSec 4,114
Mean 93,298
Median 5,086
uncertain change in frequency, indicating that most studies in the future are likely to continue using over104apps. We
anticipate larger studies in the future, based on the growth of App Store Analysis literature, the increasing quantity of apps studied, and of course the growing app stores themselves.
5
K
EYI
DEAST
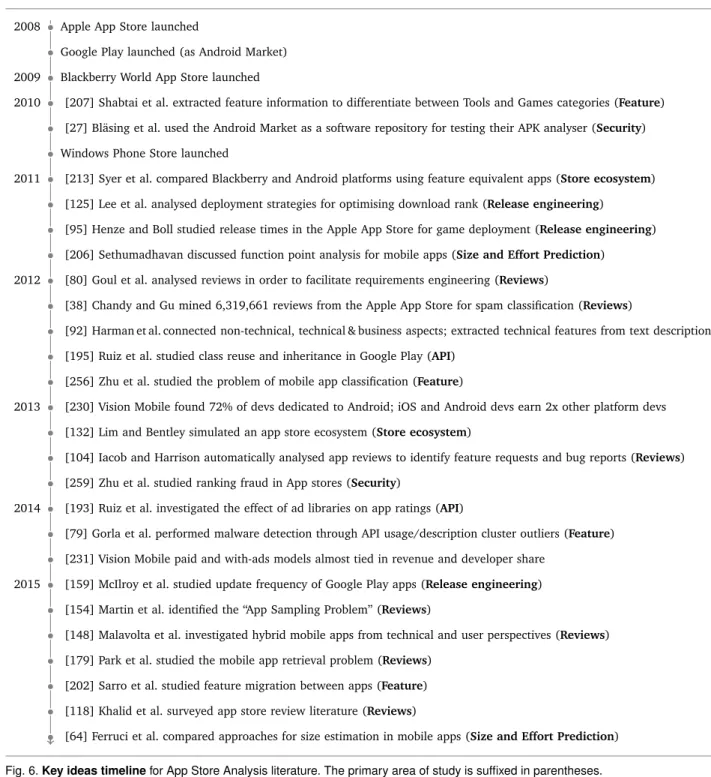
IMELINEA timeline depicting the key ideas is shown in Figure 6. This highlights the launch of major app stores studied, as well as the first studies in each subsection. We include studies into the timeline that have advanced the field of App Store Analysis in some way, or introduced influential ideas into their respective subsection.
6
API A
NALYSISPapers that extract the API usage from app APKs or source code, and combine this information with non-technical data are discussed in this section, and are summarised in Table 3. All API analysis literature studied apps from the Android plat-form only. This may be due to the availability of tools which can be used to decompile the apps and extract their API calls, which are freely available and can be applied to downloaded app binaries. It is perhaps surprising that such analyses have not also been performed on the Apple platform, iOS, since the store was launched in 2008. This might be because iOS binaries are only available for the intended platforms, and cannot be downloaded to, or used from a desktop computer without an Apple Developer account, which is not free. Even with such an account, app binaries or source code would be needed, and neither are freely available due to a) copyright
2008 Apple App Store launched
Google Play launched (as Android Market) 2009 Blackberry World App Store launched
2010 [207] Shabtai et al. extracted feature information to differentiate between Tools and Games categories (Feature) [27] Bl¨asing et al. used the Android Market as a software repository for testing their APK analyser (Security) Windows Phone Store launched
2011 [213] Syer et al. compared Blackberry and Android platforms using feature equivalent apps (Store ecosystem) [125] Lee et al. analysed deployment strategies for optimising download rank (Release engineering)
[95] Henze and Boll studied release times in the Apple App Store for game deployment (Release engineering) [206] Sethumadhavan discussed function point analysis for mobile apps (Size and Effort Prediction)
2012 [80] Goul et al. analysed reviews in order to facilitate requirements engineering (Reviews)
[38] Chandy and Gu mined 6,319,661 reviews from the Apple App Store for spam classification (Reviews)
[92] Harman et al. connected non-technical, technical & business aspects; extracted technical features from text descriptions (Feature) [195] Ruiz et al. studied class reuse and inheritance in Google Play (API)
[256] Zhu et al. studied the problem of mobile app classification (Feature)
2013 [230] Vision Mobile found 72% of devs dedicated to Android; iOS and Android devs earn 2x other platform devs [132] Lim and Bentley simulated an app store ecosystem (Store ecosystem)
[104] Iacob and Harrison automatically analysed app reviews to identify feature requests and bug reports (Reviews) [259] Zhu et al. studied ranking fraud in App stores (Security)
2014 [193] Ruiz et al. investigated the effect of ad libraries on app ratings (API)
[79] Gorla et al. performed malware detection through API usage/description cluster outliers (Feature) [231] Vision Mobile paid and with-ads models almost tied in revenue and developer share
2015 [159] McIlroy et al. studied update frequency of Google Play apps (Release engineering) [154] Martin et al. identified the “App Sampling Problem” (Reviews)
[148] Malavolta et al. investigated hybrid mobile apps from technical and user perspectives (Reviews) [179] Park et al. studied the mobile app retrieval problem (Reviews)
[202] Sarro et al. studied feature migration between apps (Feature) [118] Khalid et al. surveyed app store review literature (Reviews)
[64] Ferruci et al. compared approaches for size estimation in mobile apps (Size and Effort Prediction)
Fig. 6.Key ideas timelinefor App Store Analysis literature. The primary area of study is suffixed in parentheses.
on binaries and b) many iOS apps being paid-for apps. Due to these difficulties, it is uncertain whether it will be possible for future studies to extract API information from iOS apps; in fact, it may become harder since the move (in iOS9) to developer-submitted LLVM IR (Intermediate Representation) binaries, which are then compiled for specific platforms by Apple.
API analysis literature can be decomposed into “API Us-age”, “Class Reuse and Inheritance”, “Faults” and “Permis-sions and Security”. There is some overlap between the latter subsection and Section 10. Nevertheless, the literature discussed in this Section is collected together and discussed here because it directly analyses API usage. Several papers included in this section relate to energy usage [139], [236],
although much of this field of research relates only indirectly to app stores. For those who wish to learn more on the sub-ject, we point the reader to the recent paper by Hindle [96].
All API analysis literature has, hitherto, studied apps from the Android platform. There is large range in the number of apps considered, from 0 apps to over 1,000,000.
6.1 API Usage
Borges and Valente [30] used association rule mining to infer API usage patterns, using a dataset of 396 open source Android apps. For their study, the authors extended
APIMiner[167] to mine usage patterns and instrument API documents with extracted usage patterns. They reported a study over 17 months, during which instrumented Android documentation was made publicly available, and received approximately 78,000 visits. Shirazi et al. [196] extracted the API usage with regards to user interface (UI) elements and layout, and compared statistics between the 21 different categories of the Google Play store that existed in 2012.
Wan et al. [236] explored energy hotspots in apps by transforming their UIs and producing a ranked list of UI components by energy consumption. The authors tested their approach on 398 apps mined from Google Play. Azad [15] studied apps mined from Google Play and F-droid, and pro-duced tools to inspect API usage and suggest similar APIs based on Stackoverflow discussions, score the similarity of apps, identify the degree to which apps have copied the source code of open source projects, and detect license violations. Tian et al. [219] extracted API information and evaluated apps in terms of code complexity, API dependency, API quality, as well as a number of other factors, in order to train features to distinguish high from low rated apps.
API usage can be extracted from AndroidAPKfiles, mak-ing analysis on the Android platform relatively straight-forward. The extracted information has been used to analyse energy usage, detect malware, analyse graphical elements and to detect license violations.
6.2 Class Reuse and Inheritance
In 2012 Ruiz et al. [195] studied class reuse and inheritance in 4,323 Android apps mined from 5 categories in Google Play. Of these, 217 apps were found to contain exactly the same set of classes as another app in the same category. The study was later extended to 208,601 apps by Ruiz et al. [192] in 2014. More evidence of substantial code reuse was found, and the authors concluded that app developers benefit from increased productivity but risk dependence on the quality of the code they reuse.
In 2013 Minelli and Lanza presented a visual analytics web tool for studying repositories of apps [163], [164]. The tool analyses snapshots of apps throughout their version his-tory, using an interactive graphical user interface. Following their subsequent study on 20 free and open source Android apps, the authors found that 3rd party API code is often (incorrectly) committed along with the app code, instead of including the corresponding 3rd party jar files. Excluding 3rd party code, most apps were found to have comparatively small code-bases. Additionally the authors found little use of inheritance in Android apps, and much duplication. Viennot et al. [226] introduced thePlayDroneGoogle Play crawler, which they used to store daily data on 1.1M apps and decom-pile 880k free apps. The authors found that native libraries are heavily used in popular apps, and that approximately a quarter of free apps are duplicates of other apps. They found that paid apps account for just 0.05% of downloads, and the top 10% of most popular apps account for 96% of total downloads as of June 23, 2013.
Linares-V´asquez et al. [140] decompiled and analysed 24,379 APKs from Google Play and found that the 82% of
de-tected clones replicate 3rd party libraries. Zhang et al. [250] proposed ViewDroid, an app plagiarism detection system that uses view transition graphs as “birthmarks” to capture app behaviour, in order to detect clones in the presence of code obfuscation. Apps mined from Google Play were used as a false negative set. In a related study, Kim et al. [121] scan API invocations to identify plagiarised applications, in a more sophisticated approach than similarity detectors that scan code, as it handles code obfuscation. Wang et al. [237] proposedWuKong, a two-phase Android clone detection sys-tem that first filters third-party libraries to increase detection speed. The authors tested the system on 105,299 Android apps and found zero false positives.
Code reuse is common in the Google Play store, but inheritance use is comparatively rare. Most apps are found to have small code bases, often replicating third party code instead of including compiledjarfiles. Clone and plagiarism detection tools are a widely discussed topic in the Class Reuse and Inheritance literature.
6.3 Faults
Linares-V´asquez et al. analysed the effect of fault and change-prone core Google APIs on app ratings [138]. This is an important study as it combines technical API information with non-technical information in the form of average user reviews, in order to assess the impact that API usage can have. Fault and change prone APIs were found to be used more frequently by poorly-rated apps. Conversely, popular apps used APIs that were found to be less susceptible to faults and changes. The paper presents an analysis of 7,097 randomly selected free apps with>10 reviews. Changes and faults were measured as the number of API changes and bug fixes, respectively, to the particular associated core libraries.
Building on the work by Linares-V´asquez et al. [138], Linares-V´asquez also presented an approach for a recommen-dation system for Android app developers [137], to help them to prepare for platform updates and avoid breaking changes and introducing bugs. The authors extended their API analysis work to identify APIs that have a high energy usage [139], but this study did not combine non-technical app store information.
Bavota et al. [21] investigated how the number of changes and faults present in APIs used affected apps’ ratings. Their results showed an inverse correlation between the popularity of apps and the number of faults and changes in APIs they used. That is, low rated apps were found to use APIs that are more fault- and change-prone than highly rated apps. Bavota et al. surveyed 45 Android developers who confirmed this relationship from anecdotal experience. These studies combined technical (API usage) with non-technical (user ratings) information to highlight best practice for API usage in Android development.
Syer et al. [214] studied the effect of platform inde-pendence on source code quality, finding that the more defect prone source files also depend more heavily on the platform. The authors therefore suggest prioritising platform-dependent source files for unit testing, as a quality assurance strategy. In 2015, Khalid et al. [114] performed static analysis
on 10,000 free Google Play apps, and found that 3 categories ofFindBugswarnings occur more frequently in lower rated apps. The categories ‘bad practice’, ‘internationalisation’ and ‘performance’ had more warnings in lower-rated apps, sug-gesting that these areas are the ones developers should focus on to achieve better rating performance.
Fault and change-prone APIs have been used more fre-quently by poorly rated apps. Fault prone apps often depend more heavily on the platform than non fault prone apps.
6.4 Permissions and Security
In 2013 Peiravian and Xingquan [180] used API calls and permissions data to train their malware classifier, which they trained and validated on 1,260 malware samples and 1,250 benign samples, using cross-validation. Hao et al. [91] stud-ied the insertion of UI handlers into app code. They published thePUMAtools which makes UI automation programmable, and enables researchers to analyse correctness properties of apps. They tested the tool on a set of 3,600 apps downloaded from Google Play. Dering and McDaniel [57] downloaded a set of 700,000 app binaries from 450,000 free apps on Google Play and analysed library and permission usage. They found a strong correlation between the number of libraries used and the number of permissions requested by the apps, leading to the conclusion that libraries tend to have specific use cases that require additional permissions from the user. This finding presents a security concern: is each library doing what it is supposed to, and does it need this permission? In conjunction with the finding by Book et al. [29], this suggests that library usage is a significant security concern, since libraries often make use of existing permission privileges, and also increase the number of permissions requested.
Ruiz et al. studied the effect of advertisement libraries on app ratings [193]. They combined non-technical rating in-formation with the extracted technical inin-formation showing advertisement library usage to perform the study. Advertise-ment libraries query their host server at regular intervals to fetch advertisements for display, and this interval determines the “advertisement fill rate”. Multiple libraries are often used to obtain higher fill rates in order to increase revenue. From a sample of 236,245 apps, the authors found no evidence of a correlation between rating and the number of advertisement libraries. However, certain APIs were found to have low median ratings from apps that used them. The authors state that this is due to intrusive behaviours, such as recording entered passwords.
Gorla et al. [79] trained a one-class support vector ma-chine [149] on API usage information in order to identify outliers in trained clusters for security purposes. Bartel et al. [18] showed that off-the-shelf static analysis is insufficient for permission-protected API methods, and investigated alter-natives, which they tested on 1,421 apps downloaded from two Android markets. Watanabe et al. [242] found, from analysing the description and API usage of 200,000 Android apps, that there is disparity between their descriptions and re-quested permissions. This is due to a combination of factors:
unnecessary permissions requested by app building frame-works, or developers that use similar manifests for multiple app projects; secondary functionality that is not mentioned in descriptions; and the use of 3rd party libraries. In a related study, Zhou et al. [254] mined a set of 36,561 Android apps, and proposed the tool CredMiner which is focused on decompilation and program slicing. They identified over 400 apps that leaked developer user-names and passwords, required for the program to execute normally.
Wang et al. [238] decompiled 7,923 apps from Google Play and mined features from the decompiled code and variable names. They trained a machine learning classifier on labelled instances of the apps using location and contact information, in order to identify the way in which sensitive information is used. Seneviratne et al. [204] studied 275 free and 234 paid Android apps, and found that paid apps collect personal information, in the same way as free apps do. 60% of the paid apps collected personal information, compared to 85% in free apps. The authors subsequently showed that 20% of 3,605 collected Android apps were connected to more than three trackers.
There is a strong correlation between libraries used and permissions requested. Advertisement libraries some-times have intrusive behaviours such as recording en-tered passwords. The treatment of personal data is a topic of interest in Permissions and Security API analysis.
6.5 Future Work
The biggest available avenue for future API analysis literature is to consider alternative platforms: all studies thus far have extracted API usage from Android apps. It remains to be seem what effect the move to intermediate representation will have on potential API analysis in the Apple App Store, but it may hinder efforts. The Windows Phone platform is relatively recent, and we may start to see API analysis studies utilising this platform; the Google Play store launched in 2008 (as Android Market), but it was not until 2012 that App Store Analysis literature studied API usage in the store.
The scale of API analysis studies is large, but future work may seek to study how usage varies over long time periods. Literature has looked at how API usage differs between apps of varying popularity or rating, but there is potential to look at differences between categories.
7
F
EATUREA
NALYSISPapers that extract feature information from either technical or non-technical sources of information are discussed in this subsection, and are summarised in Table 4. We can observe that these research papers study a wide range of platforms: Android, iOS, Nokia Widsets, Blackberry and Win-dows Phone. In addition, the publications investigate a large number of apps: the minimum is 3 and the maximum is 600,000.
TABLE 4
Chronological summary of feature-related App Store Analysis literatureshowing the authors, publication year, store used: g signifies
Google Play or other Android stores, a signifies Apple App Store, n signifies the Nokia (or Widsets) platform, b signifies Blackberry, s
signifies Samsung (Android) and w signifies Windows Phone; publication venue, and the number of apps used in the study. Authors [Ref], Year Store Venue No. apps
Shabtai et al. [207], 2010 g CIS 2,285
Chen and Liu [40], 2011 a iConference 102,337 Coulton & Bamford [49], ’11 n MobileHCI 3
Harman et al. [92], 2012 b MSR 32,108
Sanz et al. [197], 2012 g CCNC 820
Teufl et al. [218], 2012 g MobiSec 130,211
Zhu et al. [256], 2012 n CIKM 680
Mokarizadeh et al. [166],’13 g WEBIST 21,065 Teufl et al. [217], 2013 g Sec. & Com. Netw. 443
Lulu and Kuflik [22], 2013 g IUI 120
Bhattacharya et al. [25],’13 g CSMR 24
Yin et al. [249], 2013 a WSDM 5,661
Lin et al. [135], 2013 a SIGIR 7,116
Ihm et al. [107], 2013 g CGC 10
Kim et al. [122], 2014 a Service Business 100,830 Finkelstein et al. [65], 2014 b Tech. report 42,092 Yang et al. [248], 2014 g Tech report 26,703
Zhu et al. [257], 2014 n TMC 680
Zhu et al. [260], 2014 g KDD 170,753
Jiang et al. [109], 2014 g INTERNETWARE 150 Zhu et al. [255], 2014 a IEEE Cybernetics 15,045
Gorla et al. [79], 2014 g ICSE 32,136
Vakulenko et al. [222], 2014 a ICIS 600,000
Lin et al. [136], 2014 a SIGIR 6,524
Sarro et al. [202], 2015 b,s RE 54,983
Berardi et al. [24], 2015 a,g SAC 5,993
Svedic [212], 2015 a PhD thesis 60
Seneviratne et al. [205],’15 g WWW 232,906 Tong et al. [220], 2015 g,w JCST 10,000 Wang et al. [238], 2015 g UbiComp 7,923 He et al. [93], 2015 g Big Data 122,875
Tian et al. [219], 2015 g ICSME 1,492
Nayebi and Ruhe [172],’15 g PeerJ C.S. 241 Lulu and Kuflik [23], ’15 g MOB INF SYST 6,633 Al-Subaihin et al. [4], ’16 bg ESEM 17,877
Mean 51,203
Median 6,875
Features have been extracted from app descriptions, API usage, manifest files, decompiled source strings, cate-gories and permissions.
Papers in this section show that it is possible to extract feature information from sources other than source code or requirements lists. Additionally, many different methods are used for extraction and categorisation of features, including natural language processing, topic modelling and clustering. The work shows that analysis of app collections can be aug-mented with meaningful technically-oriented information, mined from freely-available app store pages.
Feature Analysis literature is broken down into “Classifi-cation”, “Clustering”, “Lifecycles”, “Recommendation”, “Suc-cess” and “Verification”. This section has an overlap with Sec-tion 10, in the cases where features are used to help detect anomalies or verify app functionality.
7.1 Classification
Shabtai et al. [207] extracted feature information from the manifest, XML files, API calls and methods used from a set of 2,285 Google Play apps. They trained a classifier on the features to differentiate between Tools and Games categories, as a proof of concept that malware detectors could be trained in the same way. In 2012 Sanz et al. [197] trained machine learning classifiers to predict app categories, using extracted features. The features used for prediction were strings extracted from the decompiled app code, requested permissions, rating, number of ratings and app size. They tested the approach on 820 apps and found a peak AUC (area under ROC curve) of 0.93 using the Bayesian TAN classifier [67].
Zhu et al. [256], [257] studied the problem of mobile app classification in the Nokia Store. The authors mined 680 apps, and experimented by classifying apps using data from web search and from device logs from users of the apps. Their approach outperformed other classification techniques, and enabled them to automatically classify a given app onto a predefined category of Apple’s App Store taxonomy. In 2015 Berardi et al. [24] built on this work, by constructing a clas-sifier using features mined from app descriptions, categories, names, ratings and file sizes. They trained the classifier using a support vector machine for each of 50 classes, and used the BM25 weighting scheme [190] on the features. Users manually classified 5,993 apps mined from Apple App Store and Google Play, to act as the training (cross validation) set for the classifier.
Jinh et al. [110] used the features: numbers of app installs, number of reviews, category and rating score, in conjunction with features based on information flow, for their machine learning classifier for rating app security risk. Wang et al. [238] extracted features from decompiledJava
code, from their collection of 7,923 apps mined from Google Play. They used the extracted features to train classifiers for predicting how ‘location’ and ‘contact’ information is used, with 85% and 94% accuracy, respectively.
Features have been extracted for use with classifiers, in order to differentiate categories, rate app security and to predict how sensitive information is used.
7.2 Clustering
Teufl et al. [218] mined 130,211 apps from Google Play and performed clustering on both app descriptions and requested permissions, as part of their activation patterns malware detection approach. They later extended this work [217] to propose a first-step malware detection method using links between description terms and security permissions to iden-tify suspicious outliers. In 2013 Mokarizadeh et al. [166] performed clustering on 21,065 apps, mined from Google Play, after applying topic modelling on app descriptions. They found that the resultant clusters were very different from the apps’ assigned categories, and apps in the same category often had dissimilar description topic distributions. Mokarizadeh et al. also performed correlation analysis and found that users downloaded free apps more frequently, and
that downloads correlated with the number of ratings an app had received.
Lulu and Kuflik [22] performed clustering on 120 apps mined from Google Play, comparing description-based with category-based clustering. They found that descriptions pro-vided good clustering features, and presented the method as the basis of an app recommendation system. The authors later built on this work [23], by extracting features from 6,633 app descriptions and enriching them with information mined from the web, found by searching for the app name. They used the enriched features to provide an installed-app recall interface, supported by functionality-based categorisa-tion. The interface was validated by performing a user study with 40 participants, who were able to find apps faster and found the categorisation more intuitive, when compared with a reference “smart launcher” interface [74].
Kim et al. [122] mined 100,830 apps from Apple App Store, and extracted feature keywords from their descriptions using natural language processing. They clustered apps using the extracted features, and re-categorised them using the resulting clusters. Al-Subaihin et al. [4] mined 17,877 apps from Google Play and Blackberry World app store. The au-thors clustered the apps using the similarity between features extracted from their descriptions. They scored the quality of the resulting clusters, and found them to be of higher quality than the existing categorisation of the mined apps. The authors conducted a human assessment of app similarity within clusters of varying granularity, and found a strong correlation between the similarity score of their technique and the human assessment.
Descriptions are often used for clustering apps based on their functionality. Clustering has been used to as-sign categories and to identify outliers. The clustering-assigned categories tend to differ from the store-clustering-assigned categories, and have also been shown to outperform them in feature classification quality.
7.3 Lifecycles
Sarro et al. [202] proposed a theoretical characterisation of feature lifecycles in app stores, to help app developers to identify trends and to find undiscovered requirements. In order to investigate app feature migratory and non-migratory behaviours in current app stores, they mined fea-tures from app descriptions using the techniques in the earlier work [92], and used the proposed theory to empirically analyse the migratory and non-migratory behaviours of 4,053 non-free features from Samsung and Blackberry stores. The results revealed that features generally migrated to a cate-gory with similar characteristics. However, there were also a few features that migrated to apparently non-related cat-egories. The early identification of these features may allow developers to find undiscovered requirements. The authors also found that approximately one third of features were intransitive (they neither migrate nor do they die out over the period studied), and such features exhibited significantly different behaviours with regard to important properties, such as their price. Being aware of the intransitive features
in a given category may support developers in identifying crucial (‘must-have’) requirements for their apps.
Features can migrate between apps and between cate-gories. Intransitive features that do not migrate have been found to exhibit significantly different properties than migratory features.
7.4 Recommendation
Yin et al. [249] proposed the Actual Tempting (AT) model to perform app recommendation for users. The model incorpo-rates latent tempting parameters. Take for example two apps, “a” and “b”. The AT model incorporates the number of users who own app “a” and subsequently download app “b”, and the number who do not download “b” after owning “a”. The model also uses feature overlap information, measured by performing topic modelling on app descriptions and comput-ing the topic overlap between each pair. The authors found that the AT approach outperformed collaborative filtering and case-based reasoning in their initial experiments.
Lin et al. [135] used topic modelling on the Twitter messages of users that follow an app’s Twitter feed, in order to generate latent groups related to the app. The groups were then used as part of a recommendation system, in order to help remove the problem of cold start in app recommendation based on other metadata. The system was tested on 7,116 apps mined from Apple App Store, and the authors found that it outperformed recommendation using app descriptions. In 2014 Lin et al. [136] used topic modelling on app descriptions in order to produce a rec-ommendation system. The model was semi-supervised and incorporated app version information using different weights corresponding to update types: so that newer app versions could be recommended when they add a certain feature to the description. Resultant topics were weighted based on their category in the app store to provide a recommendation. The model was trained on 6,524 apps mined from the Apple App Store.
Zhu et al. [255] mined the daily top 300 free and top 300 paid apps from Apple App Store charts from February 2, 2010 to September 17, 2012, collecting information on 15,045 apps in total. They used popularity information to construct a Popularity-based Hidden Markov Model (PHMM), to encode trend and other latent factors. The authors stated that this can be used in a variety of ways, including app recommendation, review spam detection, and demonstrated its usefulness in ranking fraud detection. Zhu et al. [260] built an app recommendation system using a combination of technical information (device permissions requested) and non-technical information (app popularity). They tested the system on 170,753 apps mined from Google Play to show its scalability. However, the system received no human-based evaluation of its recommendations.
Valulenko et al. [222] performed topic modelling on a set of 600,000 app descriptions mined from the Apple App Store. They used the resultant topics to suggest categories, and to improve and augment existing categorisation approaches used in app stores. He et al. [93] trained a system for targeting users for advertising, with a dataset containing
app install data on a per-user basis, consisting of 122,875 apps from the Huawei App Store. The authors reported a higher click rate than targeting approaches existing at the time of writing. Nayebi and Ruhe [172] extracted feature information from 241 Google Play apps, and used crowd-sourcing to assign user value to each of the features. The authors used the approach for service portfolio planning [2].
A variety of models have been trained on app feature data, incorporating hidden ‘latent’ factors, that are sub-sequently used to recommend apps to users, target users for advertising, and to suggest categories.
7.5 Success
In 2011, Coulton and Bamford [49] conducted a case study on games created for the WidSets platform, an earlier app store for Nokia phones (including non-smartphones). Their findings are transferable to modern app stores: high down-load numbers were required in order to gain active users, and popular features such as chat were able to increase the popularity and the proportion of active users. Chen and Liu [40] collected 102,337 apps from Apple App Store, and observed no correlation between download rank and rating, from a sample of the top 200 most popular apps.
Harman et al. [92] introduced app store mining as an MSR (Mining Software Repositories) problem. They mined app information and performed correlation analysis on price, downloads, and rating. Correlation analysis was performed in both app and feature space, where features were extracted using natural language processing techniques from app de-scriptions, and results showed that under most conditions there is a strong correlation between rating and downloads (popularity). The proposed approach can be applied to differ-ent app stores by modifying the data extraction and parsing phases to accommodate the different app store structure and data representations. The authors later extended this work [65], finding that free apps have higher ratings than non-free apps, with a medium effect size. They also carried out a developer survey on the extracted features, who found them meaningful, and were able to successfully detect the extracted features over randomly generated features.
Bhattacharya et al. [25] presented an empirical study of 24 open source Android apps from multiple categories, with the aim of defining metrics of bug report quality and developer involvement. The authors showed how the bug-fix process is affected by differences in bug lifecycles. Security bug reports were found to be of higher quality, but the associated bugs are fixed more slowly. The scale of the study was large as all apps had more than 1,000 ratings, 100,000 downloads and 200 bug reports. The authors found that bug report quality correlates with description length but not app rating.
Ihm et al. [107] conducted a study on 10 popular apps in the Google Play store, analysing the correlations between app downloads in the store and external metrics. The authors found a strong positive correlation between the number of downloads in the store and the number of registered users on the app’s respective websites, and a strong correlation between the number of downloads and the app website
(inverse) download rank. Jiang et al. [109] conducted a user survey on 50 app descriptions in order to identify the attributes most important to the quality of a description. A support vector machine was trained on the resultant at-tributes and tested on a sample of 100 descriptions, find-ing an accuracy of 0.62. The findfind-ings showed that quick overviews were the most effective form of app description, and the study contains further heuristics on good description styles.
In a longitudinal study on 60 paid iOS apps, Svedic [212] found that ratings and reviews can impact sales ranks. The study found that higher, more stable ratings lead to users associating the app with high quality, and the app sales increased as a result. Tian et al. [219] studied 1,492 high and low rated apps from Google Play, and identified the features which most accurately differentiate apps with high rating from those with low rating. The authors used technical features, such as code complexity and API usage, with non-technical information such as the category and the number of images displayed on the app store page. The most important features for differentiating high from low rated apps were the size of the app and the number of images on store page. The target SDK version was also an influential feature, which suggests that high rated apps were updated more frequently and used more modern features of the Android operating system.
Ratings and reviews have been found to correlate with sales and download ranks. Features mined from app descriptions can be used as a basis for correlation anal-ysis, and have been found meaningful from a developer survey.
7.6 Verification
Yang et al. [248] introduced the APPIC framework, which extracts main theme tag words from Android description and permission files. It does this using LDA and Partially Labelled Dirichlet Allocation (PLDA), for the purpose of identifying misleading app descriptions. It uses an app’s permissions file to establish whether its description makes claims consistent with its functionality, and whether it resides in an appropriate category. The method was tested on 207,865 apps from Google Play, and was manually evaluated on a subset of 1,000 apps. The authors found that their method achieved (average) 88.1% category accuracy, and 76.5% permissions accuracy.
Watanabe et al. [242] found that apps often contain secondary functionality that is not mentioned in their descrip-tions. In a study of 232,906 apps, Seneviratne et al. [205] trained a machine learning classifier on app features in order to detect spam apps. The features used for the classifier were numeric statistics about an app’s description. The authors labelled apps that were removed from the store and estab-lishing potential reasons for removal. Apps likely to have been removed due to being spam (the majority of those removed) were then used to train a boosting classifier in order to identify potential spam.
Tong et al. [220] proposed the App Generative Model(AGM) topic model, for extracting semantically
coher-TABLE 5
Chronological summary of release engineering-related App Store Analysis literatureshowing the authors, publication year, store used: g signifies Google Play or other Android stores, a signifies Apple App Store and w signifies Windows Phone; the type of literature, and the
number of apps used in the study.
Authors [Ref], Year Store Venue No. apps
Lee and Raghu [125], 2011 a AMCIS 3,168
Henze and Boll [95], 2011 a MobileHCI 24,647 Datta and Kajanan [54], 2013 a CloudCom-Asia 3,535
Lee and Ragu [126], 2014 a JMIS 7,579
Ruiz et al. [194], 2014 g IEEE Soft. 120,981
Guerrouj et al. [84], 2015 g SANER 154
Comino et al. [45], 2015 a,g Tech report 1,000
McIlroy et al. [159], 2015 g ESE 10,713
Gui et al. [85], 2015 g ICSE 21
Carbunar and Potharaju [33],’15 g ASONAM 160,000 Alharbi and Yeh [6], 2015 g MobileHCI 24,436 Martin et al. [153], [155], 2016 g,w ICSE comp. 1,033
Martin et al. [156], 2016 g FSE 38,858
Mean 29,772
Median 5,557
ent app features from descriptions, using term co-occurrence statistics. The AGM model resulted in lower perplexity (a topic model fitness function that measures the log-likelihood of generating a held-out test set), than the most commonly used model, LDA. However, the model precision was evalu-ated only against TF.IDF, and not LDA or similar topic models such as the weighted topic model [162]. Nevertheless, the study shows the importance of accurate feature discovery and representation, and can help lead to future studies using extracted features.
Features have been used in a classifier for spam de-tection, and to validate whether an app makes correct claims about its functionality.
7.7 Future Work
There is potential for future work in tracking feature mi-gration in alternative app stores: thus far the literature has studied apps mined from Blackberry and Samsung stores. Ad-ditionally, future work may seek to investigate the migration of features between different app stores or platforms.
Features have been used to classify and cluster apps, as well as recommend similar apps or categories. However, future work may apply recommendation in a different di-rection: it could be very useful for developers to receive recommendations on features they might implement, based on similar apps, highly desirable intransitive features, or other methods.
8
R
ELEASEE
NGINEERINGThis section discusses papers that focus on app releases or release strategies, which are summarised in Table 5. We can see from Table 5 that there were two papers published in 2011 that tackle this issue, one in 2013, and then a recent influx of five prior to November 27, 2015. Release studies typically require time series data, in order that the changes made to apps in their releases can be recorded. The scale
of the past studies in this section is relatively small, ranging from 21 to 160,000; this scale is not surprising, given the difficulty of mining longitudinal data for a large number of data points.
Release Engineering literature has featured Apple and Google platforms but not yet Blackberry, Samsung or Windows. The scale in studies has been small, most likely due to the difficulty in obtaining time series data.
Release Engineering literature is broken down into “Con-tent”, “Success” and “Strategy” subsections.
8.1 Content
The 2014 study by Ruiz et al. investigated the updates made to update advertisement libraries [194]. They found that over 12 months, almost half of the 5,937 apps with multiple updates had an advertisement library update. Approximately 14% of advertisement updates contained no changes to the app’s code, indicating the effort involved in keeping adver-tisement libraries updated. Gui et al. found, from 21 apps in Google Play with frequent releases, that 23% of their releases contained ad-related changes [85].
The findings of Guerrouj et al. [84] indicate that high code churn in releases correlates with lower ratings. Alharbi and Yeh [6] tracked the design patterns used by 24,436 Android apps over a period of 18 months. They found that depreciated patterns were sometimes adopted after they are depreciated, and that new pattern adoption rates were low. By tracking the app descriptions, they found that app developers sometimes updated the app descriptions to reflect changes in their applied design patterns. The authors believe that this shows that descriptions are used as a communication channel between developers and users. The authors report on apps that start and stop using certain design patterns. An interesting future research direction might be to record the migration of these “design features” using the app feature migration terminology of Sarro et al. [202].
Up to half of app updates over a 12 month period are advertisement library updates, which have been found to contain no other changes in 14% of cases. High code churn has been found to correlate with lower ratings.
8.2 Success
Moller et al. [170] studied the installation behaviour of users with recently updated apps, in a security related study. Lee and Raghu [126] studied the factors that affect an app’s likelihood of staying in the top (most popular) charts in the Apple App Store. They found that free apps are more likely to ‘survive’ in the top charts, and that frequent feature updates are the most important factor in ensuring their survival, along with releasing in smaller categories. The authors also found that high volumes of positive reviews improve an app’s likelihood of survival.
Carbunar and Potharaju [33] conducted a longitudinal study on 160,000 Google Play apps mined daily over a 6
month time period in 2012. They found that at most 50% of apps were updated in each category, and that there is an issue of “stale apps” affecting aggregated statistics on large populations. The authors also found that a few developers dominated the total download counts, that productive devel-opers did not have many popular apps, and that there was no correlation between price and downloads.
Martin et al. [153], [155] conducted a longitudinal study on 1,033 apps mined from Google Play and Windows Phone Store over a 12 month time period. The authors used causal inference to identify the releases with most impact on ratings and downloads. They found that release text discussing fea-tures and not bug fixes may have led to more significant re-leases, and releases that improved rating. Martin et al. [156] later extended this work on a sample of 38,858 apps from Google Play, using their tool, CIRA. They found that paid apps that had significant positive effects on success were more expensive. The authors also contacted the developers of significant releases, finding that 78% agreed with the causal assessment and 33% would consider changing their release strategy based on findings from the study.
Positive reviews and frequent feature updates can help to keep free apps in the “most popular” charts. Causal inference has been used to identify releases with high impact on ratings and downloads.
8.3 Strategy
Lee et al. [125] published the earliest work that meets our definition of “app store analysis” in 2011 by incorporating technical with non-technical information for analysis of apps. The authors mined app information from the top 300 iOS apps in all 21 categories free and paid, mining at least 3,168 apps. They analysed developer diversification through publishing apps in multiple categories and in both free and paid sections, and found a positive relationship between download rank and app portfolio diversification. The study incorporated technical (download rank) with non-technical information (category, price) in order to identify actionable findings for app developers.
Henze and Boll [95] analysed release times and user activity in the Apple App Store, and concluded that Sunday evening was the best time for deploying games. Their study also found that version updates were an effective strategy for raising an app’s rank in the store. Datta and Kajanan [54] studied review counts from the Apple App Store, and found that apps received more reviews after deploying updates on Thursdays.
In 2014 Lin et al. [136] incorporated version information in their app recommendation system, in order to ensure that apps were recommended if they added new features to updated versions. Comino et al. [45] studied the top 1,000 apps in Apple App Store and Google Play. They found that for iTunes, increased numbers of app releases were more likely when the app was performing badly, and that releases could boost downloads. Neither finding held true for Google Play, however.
McIlroy et al. [159] studied update frequencies in the Google Play store, after mining data about 10,713 mobile
apps. They found that only 1% of the studied apps received more than one update per week, and only 14% were updated in a two-week period. The authors also found that rating was not affected by update frequency. Nayebi and Ruhe [172] combined app features with values gained from crowd-sourcing as an approach to app service portfolio planning.
App updates have been found to be more likely when an app is performing badly, and releases can boost down-loads in the Apple App Store. Multiple studies suggest that day of release is a factor in the immediate success of app releases.
8.4 Future Work
Due to the 2015 spike in release engineering studies, we expect the trend to continue and contribute to the growing numbers of App Store Analysis literature. As can be seen in Table 5, the stores studied are split almost equally into Apple and Google, but there is potential future work involv-ing release studies on Blackberry or Windows Phone Store.
Several studied in this section have looked at developer strategy, and release behaviours that associate with positive results. A potential for future work could be individualised recommendation of strategy, which could be particularly useful for app developers who wish to break into higher app store ranks.
9
R
EVIEWA
NALYSISLiterature discussed in this section concerns the study of app reviews; a summary of discussed literature can be found in Table 6. We can see from Table 6 that the majority of studies focused on the Google Play store, with a minority focusing on Apple App Store, and 1 paper studying Black-berry store. Review-centred literature was first published in 2012, and subsequently has gained significant and increasing interest and activity: we can see from Figure 3 that there are greater numbers of requirements/reviews literature each year. We hypothesise that this is due to the tenure of the stores, and the progression of the field.
Review Analysis literature mostly studies Apple and Google stores, inviting future comparison with Windows and other store reviews.
Literature in this section is broken down into “Classification”, “Content”, “Requirements Engineering”, “Sentiment”, “Sum-marisation” and “Surveys and Methodological Aspects of App Store Analysis”. Many early works have focused on the con-tent of reviews in 2012-2013, before advancing to sentiment in 2013-2014, and requirements and summarisation in 2015. 9.1 Classification
Chandy and Gu [38] mined 6,319,661 reviews from 3,090 apps in the Apple App Store. After manually labelling a subset of the mined reviews as spam or not spam, the authors trained both a supervised decision tree and unsupervised la-tent class analysis to identify spam reviews. The unsupervised