This is the accepted version of the following article: Abril, D; Navarro,
G. and Torra, V.
Spherical microaggregation: anonymizing sparse
vector spaces
in Computers and security (Ed. Elsevier), vol. 49
(March 2015), p. 28-44.
Which
has
been
published
in
final
form
at
DOI
10.1016/j.cose.2014.11.005
© 2015. This manuscript version is made available under the
“All
rights reserved” license
Spherical Microaggregation: Anonymizing Sparse
Vector Spaces
∗
Daniel Abril
1,3, Guillermo Navarro-Arribas
2, and Vicen¸c Torra
11
IIIA, Institut d’Investigaci´
o en Intel.lig`
encia Artificial - CSIC,
Consejo Superior de Investigaciones Cient´ıficas.
2
Dep. of Information and Communications Engineering, UAB,
Universitat Aut`
onoma de Barcelona
3
UAB, Universitat Aut´
onoma de Barcelona
Abstract
Unstructured texts are a very popular data type and still widely un-explored in the privacy preserving data mining field. We consider the problem of providing public information about a set of confidential docu-ments. To that end we have developed a method to protect a Vector Space Model (VSM), to make it public even if the documents it represents are private. This method is inspired by microaggregation, a popular protec-tion method from statistical disclosure control, and adapted to work with sparse and high dimensional data sets.
1
Introduction
In the last years, the quantity of stored personal information has been increasing exponentially and it has created a problem of privacy due to the inherent tension in mining those sensitive data bases. Since that, research fields such as privacy preserving data mining has got an important role in the community and a number of different methods have been proposed for privacy preserving data mining. Although, sanitization methods explicitly remove identifiers like names, phone numbers, addresses, etc., they are not enough to protect individual’s privacy. Therefore, we should delete other additional information so an attacker cannot infer an identity or other sensitive information about an individual based on the remainder information.
∗Author generated postprint of: Daniel Abril, Guillermo Navarro-Arribas, Vicen Torra,
Spherical microaggregation: Anonymizing sparse vector spaces,Computers & Security, Vol-ume 49, 2015, Pages 28-44, ISSN 0167-4048,https://doi.org/10.1016/j.cose.2014.11.005
In this paper we address the problem of how to release a set of confidential documents without giving away sensitive information that can be linked to spe-cific individuals and also achieved with the minimum loss of information. Given a set of confidential, and thus, private documents we want to provide some pub-lic metadata to be used for analysis and mining, which preserves the privacy or the anonymity with respect to the original documents. To address the prob-lem we have relied on a well known data representation of a set of documents, the Vector Space Model (VSM) [34], which is widely used in information re-trieval and text mining. Following these ideas our proposal can be summarized as providing a secure VSM, which closely represents a set of documents while preserving the anonymity of the documents. The protected VSM can be made public, while the original documents are kept secret. This allows to perform some information retrieval and text mining tasks on the set of documents while preserving the privacy of the documents.
It is important to clarify what do we consider as private information with respect to a set of documents. In this work we have focused to the concrete protection of the document owner, creator, or the entity to which the document is explicitly related. We try to prevent the ability of an attacker to correctly link a given document (or document representation) to a concrete entity (individual, organization, . . . ). That is, depending on the protection purpose, we want to avoid the possible link an attacker can establish between a document and its writer, or on the other hand, we also want to avoid the possible link an attacker can establish between a document and the entity which it is about. We will discuss several possible scenarios that present this particularity or threat, some clear examples are a set of health patient records, research project proposals, individual posts to a private internet forum, . . .
To achieve the protection of the VSM we rely in the k-anonymity prop-erty [35, 39]. Our proposal provides a protection method that yields a k -anonymous VSM. As we will see, this will ensure that at leastk vectors (docu-ment representations) in the VSM are equal to each other providing an upper bound on the probability to link an entity to the specific document.
1.1
Motivation
To better shape our proposal we present here three motivating scenarios. In short, the presented anonymization technique is suitable for scenarios involving a set of confidential documents in which each document is directly or indirectly related to one or a set of different entities. A direct relation is when the doc-ument contains sensitive information of the specific person or institution that must be anonymized, while an indirect relation is when the document does not contain explicit information about the entity to be anonymized, but also there is an implicit relation between the entity and the document that can be inferred through some other document properties. We describe three cases where our proposal has a direct application.
is within the research community, in the information retrieval and text mining fields. Several organizations present their research at scientific journals or conferences. Usually, the experiments presented showing their improvements and validating their research are done over some private datasets. However, when other researchers want to reproduce those ex-periments it becomes impossible, since the datasets are private and can contain confidential information. Examples are a set of patient health records, user posts to a private Internet forum, a set of user profiles from a social network, or even a set of user queries made to a search engine (recall the infamous AOL search data leak [8]).
A possible solution is to publish an anonymized data that represents the original dataset and can be used to reproduce to some extent the research made on the original dataset. This is straightforward in text mining re-search where the VSM is frequently used to represent a set of documents, but other similar data structures can be envisioned with the same purpose for more specific tasks.
Private profiling data for advertising. Personalized online advertisement is another possible area where anonymization should be considered. Lots of web services are offering their services for free in exchange of intro-ducing advertisements on their services. Google, Twitter or Facebook are some examples of companies, which collect and store thousands of users’ confidential information in order to analyze and offer targeted advertise-ments [31, 36]. E-mails, user’s posts or even personal docuadvertise-ments are some clear examples. In some cases these data could be transferred to special-ized companies, which analyze all data in order to define advertisement strategies in a user base.
These user data might be considered confidential, and might not be di-rectly transferable to other parties. Therefore, the solution is to anonymize the data before its transference. The idea behind this approach is that the advertisement company will not be able to distinguish a unique user from a set ofk of them. Hence, the advertisements selected for a single user are actually extracted from a mix of several user’s profiles.
Anonymized metadata from public tender. As a last example, we can con-sider for instance a government agency managing applications to public research project funding. Such applications should be kept private, but at the same time it can be interesting to be able to give some information about the applications and more precisely of the projects presented by the applicants. This becomes specially difficult if we assume that the projects are written in a free-form text. This information is interesting not only to the community applying for funding but also to the administration and politicians. We are looking for information such as: “this geographic area applies for projects about this topic”, or “this methodology is proposed by a given percentage of researchers from these given topics”. While this in-formation can be valuable it normally does not reveal specific and private
information.
1.2
Contributions and plan of the paper
The major contributions of this paper are as follows. We provide a new approach for the anonymization of very sparse and high-dimensional data sets. We con-tinue and improve the work presented in [3], in which the authors presented a first microaggregation approach for the anonymization of document space vec-tors. We propose an adaptation in the partition and aggregation functions of microaggregation in order to improve the data quality of the output protected data. That is, the anonymization method has to protect an original data set ensuring the entities’ confidentiality and achieve it with the lowest loss of in-formation, so that this anonymous data could reflect as much as possible the original data distribution. Therefore, given that microaggregation is a distance based clustering approach we propose to use the cosine dissimilarity, instead of the Euclidean distance, in order to find a better partition for sparse data sets. Moreover, we also improve the way clusters’ representatives should be computed. A cluster representative is the vector which is the closest in terms of cosine distance (in average) to all data vectors belonging to its respective parti-tion. A mathematical proof is provided to support our proposiparti-tion. Finally, the evaluation of the method is conducted by performing a large set of experiments on two different sparse and high-dimensional data sets.
The rest of the paper is organized as follows. Section 2 presents an overview of the literature related to anonymization of textual data. Section 3 introduces preliminaries for the set of documents preprocessing and its representation as a VSM, as well as the definition of what we consider in this work as an anonymous VSM. In Section 4 we present a brief introduction to the classical microaggrega-tion algorithm and our proposal to anonymize VSMs. In Secmicroaggrega-tion 5 we provide an evaluation of our proposal. Data is described and analyzed before and after its corresponding anonymization. These evaluations are performed by means of different traditional information retrieval techniques. Finally, the conclusions are given in Section 6.
2
Related Work
There are two existing work areas related to text-based documents protection. The first one, and probably the best known, is the single document sanitization, such technique is needed while declassifying documents involving sensitive or confidential information, such as names, telephones, etc. The second research line, most related to ours, is the document anonymization while preserving text mining. So, as text mining primary task is the development of models, with the anonymized texts sets we will be able to develop accurate models which are similar to models developed with original text sets.
Document sanitization consist of two tasks. The detection of sensitive data within the text and then, the hiding or deletion of such detected information,
with the aim of minimizing the disclosure risk, while causing the least distortion to the document content. The first task is usually solved by using Named Entity Recognition and Classification systems, such as [37, 32]. The second task has been developed in different ways. Chakaravarthy et al. [9] presented the ERASE (Efficient RedAction for Securing Entities), a system for preforming document sanitization automatically based on entities suppression. Perturbation was also a solution for hiding personal identity information employed in [32]. In [7], the author used an ontology to replace sensitive nouns with other words semantically more general.
The literature concerning to the second line of research, textual data anonymiza-tion preserving a certain degree of mining, follows the research direcanonymiza-tion of two more established disciplines, as are Statistical Disclosure Control (SDC) [43] and Privacy Preserving Data Mining (PPDM) [6]. They provide a set of protec-tion techniques for statistical data sets, microdata, that preserve data mining and also a set of measures to evaluate disclosure risk [40] and information loss [12, 1] of protected data.
Recently, several research works have been interested in the protection of text-based data sets while preserving text mining. Relying on the basic anonymiza-tion principles stated by PPDM and SDC, those works have presented either new or modified existing protection techniques for textual data. Most of them were geared towards the problem of anonymizing search engine query logs after the highly publicized case in 2006, were AOL in an attempt to help the infor-mation retrieval research community released several million search queries to the public after performing a very simplistic anonymization. However, through analysis of text and linking attributes from the queries to public data, one user was re-identified [8]. For instance, in [26] the authors argued that removing some queries from the log does not preserve and acceptable privacy degree and they present a technique for query-anonymization, they ensure thek-anonymity in query logs by aggregating them. In the same direction, Erola et al. [16] introduced a variation of the microaggregation method, which enforced userk -anonymity by taking into account the semantic similarity between user queries relying on a hierarchical ontology, such as the Open Directory Project (ODP). The cluster representatives are made by selecting specific queries form each user in the group, that is, queries that are semantically close and/or that are in deeper ODP levels.
Other related works have been focused on semantic microaggregation vari-ations by means of introducing external knowledge databases, such as Word-Net [25], a hierarchical ontology of English words. The authors in [2] exploit WordNet to group the most similar attribute sets according to the similarity of their meanings. Then, each group is represented by a centroid, which is the taxonomical common ancestor of all the grouped terms. (e.g., truck<motor ve-hicle). Improving some drawbacks in that paper, authors in [23, 24] extend the microaggregation algorithm to support non-numerical (categorical) attributes defining an appropriate distance and aggregation operator. They introduce a weighted semantic distance and an aggregation operator that integrates the distribution and the semantics of the data.
In [20] the authors focused on preserving privacy in publishing vocabular-ies, that is, very sparse bag-valued data extracted from a web query log. They extend the k-anonymity principle to ensure that every vocabulary for a given granularity is indistinguishable from at leastk−1 other vocabularies, they call this principle vocabulary k-anonymity. They proposed a semantic similarity based on clustering for retaining enough data utility, relying on the minimum path distance over a semantic network, such as WordNet, between a pair of terms. Unlike previous authors, they substituted the terms with semantic simi-lar terms, because they stated that for sparse data the generalization operation suffers from a high loss of information.
Unlike the previous research studies, we focus our work on the protection of vector spaces (i.e., texts are mapped onto document-term matrices), which are supported by lots of traditional information retrieval and data mining anal-ysis algorithms. These text mappings lead to very sparse and high-dimensional data matrices and, although the application of anonymization to vector spaces is recent, other researchers have also been focused towards the anonymization of high-dimensional spaces. Ghinita et al. [17] proposed an anonymization technique which combines the advantages of both generalization and permuta-tion whose main idea is to first group closer transacpermuta-tions and then associate each group to a set of diversified sensitive values. Lasko and Vinterbo [19] introduced the term spectral anonymization to refer to an algorithm that uses a spectral basis for anonymization instead of an original data. They also presented two spectral anonymization examples, one based on data swapping and the other based on Recursive Histogram Sanitization, a microaggregation method.
Our proposal relies in k-anonymity to ensure a certain degree of privacy. The protected data is completely k-anonymous in the sense that there are k
vectors completely undistinguishable. Therefore, contrary to other works on
k-anonymity, there is no need for additional protection mechanisms regarding unprotected sensitive attributes such asl-diversity [22]. This ensures that re-identification algorithms [4, 27] will have a re-re-identification probability bounded byk.
In this paper, we have continued the work started in [3], in which the authors present a very first approach for vector space models anonymization based on MDAV [13], a microaggregation method. Although, they decided to use the co-sine distance to determine the similarity of two vectors, their proposed method generates all centroids by computing the mean of all vectors within each parti-tion. However, none of these centroids minimize the sum of distances between itself and all the vectors contained in its corresponding partition. For this rea-son, we propose and prove how these centroids should be computed in order to equally represent all the elements of a cluster.
3
Document Representation: towards a privacy
preserving VSM
A bag-of-words is a simplified document representation that considers a docu-ment as an unordered collection of words. Take into account that unlike a set of words, a bag-of-words allow word duplicates. Neither the original word order nor the word syntax and grammar are considered. However, this fact makes the representation a very simple model, which can be easily extended by means of extracting different term-weights for each of the words in a document. The objective of such weighting representation is to enhance discrimination between various document vectors and to enhance retrieval effectiveness [33].
Each document can be represented as a term-weight vector and therefore the whole collection of unstructured texts is represented as a document-term matrix, where the rows are the documents and the columns are the weights corresponding to the relevance of each term in each document. This represen-tation is called the Vector Space Model (VSM) and it is commonly used in the information retrieval and computer vision areas due to the ease to operate with vectors. The VSM is a simple model based on linear algebra, which allows the computation of continuous distances between documents, ranking them in order of relevance to a given query, partial matching, . . .
As previously described our proposal introduces an anonymization process for the VSM. In the following section we describe how the VSM is obtained and what do we understand by an anonymous VSM.
3.1
Document processing
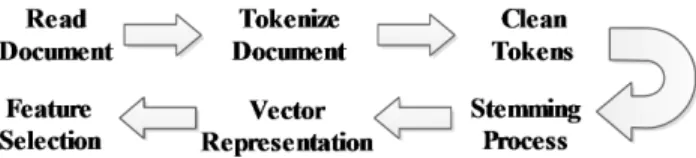
Figure 1 shows the document preprocessing steps. In order to represent each document as a vector of terms, the documents are read and tokenized. However, not all the words included in a document are useful when using text classifica-tion or informaclassifica-tion retrieval techniques. These words, called stop-words, are removed. Moreover, we consider an additional step in the cleaning process. It consists in removing all the words which are not in the WordNet ontology [25] (note that we will be dealing with English texts). This last step adds a simple additional protection level by removing words, which are proper names or very specific terms of a particular field. In case that the analysis to be carried on the text data requires such words this step can safely be removed since the pro-tection method that we have developed ensures k-anonymity on the resulting VSM.
Once all documents are cleaned, we decide to apply two feature reduction measures. Firstly, we remove all words with two or less letters and secondly, we apply the Porter stemming algorithm [30]. This algorithm considers all words with the same stem as the same word, producing a reduction in the size of the feature set. Note that these feature reduction measures are not compulsory, so data owners should decide its application depending on their data sets and goals.
Figure 1: Document preprocessing techniques.
The document vectorization is done by means of selecting a value/weight to represent the relevance of each word within a document or collection of docu-ments. There are different ways to measure the relevance of words, such as a binary representation, the frequency of each word, the information gain, etc. We have used the term frequency-inverse document frequency, known astf-idf [21].
Thetf-idf increases proportionally to the number of times a term appears in a
document, but it is countered by the frequency that term appears in the text collection, also called corpus. Equation 1 shows the relation between the term frequency of a term in a single document and the frequency of the term in the corpus. That is,
tf-idf(t, d, D) =tf(t, d) log |D|
| {d∈D:t∈d} | (1) wheretis a term of the corpus,dis a document andD is the set of documents.
tf(t, d) denotes the raw frequency of a term in a document.
In the VSM model it is beneficial to abstract out the magnitude of the term weights because it takes out the influence of the document length: only the relative weights across documents are important and not how big the document is. For that reason each document can be normalized to have unit norm, same direction but with length 1. That is, the division of each of the document vector,
~ di, by itsL2-norm: ~ v0 = d~i kd~ik = ~ di q P jd~i 2 j (2)
The last step is the feature selection. This is a useful step when we are dealing with a big corpus and a reduction of features can improve the model. Therefore, the features, in our case all the vocabulary terms, are sorted in terms of the given weights and the most relevant ones are selected while the others are discarded.
Finally, the set of all document vectors can be seen as a document-term matrix, where the rows represent each document and the columns are the cor-responding term weights.
3.2
Anonymous VSM
The purpose of our work is to provide an anonymous or privacy-preserving version of a given VSM, so it satisfies thekanonymity property with respect to
document owners or entities to which the document is related. In this sense we define ak-anonymous VSM as follows.
Definition 1. A VSM is said to satisfy k-anonymity if for every vector ~v in
V SM, there are at leastk−1 vectors equals to~v.
This is preformed by means of constructing groups of indistinguishable k
records, in which the statistical characteristics of these groups are used to gen-erate a group representative that is used for data mining purposes. Although, such representative records do not represent the true data vectors, they are use-ful for most modelling purposes, since they reflect the original distribution of the records.
For instance, imagine a VSM representing a set of patient records, where each row corresponds to a unique patient. Itsk-anonymous VSM version will have a certain number of sets withk indistinguishable patients. Therefore, the probability of linking a given record to a given patient is bounded by the selected
k.
4
Anonymization of the VSM
Our method to anonymize the VSM is based on microaggregation, which is a popular method used in SDC and PPDM. The idea behind microaggregation is to modify statistical data so they can be released and analyzed by third parties without giving away sensitive information that can be linked to specific individuals and in addition this modification should ensure the minimum loss of information as possible.
Section 4.1 explains the microaggregation algorithm and in Section 4.2 we introduce our proposed microaggregation variation to anonymize sparse and high-dimensional models, such as the presented vector spaces model.
4.1
Microaggregation
Microaggregation is a well known anonymization technique that provides privacy by means of partition the data into small clusters and then replacing the original data by the representatives of the corresponding clusters.
Privacy is achieved ensuring that all clusters have at least a predefined num-ber of elements, saykto the number of values and, therefore, there are at least
krecords with the same value and hencekindistinguishable records. Note that all records in a specific cluster are replaced by the corresponding representa-tive/centroid values of this cluster.
Microaggregation was originally [10] defined for numerical attributes, but later extended to other domains, e.g., to categorical data in [41] (see also [14]), and in constrained domains in [42].
From the operational point of view, microaggregation is defined in terms of partition and aggregation:
• Partition: Records are partitioned into several clusters, each of them consisting of at leastk records.
• Aggregation: For each of the clusters a representative (the centroid) is computed, and then original records are replaced by the representative of the cluster to which they belong to.
From a formal point of view, microaggregation can be defined as an optimiza-tion problem with some constraints, so it should minimize the informaoptimiza-tion loss resulting from this replacement process, in other words, the difference between all the elements of each cluster (xj) and its corresponding centroid (vi) should be as minimum as possible. We give a formalization below usinguij to describe the partition of the records in the sensitive data setX withnrecords. That is,
uij = 1 if recordj is assigned to the ith cluster. Let vi be the representative (centroid) of the ith cluster, then a general formulation of microaggregation withgclusters and a givenkis as follows:
Minimize Pg i=1 Pn j=1uij(d(xj, vi))2 Subject to Pg i=1uij= 1 for allj= 1, . . . , n 2k≥Pn j=1uij≥kfor alli= 1, . . . , g uij ∈ {0,1}
For numerical data it is usual to require thatd(x, v) is the Euclidean distance. In the general case, when attributesV = (V1, . . . , Vs) are considered, xandv are vectors, andd becomes d2(x, v) =P
Vi∈V(xi−vi)
2. In addition, it is also
common to require for numerical data thatviis defined as the arithmetic mean of the records in the cluster. That is,vi=Pnj=1uijxi/Pnj=1uij. As the solution of this problem is NP-Hard [28] when we consider more than one variable at a time (multivariate microaggregation), heuristic methods have been developed.
MDAV [13] (Maximum Distance to Average Vector) is one of such existing algorithms. It is explained in detail in Algorithm 1, when applied to a data setX
withnrecords andAattributes. The implementation of MDAV for categorical data is given in [14].
Note that when all variables are considered at once, microaggregation is a way to implementk-anonymity [35, 39].
4.2
Spherical Microaggregation
In this section we present which changes should be applied to the classic mi-croaggregation algorithm in order to obtain better results when it is dealing with sparse and high-dimensional data, such as vector spaces.
It was shown in the previous section that microaggregation works as a distance-based clustering algorithm. However, it was defined to work with low-dimensional and dense data and therefore, our goal is to extend its functionality
Algorithm 1:MDAV
Data: X: original data set, k: integer
Result: X’: protected data set
1 begin
2 while(|X| ≥3∗k)do
3 Compute average record ¯xof all records inX;
4 Consider the most distant recordxr to the average record ¯x;
5 Form a cluster aroundxr. The cluster containsxrtogether with thek−1 closest records toxr;
6 Remove these records from data setX;
7 Find the most distant recordxsfrom recordxr;
8 Form a cluster aroundxs. The cluster containsxstogether with thek−1 closest records toxs;
9 Remove these records from data setX; 10 if (|X|>= 2∗k)then
11 Compute the average record ¯xof all records inX;
12 Consider the most distant recordxr to the average record ¯x;
13 Form a cluster aroundxr. The cluster containsxrtogether with thek−1 closest records toxr;
14 Remove these records from data setX; 15 Form a cluster with the remaining records;
to vector space models of large document collections, or in other words, very sparse and high-dimensional models.
It is well known how in distance-based clustering algorithms the use of dif-ferent distances lead to difdif-ferent data partitions and so, depending on the data type used one distance can obtain better results than others. Strehl et al. [38] or Dihllon and Modha [11] demonstrate that Euclidean distance is a weak dis-criminant when data is multidimensional and sparse. Therefore, in order to adapt the microaggregation algorithm a new distance function has to be con-sidered, and as a consequence, we are forced to modify the aggregation function to another that fits better with the considered distance. That is, the resultant aggregated vector, or centroid, should minimize the sum of distances between all the cluster members and itself.
To do so, we have focused on the spherical k-means clustering algorithm, presented by Dihllon and Modha [11], due to its similarities with the presented problem. Their objective was to adapt thek-means clustering algorithm results for vector spaces by means of using the cosine similarity and an aggregation function that computes the best representative for a given cluster, according to the cosine similarity.
In the next sections the necessary modifications to adapt the microaggrega-tion to vector spaces are explained. Secmicroaggrega-tion 4.2.1 introduces the cosine similarity and in Section 4.2.2 is presented the algorithm aggregation function and also its
mathematical proof.
4.2.1 Distance function
We assume that all document vectors have been normalized usingL2-norm, as
described in Equation (2). This means that vectors can be represented on a high dimensional unit sphere. Furthermore, for most of the weighting schemes all the document vectors are non-negative, and hence all document vectors can be represented in the first quadrant of the unit sphere. For those vectors, the dot product is a natural measure of similarity. This measure is known as cosine similarity and it is widely used in text mining and information retrieval due to its easy interpretation and simple computation for sparse vectors. The similarity between two given document vectors,d~1 andd~2, is given by:
scos(d1, d2) = cos(θ(d~1, ~d2)) =
hd~1, ~d2i
|d~1||d~2|
(3)
wherehd~1, ~d2iand θ(d~1, ~d2) are the inner product and the angle between these
two vectors, respectively.
The resulting similarity ranges from−1 meaning exactly opposite vectors, to 1 meaning exactly the same. However, as we have assumed non-negative vectors the similarity ranges from 0 to 1. The maximum similarity, 1, is achieved when there is a complete match between both vectors, and the minimum, 0, when both vectors are orthogonal, that is the angle between both vectors is 90◦.
It is easy to transform Equation 3 into a distance dcos (Equation 4). Note that vector norms are removed from the equation because we have assumed magnitude 1 for all the document vectors.
dcos(d~1, ~d2) = 1− hd~1, ~d2i (4)
4.2.2 Aggregation function
The aggregation step is defined by a function that given a partition of document vectors,πj, returns the corresponding representative vector,cj, which in average is closest, in terms of cosine similarity, to all document vectors belonging to that partition.
Given a set of non negative document vectors, d~1, . . . , ~dN, which have unit norm and a set of p disjoint clusters on the vectors, π1, . . . , πp, Dhillon and
Modha [11] proposed to compute the centroid of each πj first computing the vectorm~j as follows, ~ mj = 1 Nj X di∈πj ~ di, (5)
where Nj is the number of document vectors in the clusterπj. And, then, as the resulting vector does not have a unit norm they define the centroid ofπj
normalizing the vector by itsL2 norm. That is: ~ cj= ~ mj km~jk (6)
Proposition 1. Let S be the set of vectors in the unit sphere and let πj be a
cluster containing a set of documents vectors d~1, . . . , d~N ∈ S. The average
vector ofS defined by C(d~1, . . . , ~dN) =argminc~j∈S{ X ~ di∈πj dcos(c~j, ~di)} (7)
can be computed using the following expression
C(d~1, . . . , ~dN) = P ~ di∈πj ~ dir q PR r=1( P ~ di∈πj ~ dir)2) . (8)
whereR is the number of dimensions of the vectors.
Proof. Starting from the assumption that all the elements have a unit norm,
including the centroid, we can express the cosine distance as the half of the squared euclidean distance.
kd~i−d~jk2= (d~i−d~j)T(d~i−d~j) =kd~ik2+kd~jk2−2d~i T ~ dj = 2(1−cos(θ(d~i, ~dj))) so, dcos(di, dj) = 1 2k ~ di−d~jk2 (9) We can express the minimization problem, stated in Equation 7 and its corresponding constraint,kc~jk= 1, by means of Lagrange multipliers,
L=1 2 X ~ di∈πj ||c~j−d~i||2−λ(c~jTc~j−1).
We can rewrite this expression in terms of the components:
L= 1 2 X ~ di∈πj R X r=1 (c~j r−d~ir)2−λ( R X r=1 ~ cj2r−1)
In order to obtain an expression for c~j, we obtain an expression for each dimension of it ,c~j r, using ∂ ~∂Lc j r = 0. That is, ∂L ∂ ~cj r = X ~ di∈πj 1 22(c~j r− ~ dir)(1)−λ2c~j r= 0, ∀r= 1. . . R
From this expression, we get
− X
~ di∈πj
~
dir+c~j r|πj| −2λ ~cj r= 0, ∀r= 1. . . R,
Therefore, each dimension ofc~j is expressed as follows,
~ cj r= P ~ di∈πj ~ dir |πj| −2λ , ∀r= 1. . . R. (10) Now, we consider ∂L ∂λ = 0. That is, ∂L ∂λ =− R X r=1 ~ cj 2 r−1 ! = 0.
Hence, using the expression in Equation 10, we get R X r=1 P ~ di∈πj ~ dir |πj| −2λ !2 = 1. So, R X r=1 (X ~ di∈πj ~ dir)2= (|πj| −2λ)2.
So, in order to obtainλ, we have to solve the following second degree equa-tion: 4λ2−4λ|πj|+|πj|2− R X r=1 X ~ di∈πj ~ dir 2 = 0
This results into the following expression forλ:
λ= |πj| ± q PR r=1( P ~ di∈πj ~ dir)2 2 .
If we replace now this expression forλin Expression 10 we get for all r = 1. . . R,
~ cj r = P ~ di∈πj ~ dir |πj| −2 |πj|± r PR r=1( P ~ di∈πjd~i r)2 2 = P ~ di∈πj ~ dir q PR r=1( P ~ di∈πj ~ dir)2) .
As the last equation is the aggregation operator that returns the vector which is closest in terms of the cosine distance (in average) to all document vectors belonging to the clusterπj, we have proved the proposition. Note that Expression 8 corresponds to the process described by Dhillon and Modha.
5
Experimental results
In this section, we evaluate the anonymous data generated by the presented microaggregation variation. This assessment relies on a set of evaluation exper-iments to estimate how much information has been lost by the anonymized data with respect to the original and so to determine the utility of this anonymized data. These evaluations are performed by means of a comparison between the results obtained by the original data and its respective anonymizations when different information retrieval techniques are applied.
We have divided this section in three different subsections. The first two, 5.1 and 5.2, describe the data sets used in the experiments before and after its anonymization and in Section 5.3 we quantify how much information has been lost after the anonymization process by analyzing the results obtained by a set of machine learning techniques.
5.1
Original data
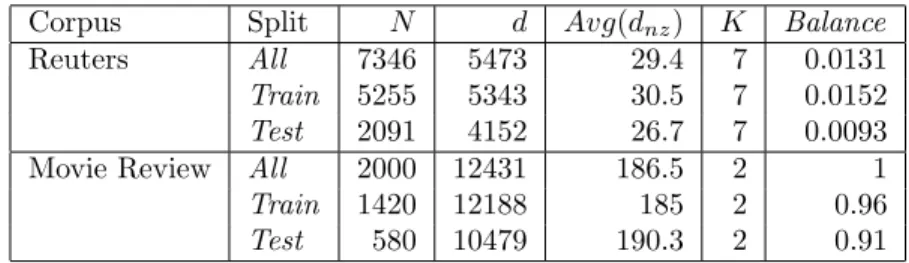
We have selected two well known datasets, the Reuters-21578 and the Movie Reviews Corpus. The former, Reuters, is currently the most widely used test collection for text categorization research. It consists of 10K documents classi-fied in 52 different categories. To make it simple, we have avoided documents which are related with more than one category, and also, we have reduced the number of document features by means of removing the terms occurring in just one document. This reduction is based on the assumption that rare words do not affect category prediction. Hence, after these simplifications the corpus has 7346 documents classified in 7 different categories.
The latter, Movie Reviews, is a collection of documents used for sentiment analysis, so all documents are labeled with respect to their sentiment polarity (positive or negative). It consists on 2000 movie reviews, classified on 1000 positive reviews and 1000 negative reviews. As in the Reuters corpus, we have
applied a feature selection process relying on the deletion of the words appearing just in one document.
In Section 5.3.3 we used two different supervised classification methods to estimated the quality of the protected models with respect to the original ones. Therefore, data should be split in two sets, training and test data. Hence, both data sets are divided with a proportion 70-30. The 70% is the training data and the remaining 30% is the test data. In the case of the Reuters corpus this partition is given by the data owners, otherwise, the Movie Reviews corpus has been randomly partitioned. To simplify the data sets name, we will refer to Reuters and Movie Reviews asRandMR, respectively. Besides, when we refer to one of its partitions, we will add its corresponding subscript,tr and ts for the training and test case respectively (e.g,. Rtr, Reuters training set).
Corpus Split N d Avg(dnz) K Balance
Reuters All 7346 5473 29.4 7 0.0131
Train 5255 5343 30.5 7 0.0152
Test 2091 4152 26.7 7 0.0093
Movie Review All 2000 12431 186.5 2 1
Train 1420 12188 185 2 0.96
Test 580 10479 190.3 2 0.91
Table 1: Summary of all vector spaces used. (For each dataset,N is the number
of documents,dis the number of words after removing stop-words,Avg(dnz)is
an average of the number of words per document, K is the total number of
classes and Balance is the ratio of the number of documents belonging to the
smallest class to the number of documents belonging to the largest class .)
A summary of all vector space models used in this paper is shown in Table 1. In this table, besides the number of documents and words of the datasets used, we show an indicator of the term-document matrix sparsity level by means of an average of the non-zero weight terms (Avg(dnz)) and also the ratio of the number of documents in the smallest class to the number of documents in the largest class (Balance). So a value close to 1 indicates a very balanced data set and a value close to 0 indicates completely the opposite.
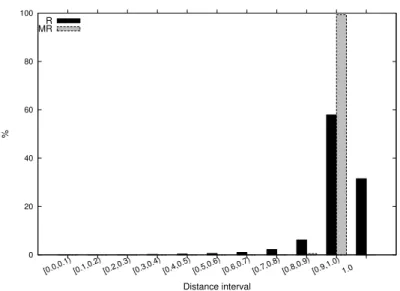
In the histogram of Figure 2 we show two distance distributions by intervals of 0.1. Black bars corresponds to the Reuters data set (R) and the grey ones represent the distance distribution of the Movie Reviews data set (MR). At first glance, it is clearly appreciable that almost all distances computed are located in the intervals with higher distance values. Specifically, the 99.3% and 89.4% of the distances are located in the two last intervals for the Movie Reviews and Reuters data set, respectively. This means that most document vectors of both data sets are far from each other in terms of cosine distance. Moreover, if we focus on the last interval, with distance equal to one, we will realize that while Movie Reviews has a percentage of almost zero, Reuters has much more distances located in that interval and so, it has more document vectors with non-overlapped terms. In detail, Reuters has the 57.9% of the distances in the
0 20 40 60 80 100 [0.0,0.1) [0.1,0.2) [0.2,0.3) [0.3,0.4) [0.4,0.5) [0.5,0.6) [0.6,0.7) [0.7,0.8) [0.8,0.9) [0.9,1.0) 1.0 % Distance interval R MR
Figure 2: Distance distribution by intervals.
[0.9,1) interval and the 31.5% in the interval with distances equal to one. In generalMR vectors are much more scattered than theRvectors and as we will see in the following sections, this fact has an important impact in the quality of the protected data.
5.2
Anonymized data
In order to anonymize the data we have implemented the microaggregation heuristic method MDAV, Algorithm 1, with the corresponding distance and aggregation functions proposed in Sections 4.2.1 and 4.2.2. We have used the implemented method to anonymize both datasets and their partitions indepen-dently, the training and test sets. The fact of protecting independently the training and test sets is because in Section 5.3.3 we have considered a set of three different scenarios relaying on supervised learning techniques to evaluate the quality of the protected data.
In addition, we have considered different values for thek microaggregation parameter, which ranges from 2 to 20, and so for each original dataset we have 19 protected variations. Thereby, we will study the variation effects of this parameter in order to decide which should be the best anonymization value.
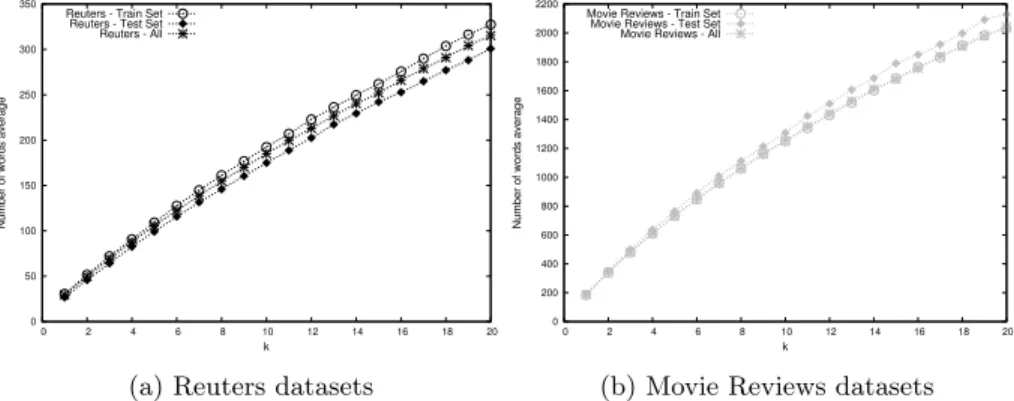
All the protected datasets have the same number of documents. However, as thekparameter is increased the anonymity clusters are growing and therefore the protected vectors are increasing the number of words due to the aggrega-tion operaaggrega-tion. The sparsity of the vector space or term-document matrix is decreased, or inversely, as it is shown in Figure 3, the average of the number of words reaches a maximum value when the protection degree is equal to 20. It increases about a 5% in the Reuters case and about 16% in the Movie Reviews
0 50 100 150 200 250 300 350 0 2 4 6 8 10 12 14 16 18 20
Number of words average
k Reuters - Train Set
Reuters - Test Set Reuters - All
(a) Reuters datasets
0 200 400 600 800 1000 1200 1400 1600 1800 2000 2200 0 2 4 6 8 10 12 14 16 18 20
Number of words average
k Movie Reviews - Train Set
Movie Reviews - Test Set Movie Reviews - All
(b) Movie Reviews datasets Figure 3: Average of the number of words with a non-zero weight.
0 0.02 0.04 0.06 0.08 0.1 0.12 0.14 0 2 4 6 8 10 12 14 16 18 20
Words weight average
k
Reuters - Train Set Reuters - Test Set Reuters - All Movie Reviews - Train Set Movie Reviews - Test Set Movie Reviews - All
case. Furthermore, increasing the number of words per document also implies a decrease in all vector weight values. This behavior is shown in Figure 4. Note that in all plots the data point withk= 1 is referring to the original data.
0 20 40 60 80 100 [0.0,0.1) [0.1,0.2) [0.2,0.3) [0.3,0.4) [0.4,0.5) [0.5,0.6) [0.6,0.7) [0.7,0.8) [0.8,0.9) [0.9,1.0) 1.0 % Distance interval R-k2 MR-k2 (a) k = 2 0 20 40 60 80 100 [0.0,0.1) [0.1,0.2) [0.2,0.3) [0.3,0.4) [0.4,0.5) [0.5,0.6) [0.6,0.7) [0.7,0.8) [0.8,0.9) [0.9,1.0) 1.0 % Distance interval R-k3 MR-k3 (b) k = 3 0 20 40 60 80 100 [0.0,0.1) [0.1,0.2) [0.2,0.3) [0.3,0.4) [0.4,0.5) [0.5,0.6) [0.6,0.7) [0.7,0.8) [0.8,0.9) [0.9,1.0) 1.0 % Distance interval R-k10 MR-k10 (c) k = 10 0 20 40 60 80 100 [0.0,0.1) [0.1,0.2) [0.2,0.3) [0.3,0.4) [0.4,0.5) [0.5,0.6) [0.6,0.7) [0.7,0.8) [0.8,0.9) [0.9,1.0) 1.0 % Distance interval R-k20 MR-k20 (d) k = 20 Figure 5: Distance distribution by intervals.
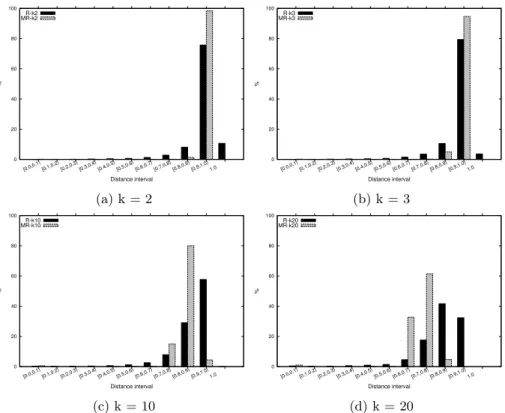
Figure 5 consists of a set of histograms for three different protection degrees,
k ={2,3,10,20}, showing the distance distributions by intervals. If we com-pare the original distribution, Figure 2, with the smallest protection degrees, Figures 5a and 5b, we realize that both data sets show different behaviors. In the Reuters case it is clearly appreciable the reduction of higher distances. In particular, the interval with the highest distance has decreased from the 31.5%, originally, to the 3.6% with k = 3, and most of those distances are spread in lower intervals, such as in the [0.9,1) interval. However, in the Movie Reviews case, this effect is not happening despite the nature of the protection algorithm. This fact give us an idea of how far are data vectors between them, since the data representatives are as far as the real data vectors. In Figures 5c and 5d, in which protection degrees are much higher than before, the nature of the algorithm is more clear. As before, Reuters dataset shows a clear distance re-distribution where higher distance values are decreasing in favor to the next interval with lower distance values. Nevertheless, as in Movie Reviews almost all distances were originally very high, the protected representatives are not as
accurate as in the Reuters corpus and this produces extreme changes on the distance distributions.
5.3
Evaluation
As the presented anonymization algorithm is considered a general purposed pro-tection technique (i.e., it is not known the intended use of the protected data), we have selected a set of different but basic information retrieval techniques, so different aspects of the anonymized data can be evaluated. This evaluation is conducted by comparing the results obtained by the original data with the results obtained by the protected data. Firstly, we use a basic clustering eval-uation, relying on intra and inter cluster similarity; secondly, we provide an evaluation by comparison of search query result sets; and finally, we consider an evaluation by comparing result sets when different classification and clustering techniques are performed.
5.3.1 Intra/Inter-cluster sum of errors
The first evaluation procedure is based on an internal measure, that is, a mea-sure related to the objective function used in the protection method, the aver-age cosine distance between clusters. Hence, we evaluate our microaggregation method in terms of the intra-cluster sum of errors to evaluate the homogeneity of the with-in clusters (SSE) and the between-groups cluster (SSA).
SSE = g X i=1 ni X j=1 (dcos(d~ij, ¯ ~ di)) (11)
wheregis the number of groups andni the number of vectors in theith group, so ni ≥k and n =P
g
i=1ni. In the same wayd~ij is the jth record in the ith group and ~¯didenotes the average data vector over the ith group. The lower SSE, the higher the within-group homogeneity.
SSA= g
X
i=1
ni(dcos(~¯d ,i d~¯)) (12)
whered~¯is the average vector over the whole set ofnvectors. The higher SSA, the lower the between-groups homogeneity.
The last measure is the normalized information loss, defined as the relation between the sum of squares of with-in group and the total sum of squares. That is,
IL= SSE
SSE+SSA (13)
The optimalk-partition is defined by the one that minimizes theSSE mea-sure (i.e., maximizes the within-group homogeneity) and maximizes the SSA
0 0.2 0.4 0.6 0.8 1 0 2 4 6 8 10 12 14 16 18 20 Information loss k Reuters - Train Set
Reuters - Test Set Reuters - All Movie Reviews - Train Set Movie Reviews - Test Set Movie Reviews - All
(a) Spherical Microaggregation
0 0.1 0.2 0.3 0.4 0.5 0.6 0.7 0.8 0.9 1 0 2 4 6 8 10 12 14 16 18 20 Information loss k
Reuters - Train Set Reuters - Test Set Reuters - All Movie Reviews - Train Set Movie Reviews - Test Set Movie Reviews - All
(b) Classical Microaggregation Figure 6: Information Loss.
Figure 6 shows the relation between the normalized information loss and the protection degreekfor the proposed microaggregation, Spherical microag-gregation (Figure 6a) and the original microagmicroag-gregation method (Figure 6b). Each method was evaluated with its specific information loss measure, Equa-tions (13) for the Spherical microaggregation and the equivalent equaEqua-tions based on the Euclidean distance for the classical microaggregation (see [13] for further details). As expected in both methods, data utility is decreasing as the protec-tion degree is increasing. Moreover, in general, we can see that vector spaces with more vectors (bigger datasets) have lost less information. Both the orig-inal and the Spherical microaggregation have been used to protect the same normalized datasets. As the data was normalized the Euclidean and the co-sine distances are equivalent (see Equation (9)) and hence, both methods built the same data partitions. However, unlike the original microaggregation, which generates the cluster representatives using the mean vector, the Spherical mi-croaggregation generates normalized cluster representatives and so, a normal-ized protected dataset. This difference is relevant when we are dealing with sparse data and so, we are not interested in preserving the magnitude of the vectors. If we compare the information loss produced by both methods, we see a significant improvement achieved by the Spherical microaggregation. As we can appreciate in Figures 6a and 6b the information loss produced by the Spherical microaggregation is always much lower than the one produced by the original microaggregation. If we focus on the minimum and maximum informa-tion loss values we see a significant difference. On the one hand, the Spherical microaggregation obtained a minimum ratio of information loss of 0.17, while the original microaggregation obtained a ratio of 0.31. On the other hand, the Spherical microaggregation produced a maximum ratio of information loss of 0.65, while the maximum ratio of information loss produced by the original microaggregation is about 0.95.
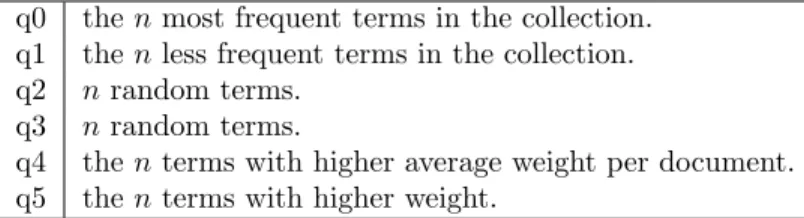
q0 thenmost frequent terms in the collection. q1 thenless frequent terms in the collection. q2 nrandom terms.
q3 nrandom terms.
q4 thenterms with higher average weight per document. q5 thenterms with higher weight.
Table 2: Test queries.
5.3.2 Querying vector spaces
A common use of the VSM is to use it as an index to be queried. In order to measure the loss of information introduced by our method we can compare the results of querying the original vector space with the results obtained in the protected versions.
To that end we have built a simple and generic index from each vector space model, making use of an inverted index from the vector space and a cosine score. An inverted index consists of a list of all the unique words that appear in any document, and for each word, a list of the documents in which it appears. The query is represented as a vector~q from the vector space, and the search engine returns a ranked list of documents, where the rank is determined by the cosine distance between the query vector and the document vectors. See [21] for more details. Notice that searching the same query in a set of inverted index built from different vector spaces will return a result in almost the same time.
We have used 6 different queries described in Table 2. These are divided in three different types. The first type,q0 andq1, are queries related with the number of times a term appears in the corpus. The second type, q2 and q3, are queries with terms extracted randomly from the corpus. And finally, the third type of queries are related to the weight given to each word in the feature selection step, in this case the weight is thetf−idf of each term.
The queries are fed to the search engine which returns a list of ther doc-uments with the highest rank. And we compare the resulting listR from the original vector space with the protected oneR0by means of the harmonic mean between precision and recall. This measure is called F1-score and it is
repre-sented by Equation 14.
F1= 2∗
P recision∗Recall
P recision+Recall (14)
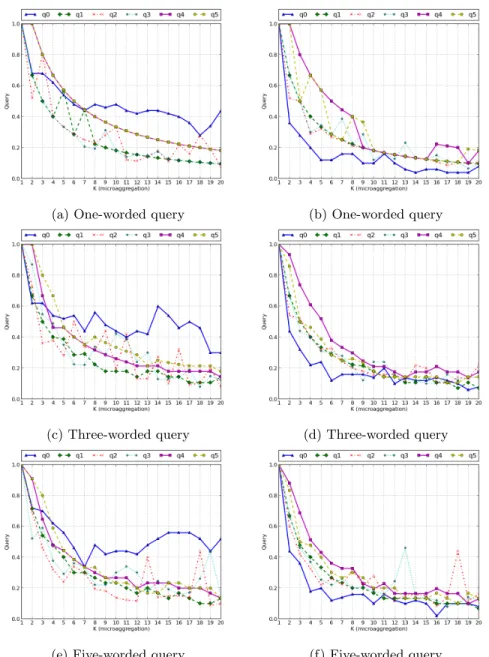
Figure 7 shows how theF1-score ratio has a decreasing tendency while the
protection degree, k, gets higher. The left hand side of this figure corresponds to the results when the Reuters corpus is queried with queries of sizes 1, 3 and 5 and the right hand side corresponds to the results when the Movie Reviews corpus is queried.
(a) One-worded query (b) One-worded query
(c) Three-worded query (d) Three-worded query
(e) Five-worded query (f) Five-worded query
Figure 7:F1-Score ration of equal documents returned querying the original and
the protected data sets for different query lengths. The left column corresponds to the results of the Reuters and the right column tho the Movie Reviews corpus.
5.3.3 Classification
This last part is focused on the comparison of results given by different classifica-tion and clustering algorithms, two widely extended techniques used within the information retrieval and text mining field. As in the previous section, the data utility evaluation is done by a comparison between the results obtained with the original data and its protected version when a classification or a clustering algorithm is performed. Two different metrics were used. For the classification algorithms we have used the Jaccard index [29], which is defined as the size of the intersection divided by the size of the union of two label sets. While for the clustering algorithms we have used the Adjusted Rand Index [18]. The Rand Index considers whether pairs of elements are in the same or different clusters in two clustering partition (in our case, the cluster partitions obtained by the original data and the protected data).
To evaluate the utility of the protected data, and taking into account that both data sets are labeled, we have considered two well known classifier algo-rithms: the K-Nearest Neighbors [15] and the Naive Bayes [21]. Besides, we have also considered the well known K-Means clustering algorithm, more precisely its spherical version [11].
In order to perform the evaluation by theclassificationalgorithms two data partitions are necessary, training and test. As it was explained in Section 5.1, two partitions were extracted from the two initial corpus. So that for each cor-pus there are 3 vector spaces, the whole vector space and its two corresponding partitions, the training and the test sets. Then, all these data sets were inde-pendently anonymized. Note, that in a reverse process, where the partitions are done after data protection, some errors could be introduced due to a separation of ak-anonymous cluster. These data partitions also allow us to define a set of scenarios to estimate how much information has been lost in the anonymization process.
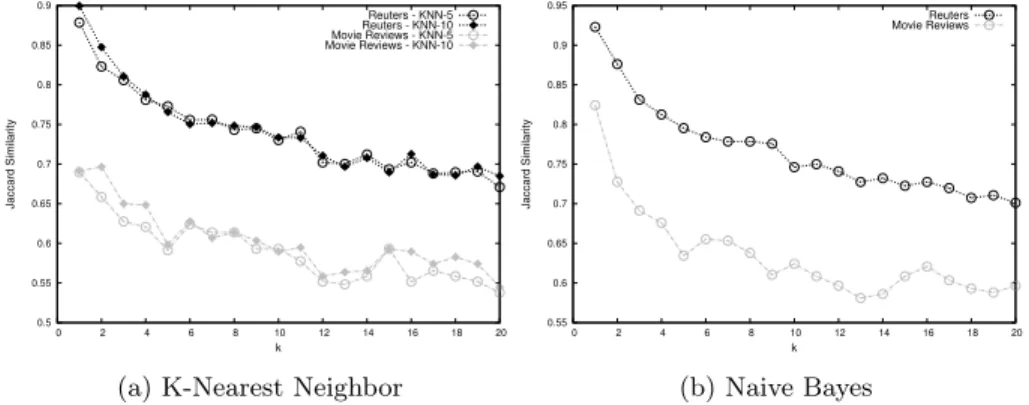
Scenario 1. The algorithm is trained with an original training data partition and then the model is tested with a protected test data partition. An example of this scenario would be when the data owners build their model from their original data. Then they can use this model to classify data provided by a third party and thus anonymized. Results in Figure 8.
Scenario 2. The training and test partitions are extracted from the same pro-tected data set. We assumed that the released propro-tected data is totally or partially labeled. Results in Figure 9.
Scenario 3. The algorithm is trained with a protected training data partition and then the model is tested with an original test data partition. This is probably the most strange scenario, however, we have considered it because it provides a good evaluation of the protected data. That is, we can evaluate how good is the model obtained from the protected data when is compared with the one obtained from the original data. Results in Figure 10.
0.5 0.55 0.6 0.65 0.7 0.75 0.8 0.85 0.9 0 2 4 6 8 10 12 14 16 18 20 Jaccard Similarity k Reuters - KNN-5 Reuters - KNN-10 Movie Reviews - KNN-5 Movie Reviews - KNN-10
(a) K-Nearest Neighbor
0.55 0.6 0.65 0.7 0.75 0.8 0.85 0.9 0.95 0 2 4 6 8 10 12 14 16 18 20 Jaccard Similarity k Reuters Movie Reviews (b) Naive Bayes Figure 8: First scenario - KNN - BAYES
0.5 0.55 0.6 0.65 0.7 0.75 0.8 0.85 0.9 0 2 4 6 8 10 12 14 16 18 20 Jaccard Similarity k Reuters - KNN-5 Reuters - KNN-10 Movie Reviews - KNN-5 Movie Reviews - KNN-10
(a) K-Nearest Neighbor
0.5 0.55 0.6 0.65 0.7 0.75 0.8 0.85 0.9 0.95 0 2 4 6 8 10 12 14 16 18 20 Jaccard Similarity k Reuters Movie Reviews (b) Naive Bayes Figure 9: Second scenario - KNN - BAYES
0.5 0.55 0.6 0.65 0.7 0.75 0.8 0.85 0.9 0.95 0 2 4 6 8 10 12 14 16 18 20 Jaccard Similarity k Reuters - KNN-5 Reuters - KNN-10 Reuters - KNN-5 Reuters - KNN-10
(a) K-Nearest Neighbor
0.6 0.65 0.7 0.75 0.8 0.85 0.9 0.95 0 2 4 6 8 10 12 14 16 18 20 Jaccard Similarity k Reuters Movie Reviews (b) Naive Bayes Figure 10: Third scenario - KNN - BAYES
Figures 8, 9 and 10 show the results of the defined scenarios. In the left hand side of all these figures are shown theKNN results using 5 and 10 as the number of selected neighbors to decide the class of the tested document vector. In the right hand side are the plots corresponding to the Bayes classification results.
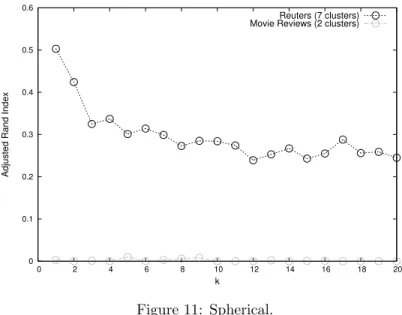
In the case of theclusteringalgorithm, the spherical k-means, we have just evaluateScenario 2, where the data owner releases the whole vector space after being protected. Thus, the evaluation is expressed in terms of how different are the anonymized clusters with respect to the original ones. The spherical k-means experimental setup has been performed as follows.
We have executed the spherical k-means clustering for both original vector spaces, Reuters and Movie Reviews, and also for all their 19 anonymized vari-ations. For the k-means we have considered the number of clusters parameter as 5, 10, 15, 20 and 25 for all the executions. Besides, in order to avoid that the algorithm converges to a local minimum we have repeated each execution 10 times and we have got the best cluster partition. In addition, since both corpus are labeled, we have also considered using the number of different labels as the number of clusters considered by the algorithm, which are 7 and 2 for the Reuters and Movie Reviews, respectively. However, as it is shown in Figure 11 in both instances the cluster partition and the labels partition do not match, especially in the Movie Reviews example.
0 0.1 0.2 0.3 0.4 0.5 0.6 0 2 4 6 8 10 12 14 16 18 20
Adjusted Rand Index
k
Reuters (7 clusters) Movie Reviews (2 clusters)
Figure 11: Spherical.
Figure 12 shows how similar are the cluster partitions, in terms of the ad-justed rand index, between the original vector spaces and their respective 19th protection variations. Although the Reuters results are not so bad the Movie Reviews results are in some way surprising. However, this big difference between the original clustering and the protected one is due to the distance between all
Movie Reviews data vectors. As we have shown, in Figure 2 almost all dis-tances between all data pairs were in the [0.9,1) interval. This means that all documents are dissimilar in terms of cosine distance, and therefore the centroids built from each group are too general. Hence, the data distribution can limitate the prefromance of a distance-based anonymization method. Note that this is an extreme case, since we are considering 12000 features per vector. It is known that extremely high dimensional data has problems with k-anonymity based methods [5], which usually rely on distance functions.
0 0.1 0.2 0.3 0.4 0.5 0.6 0.7 2 4 6 8 10 12 14 16 18 20
Adjusted Rand Index
k Reuters - SKM-5 Reuters - SKM-7 Reuters - SKM-10 Reuters - SKM-15 Reuters - SKM-20 Reuters - SKM-25 Movie R - SKM-2 Movie R - SKM-5 Movie R - SKM-10 Movie R - SKM-15 Movie R - SKM-20 Movie R - SKM-25 Figure 12: Spherical.
6
Conclusions
A Vector Space Model is an algebraic representation commonly used in infor-mation retrieval to represent textual data as a term-document matrix. These models are very high-dimensional and sparse, and present different challenges such as the similarity computation. Many researches agree that the cosine simi-larity works better in these cases. This simisimi-larity allows to provide more efficient an accurate clustering for sparse vector spaces.
In this paper we have presented an approach for the anonymization of sparse and high-dimensional vector spaces relying on the microaggregation method. This is an anonymization technique which provides privacy by means of cluster-ing data into small clusters and then replaccluster-ing them by their representatives. We have introduced a new partition and aggregation operations relaying on the cosine distance instead of the Euclidean distance, which is usually employed in the classical microaggregation. Although the partition step is relatively straight-forward, for the aggregation we have provided a proof, which demonstrates that
the computed representative is the one that minimizes the sum of distances between all the members of the cluster and the representative. In addition, we have implemented a variation of the heuristic microaggregation algorithm, MDAV, with the proposed modifications.
Our results show how in most of the presented evaluation tests the data is highly useful, specially in the classification tests and the sum of error. The results obtained by the traditional evaluation, sum of error, were satisfactory despite the sparsity of the data, we have obtained less than a 50% of information loss for protection degrees lowers than 10 for the Movie Reviews data sets, and 20 for the Reuters data sets. In addition, in the classification tests the prediction results of protected data are quite similar to the ones obtained by the original data. Specifically, the maximum error obtained by the highest protection degree (k = 20) in the Reuters data is about a 20% and about a 15% in the Movie Reviews. Otherwise, the results obtained by the clustering algorithm are much more discouraging. The partitions obtained with the protected data are very dissimilar to the original, specially, in the Movie Reviews data sets due to its distance distribution.
Acknowledgments
Support by the Spanish MEC projects (ARES-CONSOLIDER INGENIO 2010 CSD200700004, COPRIVACY TIN201127076C0303 and NKHRONOUS -TIN2010-15764) and by the EC (FP7/2007-2013) Data without Boundaries (grant agreement number 262608) are acknowledged. The work contributed by the first author was carried out as part of the Computer Science Ph.D. program of the Universitat Aut´onoma de Barcelona (UAB).
References
[1] Abdalaal, A., Nergiz, M. E., Saygin, Y. (2013). Privacy-preserving publish-ing of opinion polls. Computers & Security, 37(0), pp. 143-154.
[2] Abril, D., Navarro-Arribas G., Torra V., (2010) Towards semantic microag-gregation of categorical data for confidential documents, in: Proceedings of the 7th International Conference on Modeling Decisions for Artificial Intelligence, Springer, pp. 266-276
[3] Abril, D., Navarro-Arribas, G., Torra, V. (2013) Towards a private vector space model for confidential documents. Proceedings of the 28th Annual ACM Symposium on Applied Computing (SAC 2013). ACM, pp. 994-945. [4] Abril, D., Navarro-Arribas, G., Torra, V., (2012) Improving record linkage with supervised learning for disclosure risk assessment. Information Fusion, 13(4), pp. 274-284.
[5] Aggarwal, C.C. (2005). On k-anonymity and the curse of dimensionality. In Proceedings of the 31st international conference on Very large data bases (VLDB ’05). VLDB Endowment 901-909.
[6] Agrawal, R., Srikant, R. (2000) Privacy-preserving data mining. ACM Sig-mod Record, vol. 29, issue 2, pp. 439-450.
[7] Anandan, B., Clifton, C., Jiang, W., Murugesan, M., Pastrana-Camacho, P., and Si, L. (2012). t-Plausibility: Generalizing Words to Desensitize Text. Trans. Data Privacy 5, 3. pp. 505-534.
[8] Barbaro, M., Zeller, T., Hansell, S. (2006) A face is exposed for AOL searcher no. 4417749. New York Times. August 9, 2006.
[9] Chakaravarthy, V. T., Gupta, H., Roy, P., and Mohania, M. K. (2008). Efficient techniques for document sanitization. In Proceedings of the 17th ACM conference on Information and knowledge management. pp. 843-852. [10] Defays, D., Nanopoulos, P.(1993) Panels of enterprises and confidentiality: the small aggregates method. In Proceedings of the 1992 Symposium on Design and Analysis of Longitudinal Surveys, pp. 195–204.
[11] Dhillon, I. S., Modha, D. S. (2001), Concept Decompositions for Large Sparse Text Data Using Clustering. Machine Learning, 42, pp. 143-175. [12] Domingo-ferrer, J., Torra, V. (2001). Disclosure Control Methods and
In-formation Loss for Microdata. In P. Doyle (Ed.), Confidentiality, Disclo-sure, and Data Access: Theory and Practical Applications for Statistical Agencies, pp. 93–112. Elsevier Science.
[13] Domingo-Ferrer, J., Mateo-Sanz, J.M. (2002) Practical data-oriented mi-croaggregation for statistical disclosure control. IEEE Trans. on Knowl. and Data Eng., 14, pp. 189–201.
[14] Domingo-Ferrer, J., Torra, V. (2005) Ordinal, continuous and heteroge-neous k-anonymity through microaggregation. Data Min. Knowl. Discov., 11, pp. 195–212.
[15] Duda, R.O., Hart, P.E., Stork, D.G. (2012) Pattern classification. John Wiley and Sons.
[16] Erola, A., Castella-Roca, J., Navarro-Arribas, G., Torra, V. (2011) Se-mantic microaggregation for the anonymization of query logs. Privacy in Statistical Databases. Springer Berlin Heidelberg.
[17] Ghinita, G., Yufei Tao, Kalnis, P. (2008) On the Anonymization of Sparse High-Dimensional Data. Data Engineering. ICDE 2008. IEEE 24th Inter-national Conference on, pp. 715–724.
[18] Hubert, L., Arabie, P. (1985). Comparing partitions. Journal of Classifica-tion, 2(1), pp. 193–218.
[19] Lasko, T.A., Vinterbo, S.A. (2010) Spectral Anonymization of Data. IEEE Transactions on Knowledge and Data Engineering, vol. 22, no. 3, pp. 437– 446.
[20] Liu, J., Wang, K. (2013) Anonymizing bag-valued sparse data by semantic similarity-based clustering. Knowledge and information systems pp. 1–27. [21] Manning, C.D., Raghavan, P., Sch¨utze, H. (2009) An Introduction to
In-formation Retrieval. Cambridge University Press.
[22] Machanavajjhala, A., Kifer, D., Gehrke, J., an Venkitasubramaniam, M., (2007) L-diversity: Privacy beyond k-anonymity. ACM Trans. Knowl. Dis-cov. Data 1, 1, Article 3.
[23] Martnez, S., Snchez, D., Valls, A. (2012) Semantic adaptive microaggrega-tion of categorical microdata. Computers & Security, 31(5), pp 653-672. [24] Martinez, S., Valls, A., Sanchez, D. (2012) Semantically-grounded
construc-tion of centroids for datasets with textual attributes. Know.-Based Syst. 35, pp. 160-172.
[25] Miller, G., (2010) WordNet - About Us, WordNet, Princeton University.
http://wordnet.princeton.edu.
[26] Navarro-Arribas, G., Torra, V., Erola, A., Castella-Roca, J. (2012) User k-anonymity for privacy preserving data mining of query logs. Information Processing and Management 48.3, pp. 476-487.
[27] Narayanan, A., Shmatikov, V., (2008) Robust de Anonymization of Large Sparse Datasets, Proc. IEEE Symp. Security and Privacy, 2008 (SP ’08), pp. 111-125.
[28] Oganian, A., Domingo-Ferrer, J. (2001) On the complexity of optimal mi-croaggregation for statistical disclosure control. Statistical Journal of the United Nations Economic Commission for Europe, 18, pp. 345–354. [29] Tan, P., Steinbach, M., and Kumar, V. (2005). Introduction to data mining.
Addison-Wesley.
[30] Porter, M.F (1980) An algorithm for suffix stripping. Program vol. 14, no. 3, pp. 130–137.
[31] Rutkin, A.H. (2013) How Your Facebook Profile Reveals More About Your Personality Than You Know. MIT Tehcnology Review. October 1, 2013. [32] Saygin, Y., Hakkani-Tr, D., Tr, G. (2009) Sanitization and Anonymization
of Document Repositories.
[33] Salton, G., Buckley, C., (1988) Term-weighting approaches in automatic text retrieval, Information Processing and Management, vol. 24, issue 5, pp. 513-523.
[34] Salton, G. (1989) Automatic Text Processing: The Transformation, Anal-ysis, and Retrieval of Information by Computer. Addison-Wesley Longman Publishing.
[35] Samarati, P. (2001) Protecting respondents identities in microdata release. IEEE Transactions on Knowledge and Data Engineering, vol. 13, no. 6, pp. 1010–1027.
[36] Simonite, T., (2013) Ads Could Soon Know If Youre an Introvert (on Twit-ter), MIT Technology Review, November 8, 2013.
[37] Agichtein, E., Gravano, L., Pavel, J., Sokolova, V., Voskoboynik, A. (2001) Snowball: A prototype system for extracting relations from large text col-lections. In ACM SIGMOD Record, Vol. 30, No. 2, p. 612.
[38] Strehl, A., Ghosh, J., and Mooney, R. (2000). Impact of Similarity Mea-sures on Web-page Clustering. In Workshop on Artificial Intelligence for Web Search, pp. 58–64.
[39] L. Sweeney, (2002) k-anonymity: a model for protecting privacy. Int. J. Uncertain. Fuzziness Knowl.-Based Syst., vol. 10, no. 5, pp. 557–570. [40] Torra, V., Domingo-Ferrer, J. (2003) Record linkage methods for
multi-database data mining. In V. Torra (Ed.), Information Fusion in Data Min-ing, Vol. 123, pp. 101–132. Springer Berlin Heidelberg.
[41] V. Torra. (2004) Microaggregation for categorical variables: A median based approach. In Privacy in Statistical Databases, vol. 3050 of Lecture Notes in Computer Science, pp. 518–518.
[42] V. Torra. (2008) Constrained microaggregation: Adding constraints for data editing. Trans. Data Privacy, 1, pp. 86–104.
[43] Willenborg, L., De Waal, T. (2001) Elements of Statistical Disclosure Con-trol. Springer Verlag.