Soria, Daniele and Garibaldi, Jonathan M. and
Biganzoli, Elia M. and Ellis, Ian O. (2008) A comparison
of three different methods for classification of breast
cancer data. In: Machine Learning and Applications
2008 (ICMLA'08) Seventh International Conference on
Seventh International Conference on Machine Learning
and Applications, 11-13 Dec 2008, San Diego,
California, USA.
Access from the University of Nottingham repository:
http://eprints.nottingham.ac.uk/28136/1/Soria2008b.pdf
Copyright and reuse:
The Nottingham ePrints service makes this work by researchers of the University of
Nottingham available open access under the following conditions.
·
Copyright and all moral rights to the version of the paper presented here belong to
the individual author(s) and/or other copyright owners.
·
To the extent reasonable and practicable the material made available in Nottingham
ePrints has been checked for eligibility before being made available.
·
Copies of full items can be used for personal research or study, educational, or
not-for-profit purposes without prior permission or charge provided that the authors, title
and full bibliographic details are credited, a hyperlink and/or URL is given for the
original metadata page and the content is not changed in any way.
·
Quotations or similar reproductions must be sufficiently acknowledged.
Please see our full end user licence at:
http://eprints.nottingham.ac.uk/end_user_agreement.pdf
A note on versions:
The version presented here may differ from the published version or from the version of
record. If you wish to cite this item you are advised to consult the publisher’s version. Please
see the repository url above for details on accessing the published version and note that
access may require a subscription.
A Comparison of Three Different Methods
for Classification of Breast Cancer Data
Daniele Soria
Jonathan M. Garibaldi
University of Nottingham
School of Computer Science
Jubilee Campus, Wollaton Road,
Nottingham, NG8 1BB, UK
{dqs,jmg}@cs.nott.ac.uk
Elia Biganzoli
National Cancer Institute of Milan
Unit of Medical Statistics and Biometry
Via Vanzetti 5, 20133 Milan, Italy
[email protected]
Ian O. Ellis
University of Nottingham
School of Molecular Medical Sciences
Queens Medical Centre, Derby Road,
Nottingham, NG7 2UH, UK
[email protected]
Abstract
The classification of breast cancer patients is of great importance in cancer diagnosis. During the last few years, many algorithms have been proposed for this task. In this paper, we review different supervised machine learn-ing techniques for classification of a novel dataset and per-form a methodological comparison of these. We used the C4.5 tree classifier, a Multilayer Perceptron and a naive Bayes classifier over a large set of tumour markers. We found good performance of the Multilayer Perceptron even when we reduced the number of features to be classified. We found naive Bayes achieved a competitive performance even though the assumption of normality of the data is strongly violated.
1
Introduction
Worldwide, breast cancer is the second most common type of cancer and the fifth most common cause of can-cer death. This disease poses a serious threat for women’s health. Since the early years of cancer research, biologists have used the traditional microscopic technique to assess tumour behavior for breast cancer patients. Precise predic-tion of tumours is critically important for the diagnosis and treatment of cancer. Modern machine learning techniques are progressively being used by biologists to obtain proper
tumour information from the databases. Among the exist-ing techniques, supervised learnexist-ing methods are the most popular in cancer diagnosis [8].
According to John and Langley [6], methods for in-ducing probabilistic descriptions from training data have emerged as a major alternative to more established ap-proaches to machine learning, such as decision-tree induc-tion and neural networks. However, some of the most im-pressive results to date have come from a much simpler – and much older – approach to probabilistic induction known as the naive Bayesian classifier. Despite the simplifying as-sumptions that underlie the naive Bayesian classifier, ex-periments on real-world data have repeatedly shown it to be competitive with much more sophisticated induction al-gorithms. Furthermore, naive Bayes can deal with a large number of variables and large data sets, and it handles both discrete and continuous attribute variables.
In this paper, we present a comparison of three different classifiers that may be used in machine learning, namely the naive Bayes algorithm, the C4.5 decision tree and the Multilayer Perceptron function. The same machine learn-ing techniques were already used in literature: in particular, Bellaachia and Guven in [1], revising a study of Delen et al. [3], used the above methods to find the most suitable one for predicting survivability rate of breast cancer patients. Our study was instead motivated by the necessity to find an automated and robust method to validate our previous clas-sification of breast cancer markers [4]. We had, in fact, ob-tained six classes using agreement between different
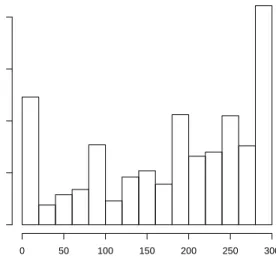
clus-ER Frequency 0 50 100 150 200 250 300 0 50 100 150 200 250 300
Figure 1. Histogram of variable ER
tering algorithms. Starting from these groups, we wanted to reproduce the classification keeping into account the high non-normality of our data (see Figure 1 and 2). For this reason we started using the C4.5 and the Multilayer Percep-tron classifiers and then we compare results with the naive Bayes one. Surprisingly, we found that when we reduce our dataset to ten markers, the naive Bayes classifier performs better than the C4.5, even though the normality assumption is strongly violated by our features’ distribution.
A Bayesian classifier is a fast-supervised classification technique which is suitable for large-scale prediction and classification tasks on complex and incomplete datasets. Naive Bayesian classification performs well if the values of the attributes for the sessions are independent. The naive Bayes classifier applies to learning tasks where each in-stance xis described by a conjunction of attribute values and where the target functionf(x)can take on any value from same finite setV [7].
C4.5 builds decision trees from a set of training data, us-ing the concept of Information Entropy. Each attribute of the data can be used to make a decision that splits the data into smaller subsets. C4.5 examines the normalized infor-mation gain (difference in entropy) that results from choos-ing an attribute for splittchoos-ing the data. The attribute with the highest normalized information gain is the one used to make the decision. The algorithm then recurs on the smaller sub-lists.
A Multilayer Perceptron is a feed-forward network with one or more layers of nodes between the input and out-put layers of nodes. These additional layers contain hidden
CK18 Frequency 0 50 100 150 200 250 300 0 50 100 150 200
Figure 2. Histogram of variable CK18
nodes that are not directly connected to both the input and the output nodes. The capabilities of the Multilayer Percep-trons come from the non-linearity used in these nodes. The number of nodes in the hidden layer must be large enough to form a decision region that is as complex as required by a given problem.
The paper is organized as follows: in Section 2, a de-scription of each technique is reported. Then in Section 3 we introduce the dataset worked on and explain in detail the results obtained from the three classifiers using the WEKA software [11]. Section 4 is reserved for discussion and fu-ture work.
2
Methods
2.1
C4.5 Classifier
C4.5 is an algorithm used to generate a decision tree de-veloped by Ross Quinlan. C4.5 is an extension of Quinlan’s earlier ID3 algorithm. The decision trees generated by C4.5 can be used for classification, and for this reason, C4.5 is often referred to as a statistical classifier.
Tree induction methods are considered to be supervised classification methods, which generate decision trees de-rived from a particular data set. C4.5 uses the concept of information gain to make a tree of classificatory deci-sions with respect to a previously chosen target classifica-tion [9]. The output of the system is available as a symbolic rule base. The cases, described by any mixture of nomi-nal and numeric properties, are scrutinized for patterns that
allow the classes to be reliably discriminated. These pat-terns are then expressed as models, in the form of decision trees or sets of if-then rules, which can be used to classify new cases, with an emphasis on making the models under-standable as well as accurate [9]. For real world databases the decision trees become huge and are always difficult to understand and interpret. In general, it is often possible to prune a decision tree to obtain a simpler and more accurate tree [9].
2.2
Multilayer Perceptron Classifier
A Multilayer Perceptron is a feedforward artificial neural network model that maps sets of input data onto a set of ap-propriate output. It is a modification of the standard linear perceptron in that it uses three or more layers of neurons (nodes) with nonlinear activation functions, and is more powerful than the perceptron in that it can distinguish data that is not linearly separable, or separable by a hyperplane [5].
Multilayer feedforward networks are an important class of neural networks. Typically, the network consists of a set of sensory units that constitute theinput layer, one or more
hidden layersof computation nodes, and anoutput layerof computation nodes. Multilayer Perceptrons have been ap-plied successfully to solve some difficult and diverse prob-lems by training them in a supervised manner with a highly popular algorithm known as theerror back-propagation al-gorithm. Basically, error back propagation learning consists of two passes through the different layers of the network: a forward pass and a backward pass. In theforward pass, an activity pattern (input vector) is applied to the sensory nodes of the network, and its effect propagates through the net-work layer by layer. Finally, a set of outputs is produced as the actual response of the network. During the forward pass the synaptic weights of the network are all fixed. During thebackward pass, on the other hand, the synaptic weights are alladjustedin accordance with an error-correction rule. Specifically, the actual response of the network is subtracted from a desired (target) response to produce an error sig-nal. This error signal is the propagated backward through the network, against the direction of synaptic connections – hence the name “error back-propagation”. The synap-tic weights are adjusted to make the actual response of the network move closer to the desired response in a statistical sense.
A Multilayer Perceptron has three distinctive character-istics:
1. The model of each neuron in the network includes a
nonlinear activation function.
2. The network contains one or more layers of hidden neuronsthat are not part of the input or output of the
network. These hidden neurons enable the network to learn complex tasks by extracting progressively more meaningful features from the input patterns (vectors). 3. The network exhibits a high degree ofconnectivity,
de-termined by the synapses of the network. A change in the connectivity of the network requires a change in the population of synaptic connections or their weights. It is through the combination of these characteristics to-gether with the ability to learn from experience through training that the Multilayer Perceptron derives its comput-ing power [5].
2.3
Naive Bayes Classifier
A naive Bayes classifier is a simple probabilistic clas-sifier based on applying Bayes’ theorem with strong inde-pendence assumptions. The performance goal is to predict the class of test instances as accurately as possible. This kind of classifier is termednaivebecause it is based on two simplifying common assumptions: firstly, it assumes that the predictive attributes are conditionally independent given the class and secondly, the values of numeric attributes are normally distributed within each class.
Naive Bayes treats discrete and continuous attributes somewhat differently. For each discrete attribute, the proba-bility that the attributeX will take on the particularxwhen the class isc is modeled by a single real number between 0 and 1. In contrast, each continuos attribute is modeled by some continuous probability distribution over a range of that attribute’s values.
LetC be the random variable denoting the class of an instance and X be a vector of random variables denoting the observed attribute values. Let c be a particular class label andxrepresent a particular observed attribute value. If we have a test casexto classify, the probability of each class given the vector of observed values for the predictive attributes may be obtained using the Bayes’ theorem:
p(C=c|X =x) = p(C=c)p(X =x|C=c)
p(X =x)
and then predicting the most probable class. Because the event is a conjunction of attribute values assignments, and because of the attributes conditional independence assump-tion, the following equation may be written:
p(X =x|C=c) =Y
i
p(Xi =xi|C=c).
which is quite simple to calculate for training and test data [6].
3
Experiments and Results
3.1
Patients
A series of 1076 patients from the Nottingham Tenovus Primary Breast Carcinoma Series were used in a previous study [4] where we had applied different clustering tech-niques to classify data in robust and clinically significant groups. For clustering analyses, we had used a panel of 25 tumour markers, which are listed in Table 1. Consen-sus between four different clustering techniques was used to determine six core classes. 62% (663 cases) of the popu-lation was classified into one of these six groups, while the remaining 38% presented indeterminate or mixed charac-teristics. In this study we only focused on the subset of the ‘in-class’ cases to run the classifiers on in order to find an automated way to justify and reproduce the classification obtained before [4]. This subset represents a novel clini-cal categorisation of breast cancer which is interesting in its own right and presents a challenging classification task. Further understanding of undetermined cases is left open for future investigation.
Still based on previous research [4], we selected 14 ‘im-portant’ markers candidates that were discriminant in the categorisation process and whose distribution was very dif-ferent among the six classes. These 14 markers were se-lected on the basis of clinical importance as indicated by pathologists involved in previous studies. We then per-formed an exhaustive search of the best combination of 10 markers out of these 14 based on the naive Bayes classifica-tion results. This was done as reducing the number of mark-ers used for classification is a clinical aim, as this would both simplify and reduce the costs of a clinical test based on these markers. We used this ‘new’ smaller dataset to re-peat our experiments applying the above classifiers on this.
3.2
Results
After loading our data in the WEKA software [11], we chose the C4.5 algorithm classifier. As it can handle con-tinuous attributes, there was no need to discretize any of the attributes and in our experiments we accepted the de-fault values for the parameters. The dede-fault version does perform some pruning (using the subtree raising approach), but does not perform error pruning. We chose to run the classifier 10 times using the 10-fold cross validation option and evaluate the accuracy of the obtained classification sim-ply by looking at the percentage of the corrected classify instances. We will use the same ‘initial conditions’ and we will repeat the experiments for the same number of times also when running the other classifiers. We will then com-pute the mean of the returning results. The results we ob-tained were quite good, precisely we got 582 cases correctly
Antibody, clone Short Name
Luminal phenotype CK 7/8 [clone CAM 5.2] CK7/8 CK 18 [clone DC10] CK18 CK 19 [clone BCK 108] CK19 Basal Phenotype CK 5/6 [cloneD5/16134] CK5/6 CK 14 [clone LL002] CK14
SMA [clone 1A4] Actin
p63 ab-1 [clone 4A4] p63 Hormone receptors
ER [clone 1D5] ER
PgR [clone PgR 636] PgR
AR [clone F39.4.1] AR
EGFR family members
EGFR [clone EGFR.113] EGFR
HER2/c-erbB-2 HER2
HER3/c-erbB-3 [clone RTJ1] HER3 HER4/c-erbB-4 [clone HFR1] HER4 Tumour suppressor genes
p53 [clone DO7] p53
nBRCA1 Ab-1 [clone MS110] nBRCA1 Anti-FHIT [clone ZR44] FHIT Cell adhesion molecules
Anti E-cad [clone HECD-1] E-cad Anti P-cad [clone 56] P-cad Mucins
NCL-Muc-1 [clone Ma695] MUC1 NCL-Muc-1 core [clone Ma552] MUC1co NCL muc2 [clone Ccp58] MUC2 Apocrine differentiation
Anti-GCDFP-15 GCDFP
Neuroendocrine differentiation
Chromogranin A [clone DAK-A3] Chromo Synaptophysin [clone SY38] Synapto
Table 1. Antibodies used and their dilutions
classified (87.8%) and just 81 (12.2%) incorrectly classi-fied. Our main concern in using this classifier came from the set of rules that were produced: they appear to be quite numerous and not straightforward, especially if they should be used by scientists not familiar with computational anal-ysis.
We then considered the Multilayer Perceptron classifier: again we used the default parameters, leaving the number of neurons in the hidden layer as 15, which is the sum of the number of attributes and classes divided by two. The default backpropagation learning algorithm was used.
Compari-son of alternative learning algorithms is outside the scope of this study. This method performed better than the C4.5 succeeding in correctly classifying 647 instances (97.6%) out of 663; just 16 cases (2.4%) were misclassified.
We finally applied the naive Bayes classifier, which is based on the assumption that numeric attributes are condi-tionally independent. This method performed worse than the previous ones, classifying properly a smaller amount of cases (576, corresponding to 86.9%). A summary of the above results can be found in Table 2.
Whole data
Method Classified Misclassified
C4.5 582 (87.8%) 81 (12.2%) MLP 647 (97.6%) 16 (2.4%) NB 576 (86.9%) 87 (13.1%)
Table 2. Comparison of results on three clas-sifiers using 25 markers.
As we previously reported we considered a smaller dataset containing just 10 ‘important’ markers. We repeated our experiments applying the above classifiers on this ‘new’ smaller dataset. For the C4.5 decision tree we could not see a particular difference, having 581 cases (87.6%) correctly classified. Also for the Multilayer Perceptron (MLP) we have an increased number of misclassified instances, this time being 34 (5.1%). The naive Bayes (NB), instead, per-formed very well compared to the previous run. Now we found that 617 cases (93.1%) were classified properly and just 46 (6.9%) were misclassified.
A summary of the latter results is reported in Table 3.
Ten Markers
Method Classified Misclassified
C4.5 581 (87.6%) 82 (12.4%) MLP 629 (94.9%) 34 (5.1%) NB 617 (93.1%) 46 (6.9%)
Table 3. Comparison of results on three clas-sifiers using only 10 markers.
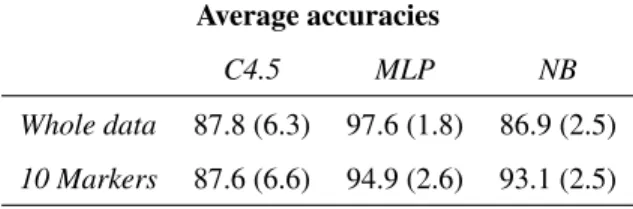
As Bouckaert did in [2], the 10 accuracies of each al-gorithm were compared using t-tests, after checking for normality using the Shapiro test [10]. We found that, for both the whole data and the 10-markers datasets, the Mul-tilayer Perceptron classifier performed significantly better
than the other two (p << 0.01). The C4.5 decision tree algorithm was significantly more accurate than the naive Bayes (p < 0.01) when we consider the whole data, but was not when we reduced the number of features. Table 4 summarizes our findings.
Average accuracies
C4.5 MLP NB
Whole data 87.8 (6.3) 97.6 (1.8) 86.9 (2.5)
10 Markers 87.6 (6.6) 94.9 (2.6) 93.1 (2.5)
Table 4. Average accuracies on 10×10 cross validation experiments for the three classi-fiers (standard deviation in brackets).
4
Discussion
In this paper we reviewed three different classifiers and used them over a novel dataset of tumour markers for breast cancer. From our experiments we got different results for each of them.
Using the whole dataset (25 markers×663 instances) we obtained the best performance from the Multilayer Per-ceptron classifier: in fact just 16 cases were incorrectly clas-sified. The naive Bayes and C4.5 decision tree returned sim-ilar results (but worse than the MLP), with the latter being a bit more accurate than the naive Bayes.
When we moved to consider just the 10 ‘most important’ markers, we found a substantial improvement in the naive Bayes performance: even though it did not return the high-est number of correctly classified instances, it performed much better than with all the markers, decreasing the num-ber of misclassified instances from 87 to 46. Again, the best results were obtained using the Multilayer Perceptron, but this time the network did not perform as well as before: there were 18 more cases of misclassification. Finally, the C4.5 decision tree was the worst classifier among the three used, performing almost identically as with all markers.
From the results, all classifiers achieved a reasonable performance. They all are suitable for large-scale predic-tion and classificapredic-tion tasks on complex datasets. However, each of them has weak points.
The C4.5 classifier may be considered what is called ‘a white box model’: the reason for arriving at the classifica-tion can be explicitly determined by examining the model. It also achieves good classification accuracy with large data in a short time.
On the other hand, for real world datasets, the decision tree may become huge. In particular, for scientists not
fa-miliar with computational analysis, the set of rules coming from a decision tree may not be straightforward.
Multilayer Perceptrons, using a backpropagation algo-rithm, are a standard algorithm for any supervised-learning pattern recognition process. However, like the majority of neural networks, it is a good example of a ‘black box model’, since explanation of the results is not available in an easily comprehended form. If one tries to write down the network model and the function representing the entire process, this might take a long time and in some cases it might be extremely complicated.
Naive Bayes is a fast-supervised classification technique and, in general, it is a good approach for a classification problem. It is easy to understand and reproduce manually, being basically based on a product of conditional probabil-ities.
However, one must be aware that naive Bayes relies on two fundamental assumptions: the first one is the complete independence of features (which is largely satisfied in our data), and the second is that the attributes should follow a normal distribution, which is not always true. Considering the latter assumption, it is immediately apparent that our data does not have a normal distribution. However, despite the violation in its assumptions, the naive Bayesian classi-fier is remarkably effective on our dataset in practice, show-ing a good performance.
Given the violation of the naive Bayes hypothesis of nor-mality, we have begun exploring other methods to repre-sent features’ distributions and to classify our data. We are now trying to implement a ‘non-parametric’ version of the naive Bayes classifier, which should be able to categorize instances independently from their distribution. In conclu-sion, we have found a standard MLP to be a highly effective classifier, but with poor interpretability. We have also found that naive Bayes achieves almost as good performance, with good interpretability, despite the strong violation of one of its assumptions.
Acknowledgements
This study was supported by the BIOPATTERN FP6 Network of Excellence (FP6-IST-508803) and the BIOP-TRAIN FP6 Marie-Curie EST Fellowship (FP6-007597).
References
[1] A. Bellaachia and E. Guven. Predicting breast cancer surviv-ability using data mining techniques.Scientific Data Mining Workshop, in Conjunction with the 2006 SIAM Conference on Data Mining, 2006.
[2] R. Bouckaert. Naive bayes classifiers that perform well with continuous variables. InAI 2004: Advances in Artificial In-telligence, volume 3339, pages 1089–1094. Springer Berlin / Heidelberg, 2005.
[3] D. Delen, G. Walker, and A. Kadam. Predicting breast can-cer survivability: a comparison of three data mining meth-ods. Artificial Intelligence in Medicine, 34(2):113–127, 2005.
[4] J. Garibaldi, D. Soria, F. Ambrogi, A. Green, D. Powe, E. Rakha, R. Macmillan, R. Blamey, G. Ball, P. Lisboa, T. Etchells, P. Boracchi, E. Biganzoli, and I. Ellis. Identifica-tion of key breast cancer phenotypes.Submitted to European Journal of Cancer, 2008.
[5] S. Haykin.Neural Networks: A Comprehensive Foundation. Prentice Hall, 2 edition, 1998.
[6] G. John and P. Langley. Estimating continuous distributions in bayesian classifiers. Proceeding of the Eleventh Confer-ence on Uncertainty in Artificial IntelligConfer-ence, 1995. [7] T. Mitchell.Machine Learning. McGraw-Hill, 1997. [8] J. Nahar, Y.-P. Chen, and S. Ali. Kernel-based naive bayes
classifier for breast cancer prediction.Journal of Biological System, 15(1):17–25, 2007.
[9] J. Quinlan.C4.5: Programs for Machine Learning. Morgan Kaufmann, Los Altos, California, 1993.
[10] P. Royston. Algorithm as 181: The w test for normality.
Applied Statistics, 31:176180, 1982.
[11] I. Witten and E. Frank. Data Mining: Practical Machine Learning Tools and Techniques with Java Implementations. Morgan Kaufmann, San Francisco, 2000.