ANALYTICAL METHOD DEVELOPMENT AND VALIDATION OF
PLERIXAFOR AND RELATED SUBSTANCES IN BULK FORM.
J. Anil Kumar, Saroj Kumar Sahoo* and K. Harinadha Baba
Sri Sivani College of Pharmacy, Chilakapalem, Srikakulam, AP.
ABSTRACT
A reverse phased HPLC method for the estimation of related substance
present in Plerixafor in bulk form has been validated as per ICH
guidelines. The method was developed using C18 (Kromosil 250x4.6
mm,5μm) column using the gradient program with mobile phase A
(Buffer and Acetonitrile 80:20) and mobile phase B (Buffer and
Acetonitrile 20:80) pH maintained at 3±0.05 and were monitored at
215 nm. The linearity level for Plerixafor was established with
concentration of drug extending from 0.010 to 0.201%. The linearity
level for Plerixafor impurity (H-PXFRC01 & H-PXFRC02) was
established with concentration ranging from 0.005 to 0.300% & 0.007
to 0.301%. The % recovery obtained between 99.1 to 99.5% & 105.4 to 106.0%, proved that
the method was accurate. The system precision results were within the limits. The low values
of RSD showed that the method is precise. LOD and LOQ of method were determined, based
on signal to noise method. Robustness of the proposed method was ascertained by
deliberately changing the pH variation, flow rate of mobile phase and mobile phase stability.
There was no significant change in the system suitability factors of Plerixafor and its impurity
peak when these parameters were changed. The low values of the % RSD indicated the
robustness of the method.
KEYWORDS: HPLC method validation, Plerixafor, Acetonitrile.
INTRODUCTION
Plerixafor is an anticancer drug,[1] it stimulates the release of stem cells from the bone marrow into the blood in patients with non-Hodgkin lymphoma and multiple myeloma.[2] These stem cells are then collected and used in autologous stem cell transplantation to replace
blood-forming cells that were destroyed by chemotherapy.[3] Plerixafor has orphan drug
Volume 7, Issue 12, 542-555. Research Article ISSN 2277– 7105
Article Received on 24 April 2018,
Revised on 14 May 2018, Accepted on 04 June 2018
DOI: 10.20959/wjpr201812-12547
*Corresponding Author
Saroj Kumar Sahoo
Sri Sivani College of
Pharmacy, Chilakapalem,
status in the United States and European Union; it was approved by the U.S. Food and Drug
Administration on December 15, 2008. Plerixafor inhibits the CXCR4 chemokine receptor
and reversibly blocks binding to the marrow compartment of its cognate ligand, stromal cell
derived factor-1-alpha (SDF-1alpha), which play a role in the trafficking and homing of
human hematopoietic stem cells.[4,9] Phase III studies have demonstrated that plerixafor combined with granulocyte-colony stimulating factor (G-CSF) improves PBSC collection
compared to mobilization with G-CSF alone in patients with MM or NHL.[10,11] Phase II study was undertaken to investigate the efficacy and safety of hematopoietic stem cell
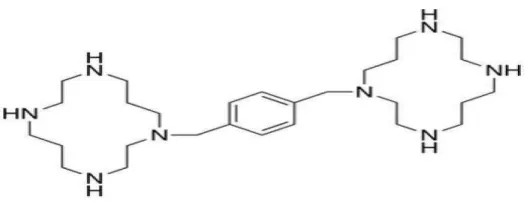
mobilization with plerixafor in patients with HL.[12] Plerixafor[13] is chemically 1,1’-[1,4-phenylenebis(methylene)]bis[1,4,8, 11- tetraazacyclotetradecane]. (Figure No. 1).
The objective of this work was to present a stability-indicating method to estimate Plerixafor
and its related compounds. In the present work, a simple, fast and precise liquid
chromatographic method was developed for the determination of Plerixafor and its
[image:2.595.166.431.385.486.2]impurities.
Figure No. 1: Structure of Plerixafor.
MATERIALS AND METHODS
Chemicals and reagents
The Plerixafor standard and its impurities were supplied by Aurbindo pharma Pvt Ltd,
Mumbai, India. The HPLC-grade Acetonitrile, sodium-1-heptanoicsulfonic acid, Perchloric
acid and Sodium hydroxide were purchased from Merck. HPLC-grade water was prepared
using the Millipore Milli-Q Plus, water purification system.
Chromatographic conditions and equipment
The LC system of Agilent LC 1200, Waters 2695 pump with a PDA detector was used for
this study and chromatographic separation was achieved on the C18 Kromosil RP (250x 4.6
mm, 5µm) column as the stationary phase. The separation was achieved by the gradient
Mobile phase A contained buffer and acetonitrile in the ratio of 80:20 (v/v). Mobile phase B
contained a mixture of buffer and acetonitrile in a ratio of 20:80 (v/v). The HPLC gradient
program (T/%B) was set as 0.01/10, 4.0/20, 40.0/50, 45.0/10 and 55.0/10 with the flow rate
of 1.0 mL/min. The peaks were monitored at the wavelength of 215 nm, keeping the column
temperature at 300C using injection volume of 20 μL.
Preparation of Mobile phase, Standard solution and Sample solution
For preparations of buffer solution, dissolved about 4.32 g of sodium-1-hepatnoic sulphonic
acid in 1000 mL of water, added 5.0 mL of Perchloric acid and mixed. Adjusted the pH of
this solution to 3 ± 0.05 with 5 N sodium hydroxide solution. A mixture of Water and
Acetonitrile in the ratio of 80:20v/v was used to get diluent. To get mobile phase-A, a
mixture of buffer and Acetonitrile in the ratio 80:20%v/v was used. To get mobile phase-B, a
mixture of buffer and Acetonitrile in the ratio 20:80%v/v was used. Filtered and degassed
through 0.45μm membrane filter paper. Diluent used as blank solution. For reference
solution, weighed accurately about 25mg of Plerixafor standard into a 100mL volumetric
flask, dissolved and diluted to the volume with diluents and mixed. Diluted 1.0mL of this
solution to 100mL with diluent and mixed.
Method development
The main target of the chromatographic method is to achieve the separation of impurities and
the main component Plerixafor with each other. A blended solution containing 500 mg/mL of
Plerixafor and 5 mg/mL of each impurity was prepared in diluent used for the method’s
development.
Method validation
The developed analytical method was validated for its acceptable performance to ensure
suitability of indent purpose. The validation parameters like accuracy, precision, specificity,
detection limit, quantification limit, linearity, range, ruggedness and robustness experiments
were executed. The proposed method was validated as per ICH guidelines.[14,15]
RESULTS
Method development
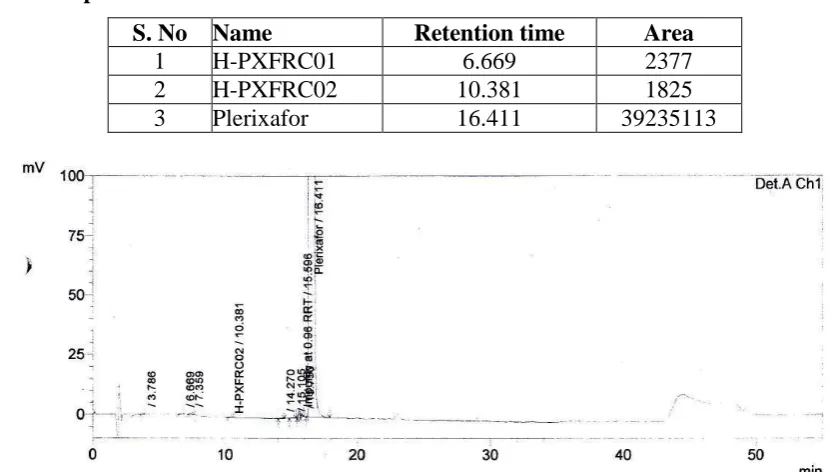
For the optimised chromatogram the retention time and area are summarized in Table I,
Table 1: Optimized results.
S. No Name Retention time Area
1 H-PXFRC01 6.669 2377
2 H-PXFRC02 10.381 1825
3 Plerixafor 16.411 39235113
Figure No. 2: Optimized chromatogram of sample.
Method validation
Specificity
Specificity is the ability of the method to measure the analyte response in the presence of all
its potential impurities. No interference was observed due to blank at the retention time of
H-PXFRC01, H-PXFRC02 and Plerixafor. The elution order & the relative retention times
obtained from individual solution & blend solution were matched. Peak purity passed for
PXFRC01, PXFRC02 and Plerixafor from individual solution and PXFRC01,
H-PXFRC02 form blend solution. The specificity (Figure No.3) of the method was
demonstrated by analysing blank and impurity in the test solution, and is found to be free
[image:4.595.79.522.585.739.2]from interferences.
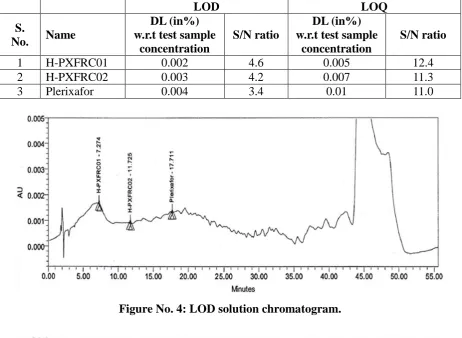
Limit of detection (LOD) and Limit of quantification (LOQ)
Signal-to-Noise ratio of Plerixafor and its impurity (H-PXFRC01) (H-PXFRC02) were found
as 4.6, 4.2 & 3.4 respectively for LOD(Figure no 4). Signal-to-Noise ratio of Plerixafor and
its impurity (H-PXFRC01) (H-PXFRC02) were found as 12.4, 11.3 and 11.0 respectively for
LOQ(Table 2, Figure no 5).
Table 2: LOD and LOQ Values.
LOD LOQ
S.
No. Name
DL (in%) w.r.t test sample
concentration
S/N ratio
DL (in%) w.r.t test sample
concentration
S/N ratio
1 H-PXFRC01 0.002 4.6 0.005 12.4
2 H-PXFRC02 0.003 4.2 0.007 11.3
[image:5.595.67.530.211.549.2]3 Plerixafor 0.004 3.4 0.01 11.0
[image:5.595.90.509.537.747.2]Figure No. 4: LOD solution chromatogram.
Precision
The %RSD Recovery of each component shown in Table 3 were in the range of 0.96 to 4.60
and the acceptance limit is, %RSD Recovery of each component is should not me more than
10.
Table 3: Precision.
Injection No. Peak area counts
H-PXFRC01 H-PXFRC02 Plerixafor
1 2558 2246 2241
2 2550 2071 2204
3 2523 2101 2304
4 2589 2296 2330
5 2547 2122 2384
6 2524 2289 2304
Average 2549 2188 2295
%RSD 0.96 4.60 2.79
Accuracy
The accuracy of the method was determined by performing the recovery experiment of
impurities at 3 levels (50%, 100%, and 150%). The % recovery obtained should be between
85.0% and 115.0%. The results shown in table 4 for PXFRC01 and table 5 for
[image:6.595.78.489.179.313.2] [image:6.595.61.538.445.773.2]H-PXFRC02.
Table 4: Recovary of H-PXFRC01.
Sample No.
Spike level
% of impurity added
% of impurity found
(recovered) % Recovery
Average
%recovery %RSD
1
50% 0.0750
0.0753 100.4
99.9 0.56
2 0.0750 100.0
3 0.0745 99.3
4
100% 0.1499
0.1460 97.4
98.6 1.08
5 0.1488 99.3
6 0.1487 99.2
7
150% 0.2249
0.2231 99.2
99.3 0.15
8 0.2234 99.3
9 0.2238 99.5
Table 5: Recovery of H-PXFRC02.
Sample No.
Spike level
% of impurity added
% of impurity found
(recovered) % Recovery
Average
%recovery %RSD
1
50% 0.0750
0.0794 105.9
105.2 0.67
2 0.0784 104.5
3 0.0788 105.1
4
100% 0.1501
0.1623 108.1
106.3 1.61
5 0.1572 104.7
6 0.1593 106.1
7
150% 0.2251
0.2378 105.6
105.7 0.22
8 0.2376 105.6
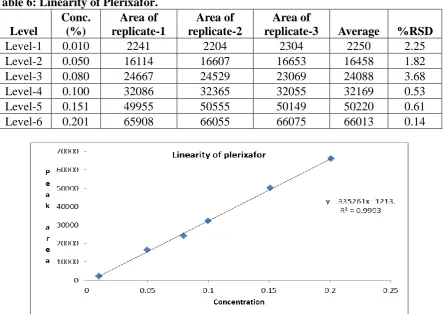
Linearity of Plerixafor
The linearity level for Plerixafor (Table 6, Figure 6) was established from QL level to
linearity level-6, with concentration of drug extending from 0.010 to 0.201% with R2 value of 0.9993. The linearity level for Plerixafor impurity (H-PXFRC01 & H-PXFRC02) shown in
Table 7,8 and Figure 7,8 was established from QL level to linearity level-6, with
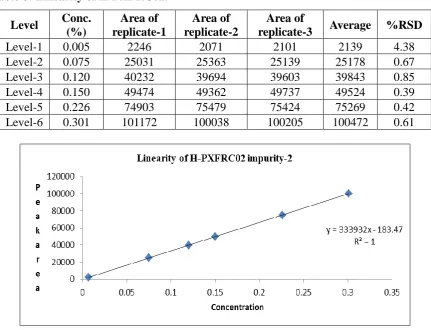
concentration ranging from 0.005 to 0.300% & 0.007 to 0.301% with R2value of 1.000 & 1.000. The calibration plot of peak area against concentration was linear in the range
investigated and the linear regression data for the calibration plot are indicative of a good
[image:7.595.78.522.277.591.2]linear relationship between peak area and concentration over a wide range.
Table 6: Linearity of Plerixafor.
Level
Conc. (%)
Area of replicate-1
Area of replicate-2
Area of
replicate-3 Average %RSD
Level-1 0.010 2241 2204 2304 2250 2.25
Level-2 0.050 16114 16607 16653 16458 1.82
Level-3 0.080 24667 24529 23069 24088 3.68
Level-4 0.100 32086 32365 32055 32169 0.53
Level-5 0.151 49955 50555 50149 50220 0.61
Level-6 0.201 65908 66055 66075 66013 0.14
Figure No. 6: Linearity curve of Plerixafor.
Table 7: Linearity of H-PXFRC01.
Level Conc.
(%)
Area of replicate-1
Area of replicate-2
Area of
replicate-3 Average %RSD
Level-1 0.005 2558 2550 2523 2544 0.72
Level-2 0.075 38850 3889 38791 38827 0.08
Level-3 0.120 61825 61895 62048 61923 0.18
Level-4 0.150 77430 77638 77495 77521 0.14
Level-5 0.225 115466 115394 115480 115447 0.04
Figure No. 7: Linearity curve of impurity-1.
Table 8: Linearity of H-PXFRC02.
Level Conc.
(%)
Area of replicate-1
Area of replicate-2
Area of
replicate-3 Average %RSD
Level-1 0.005 2246 2071 2101 2139 4.38
Level-2 0.075 25031 25363 25139 25178 0.67
Level-3 0.120 40232 39694 39603 39843 0.85
Level-4 0.150 49474 49362 49737 49524 0.39
Level-5 0.226 74903 75479 75424 75269 0.42
Level-6 0.301 101172 100038 100205 100472 0.61
Figure No. 8: Linearity curve of impurity-2.
System Precision
Prepared and injected the reference solution in two replicate injections and calculated % RSD
for the peak area response of each component obtained from two replicate injections of
%RSD. % RSD for peak Areas response of six replicate for Plerixafor and in standard
[image:9.595.156.440.143.280.2]solution was as found 0.58 shown in Table 9.
Table 9: System precision.
Injection No. Peak area countsPlerixafor
1 29377
2 29382
3 29531
4 29080
5 29149
6 29209
Average 29288
% RSD 0.58
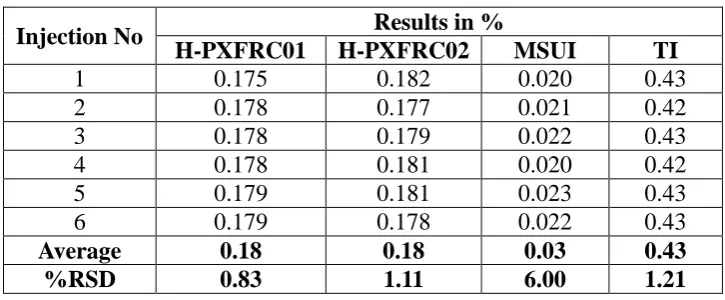
Method Precision
Performed the analysis by spiking the test sample with H-PXFRC01 & H- PXFRC02 at
100% level for six times and determined the method precision. Calculated the % of
H-PXFRC01, H-PXFRC02, MSUI, and total impurities of each individual preparation as per the
method. From six replicate injections, the % RSD for % impurity PXFRC01),
(H-PXFRC02), %MSUI and % of total impurities were found as 0.83, 1.1, 6.0 and 1.21
respectively shown in Table 10.
Table 10: Method Precision.
Injection No Results in %
H-PXFRC01 H-PXFRC02 MSUI TI
1 0.175 0.182 0.020 0.43
2 0.178 0.177 0.021 0.42
3 0.178 0.179 0.022 0.43
4 0.178 0.181 0.020 0.42
5 0.179 0.181 0.023 0.43
6 0.179 0.178 0.022 0.43
Average 0.18 0.18 0.03 0.43
%RSD 0.83 1.11 6.00 1.21
Intemediate Precision
Intermediate precision study was carried by performing study on a different day, with
different instrument, different analyst and different column using fresh preparations. Prepared
and injected reference solution in six replicate and recorded the chromatogram. Prepared and
injected spiked solution in six preparation and calculated the % of PXFRC01,
[image:9.595.116.479.467.617.2]% RSD of % impurity (H-PXFRC01) (H-PXFRC02), %MSUI, % of TI from six replicate
injections were found as 0.31, 0.94, 1.67 and 1.03 respectively shown in Table 11.
Table 11: Intermediate precision.
Injection No Results in %
H-PXFRC01 H-PXFRC02 MSUI TI
1 0.162 0.164 0.026 0.40
2 0.162 0.165 0.026 0.40
3 0.161 0.162 0.025 0.40
4 0.162 0.166 0.026 0.41
5 0.161 0.165 0.025 0.40
6 0.162 0.166 0.025 0.40
Average 0.16 0.16 0.03 0.40
%RSD 0.31 0.94 1.67 1.03
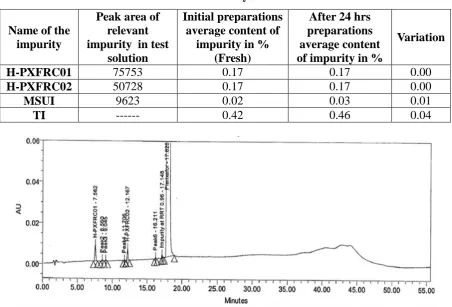
Test Solution state stability
Prepared and injected spiked test sample solution in duplicate (fresh sample preparations) and
record the chromatogram. Injected each interval stability sample solution in duplicate and
recorded the chromatograms. Compared the % variation of each H-PXFRC01, H-PXFRC02
obtained from initial sample (fresh sample) and each time interval of stability sample
solution, reported the solution stability in hours. The variation of content (%) of H-PXFRC01
obtained from initial (fresh) sample and various hours study (12hours, 24 hours) concluded
that the drug was stable up to 24 hours. The results shown in Table 12,13 and figure 9,10
respectively.
Table 12: After 12 hrs test solution state stability.
Name of the impurity
Peak area of relevant impurity in test solution
Initial preparations average content of
impurity in % (Fresh)
After 12 hrs preparations average content of
impurity in %
Variation
H-PXFRC01 75668 0.17 0.17 0.00
H-PXFRC02 51023 0.17 0.17 0.17
MSUI 8981 0.02 0.03 0.01
Figure No. 9: Test solution spiked with impurities after 12 hrs.
Table 13: After 24 hrs test solution state stability.
Name of the impurity
Peak area of relevant impurity in test
solution
Initial preparations average content of
impurity in % (Fresh)
After 24 hrs preparations average content of impurity in %
Variation
H-PXFRC01 75753 0.17 0.17 0.00
H-PXFRC02 50728 0.17 0.17 0.00
MSUI 9623 0.02 0.03 0.01
TI --- 0.42 0.46 0.04
Figure No. 10: Test solution spiked with impurities after 24 hrs.
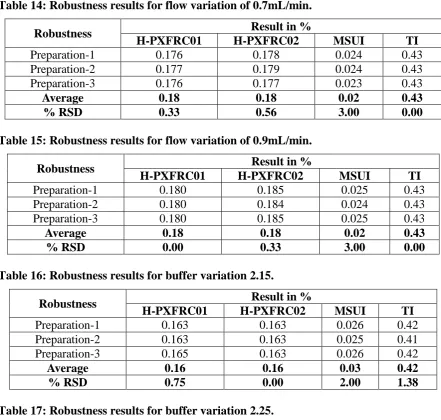
Robustness results
Robustness of the proposed method was ascertained by deliberately changing the pH
variation, flow rate of mobile phase and mobile phase stability. There was no significant
change in the system suitability factors of Plerixafor and its impurity peak when these
parameters were changed. The low values of the % RSD indicated the robustness of the
[image:11.595.72.525.299.606.2]Table 14: Robustness results for flow variation of 0.7mL/min.
Robustness Result in %
H-PXFRC01 H-PXFRC02 MSUI TI
Preparation-1 0.176 0.178 0.024 0.43
Preparation-2 0.177 0.179 0.024 0.43
Preparation-3 0.176 0.177 0.023 0.43
Average 0.18 0.18 0.02 0.43
% RSD 0.33 0.56 3.00 0.00
Table 15: Robustness results for flow variation of 0.9mL/min.
Robustness Result in %
H-PXFRC01 H-PXFRC02 MSUI TI
Preparation-1 0.180 0.185 0.025 0.43
Preparation-2 0.180 0.184 0.024 0.43
Preparation-3 0.180 0.185 0.025 0.43
Average 0.18 0.18 0.02 0.43
% RSD 0.00 0.33 3.00 0.00
Table 16: Robustness results for buffer variation 2.15.
Robustness Result in %
H-PXFRC01 H-PXFRC02 MSUI TI
Preparation-1 0.163 0.163 0.026 0.42
Preparation-2 0.163 0.163 0.025 0.41
Preparation-3 0.165 0.163 0.026 0.42
Average 0.16 0.16 0.03 0.42
% RSD 0.75 0.00 2.00 1.38
Table 17: Robustness results for buffer variation 2.25.
Robustness Result in %
H-PXFRC01 H-PXFRC02 MSUI TI
Preparation-1 0.165 0.161 0.023 0.40
Preparation-2 0.166 0.162 0.024 0.41
Preparation-3 0.165 0.160 0.023 0.41
Average 0.17 0.16 0.02 0.41
% RSD 0.35 0.63 3.00 1.41
Table 18: Robustness results for Mobile phase state stability.
Robustness Result in %
H-PXFRC01 H-PXFRC02 MSUI TI
Preparation-1 0.164 0.164 0.024 0.41
Preparation-2 0.164 0.164 0.024 0.41
Preparation-3 0.164 0.164 0.024 0.41
Average 0.16 0.16 0.02 0.41
CONCLUSION
A simple gradient RP-HPLC method has been developed and validated for the determination
of related substances of Plerixafor in bulk form. The developed method has been found to
selective, sensitive, precise and robust. The method can be directly adopted in quality control
laboratories for routine analysis with respect to determination of related substances of
Plerixafor in bulk form.
REFERENCES
1. Dr. Kealey and P.J Haines, Analytical Chemistry, 1stedition, Bios Publisher, 2002; 1-7.
2. A.Braith Wait and F.J.Smith, Chromatographic Methods, 5thedition, KluwerAcademic
Publisher, 1996; 1-2.
3. Uy GL, Rettig, Cashen AF, Plerixafor, a CXCR4 antagonist for the mobilisation of
haemopoetic stem cells, Expert opin Biol Ther, 2008; S(11): 1797-1804.
4. Stewart DA, Smith, C, MacfarlandC, calendar G, pharmacokinetics and
pharmacodynamics of plerixafor in patients with Blood marrow Transplant, 2009; 15(1):
39-46.
5. Hamini reddy, Bapatu, Ravikumar.M, P.satyanarayana murthy, Robust and Rugged
Stability indicating HPLC method for the determination of plerixafor and its related
impurities in drug substances, journal of chromatographic science, 2015; 1-11.
6. M.Mathruisri Annapurna, B.Saipavankumar, S.V.S.Goutham, B.Venkatesh, Stability
indicating HPLC and derivative spectrophotometric methods for plerixafor. Drug
invention today, 2012; 4(9): 465-469.
7. Broxmeyer, H.E., Orschell, C.M., Clapp, D.W., Hangoc, G., Cooper, S., Plett, P.A., et al.;
Rapid mobilization of murine and human hematopoietic stem and progenitor cells with
AMD3100, a CXCR4 antagonist; The Journal of Experimental Medicine, 2005; 201:
1307–1318.
8. Liles WC, Broxmeyer HE, Rodger E, et al. Mobilization of hematopoietic progenitor cells
in healthy volunteers by AMD3100, a CXCR4 antagonist. Blood, 2003; 102: 2728-2730.
9. Devine SM, Flomenberg N, Vesole DH, et al. Rapid mobilization of CD341 cells
following administration of the CXCR4 antagonist AMD3100 to patients with multiple
myeloma and non-Hodgkin’s lymphoma. J Clin Oncol., 2004; 22: 1095-1102.
10.DiPersio J, Stadtmauer EA, Nademanee AP, et al. A Phase III, multicenter, randomized,
GCSF1placebo for mobilization in multiple myeloma (MM) patients for autologous
hematopoietic stem cell (aHSC) transplantation. ASH Annu Meet Abstr., 2007; 110: 445.
11.DiPersio JF, Micallef I, Stiff PJ, et al. A Phase III, multicenter, randomized, double-blind,
placebo controlled, comparative trial of AMD3100 (Plerixafor)1G-CSF vs.
placebo1G-CSF in non- Hodgkin’s lymphoma (NHL) patients for autologous hematopoietic stem cell
(aHSC) transplantation. ASH Annu Meet Abstr., 2007; 110: 601.
12.A phase II study of plerixafor (AMD3100) plus G-CSF for autologous hematopoietic
progenitor cell mobilization in patients with Hodgkin lymphoma. Cashen A1, Lopez S,
Gao F, Calandra G, MacFarland R, Badel K, DiPersio J. Biol Blood Marrow Transplant,
2008 Nov.; 14(11): 1253-61.
13.The merck index, an encyclopedia of Chemical Drug and Biologicals, Eds, 14th Ed, published by merckreasearch Laboratories, Division of merckand Co.inc., White house
station, NJ, 2006.
14.International Conference on Harmonization (ICH), Validation of Analytical Procedures:
Text and Methodology (Q2(R1)); IFPMA, Geneva, Switzerland, 2005.
15.International Conference on Harmonization (ICH), Stability Testing of New Drug