ORIGINAL ARTICLE
Drinking histories of fatally injured drivers
S P Baker, E R Braver, L-H Chen, G Li, A F Williams
. . . . Injury Prevention 2002;8:221–226 Context: About 30% of drivers killed in crashes have high blood alcohol concentrations (BACs) of 0.10+ g/dl. There is a question about whether these drivers primarily are problem drinkers who chronically drink and drive—the so-called hard core drinking drivers.
Objective:To investigate drinking histories of fatally injured drivers in relation to their BACs. Design and participants:Retrospective cohort study of 818 fatally injured drivers who were included in the 1993 National Mortality Followback Survey (a national sample of US deaths in which next of kin were interviewed) and whose BACs were recorded by the Fatality Analysis Reporting System, a census of US traffic deaths.
Main outcome measure:Problem drinking indicators.
Results:At least one indicator of potential problem drinking, primarily heavy drinking, was reported for 68% of drivers with very high BACs (0.15+ g/dl), 41% with BACs of 0.10–0.14 g/dl, 32% with BACs of 0.01–0.09 g/dl, and 7% with zero BACs. Spouses provided more credible responses than other relatives: they were more likely to report at least occasional drinking and driving among deceased drivers with high BACs. For the most direct signs of problem drinking (described as a prob-lem drinker during the last month of life or frequently driving after having five or more drinks), spousal reports suggested the prevalence of problem drinking among drivers with very high BACs was 22% (having both indicators), 32% (frequently driving after having five or more drinks), 44% (described as problem drinker), or 57% (having either indicator).
Conclusions:Drivers with BACs of 0.10+ g/dl were far more likely than sober drivers to be described as having markers of problem drinking. However, many did not have indicators suggestive of problem drinking. In addition to programs focused on repeat offenders or problem drinkers, countermeasures such as sobriety checkpoints that target a broader spectrum of drinking drivers are appropriate.
T
he characteristics of drinking drivers who are involved incrashes or arrested for operating vehicles while impaired have long been of interest, particularly the extent to which they are problem drinkers or alcoholics. In a comprehensive review of studies conducted from 1950 through 1981, Vingilis noted that although most alcohol impaired drivers initially were believed to be social drinkers, subsequent evidence sug-gested that 30%–50% of drivers with alcohol related crashes or
citations have drinking problems.1
Recent studies of drinking problems among drivers admitted to trauma centers because of motor vehicle crashes reported that about 18% of
hospital-ized drivers met criteria for current alcohol dependence.2
Both periodic binge drinking (defined as five or more drinks on an occasion) as well as chronic heavy drinking appear to
independently contribute to driving while intoxicated.3 4
This study revisits this question. Fatally injured US drivers were studied to examine the relationship between BAC data from crash reports and a history of problem drinking, based upon interviews with family members. The drinking histories of drivers with blood alcohol concentrations (BACs) of 0.15 g/dl or greater are of particular interest, given the current
emphasis on the “hard core” drinking driver.5–8Hard core is a
term used to describe individuals who repeatedly drive with high BACs and who seem resistant to changing their behavior. The definition of hard core assumes that this group is comprised of individuals with drinking problems. The usual operational definition of a hard core drinking driver is a driver who either has repeated convictions for alcohol impaired driv-ing or has a BAC of 0.15 g/dl or greater. Considerable attention has been devoted to the question of how to deter hard core drinking drivers, based on the concept that they are the
primary contributors to alcohol impaired driving.5–10
If alcohol impaired drivers represent a broader spectrum of the drinking population, however, prevention efforts directed toward both
the entire community and repeat offenders may be more effective than those focusing primarily on repeat offenders.
METHODS
Data sources
Data for this study were from two federal sources: the 1993
National Mortality Followback Survey (NMFS)11 and the
Fatality Analysis Reporting System (FARS).12
The 1993 NMFS included a total of 22 957 decedents sampled from 2 215 000 adults aged 15 or older who died in 1993 in the US, excluding South Dakota, based on a stratified random sampling strategy. Information on decedents was obtained by telephone or personal interview from the informants named on the death certificates. One informant was interviewed for each sampled death. The informants usually were spouses, parents, children, or siblings of the deceased. The overall response rate was 83%. NMFS questions included use of alcohol.
FARS collects data on all traffic crashes within the US that involve a motor vehicle traveling on a public road and result in a death within 30 days of the crash. Data on BACs and previ-ous convictions for driving under the influence or while intoxicated were obtained from FARS for the sample of driver fatalities included in the 1993 NMFS.
The National Highway Traffic Safety Administration provided a file of the 1456 fatally injured drivers included in NMFS, matched by death certificate number with their records in FARS. Of the 1456 cases coded as drivers in NMFS, 1121 also were coded as drivers in FARS. The remaining 335, primarily coded in FARS as pedestrians, were excluded from analysis. . . . . Abbreviations:BAC, blood alcohol concentration; FARS, Fatality Analysis Reporting System; NMFS, National Mortality Followback Survey See end of article for
authors’ affiliations
. . . .
Correspondence to: Susan P Baker, Johns Hopkins University Bloomberg School of Public Health, Center for Injury Research and Policy, 624 North Broadway, Baltimore, MD 21205, USA; [email protected]
BACs were available for 818 of the 1121 drivers (73%), and rela-tives answered questions related to drinking for 84%–93% of the 818, depending on the individual question.
Imputed BACs13
for deceased drivers with missing data were not used because using imputed values would add uncertainty to any observed associations between drinking histories and BACs. The 818 drivers with FARS recorded BACs were similar in distribution by age and gender to all 23 043 fatally injured drivers in 1993. In addition, the BAC distributions of the 818 drivers resembled those of the 16 503 fatally injured drivers in 1993 for whom BAC data were available: 31% of NMFS drivers in the present study and 30% of driver fatalities in FARS had BACs of 0.15 g/dl or greater.
Analyses
Reported drinking and other behavioral characteristics rel-evant to traffic safety were analyzed in relation to BACs recorded in FARS. Drinking behavior was measured by a number of variables including reported quantity and fre-quency of drinking and various indicators of problem drinking. Time frames for the questions ranged from the decedents’ last month to last year of life.
Using drinking level categories modified from those of Caha-lanet al, decedents were classified as abstainers or light,
moder-ate, heavy, or very heavy drinkers, as illustrated in table 1.14
In this paper we use both of the following terms, which have dif-ferent but related meanings: problem drinker and hard core drinking driver. The former refers to drinking histories sugges-tive of alcohol dependence and life problems related to drinking, and the latter is used by some organizations to refer to people who chronically drink and drive and who are resistant to changing their behavior. Although there is a standard opera-tional definition for a hard core drinking driver (repeated alco-hol related convictions or a BAC of 0.15+ g/dl), there is no standard definition of a problem drinker. We chose four poten-tial indicators of problem drinking, namely whether the relatives described the decedent as:
(A) A problem drinker during the last month of life (the NMFS interviewer explained: “By alcoholic or problem drinker, I mean a person who has physical or emotional prob-lems because of drinking, probprob-lems with a spouse, family or friends because of drinking, problems at work or school because of drinking, problems with money because of drink-ing, or problems with the police because of drinkdrink-ing, such as drunk driving”).
(B) Driving within two hours after having five or more drinks at least once a month during the last year of life.
(C) A heavy or very heavy drinker during the last year of life (table 1 categories).
(D) Having five or more drinks at one time at least once a month in the year preceding death.
The first two indicators were chosen because they appeared to be direct measures of problem drinking; however, the second measure is not definitive because alcohol impairment is dependent upon the period during which drinks are
consumed. The latter two indicators referred to heavy drinking, which is not synonymous with problem drinking;
however, most problem drinkers are heavy drinkers.15–17
Prior convictions for driving while under the influence or while intoxicated were not used as an indicator of problem drinking because most alcohol impaired driving does not result in an arrest and many arrests do not lead to convictions.18 19
In addition, FARS data are limited to convictions occurring within the three years before the crash
so some offenders escape identification as repeat offenders.20
The drinking histories reported by different types of informants (spouses, children, siblings, parents) were com-pared to see if some informants gave more credible information concerning driving after drinking relative to the known BACs of drivers killed in crashes. Separate estimates of problem drinking prevalence were calculated from data obtained from the most reliable informants.
The primary statistical analyses were comparisons of proportions of drivers in various BAC categories (zero, 0.01–0.09, 0.10–0.14, and 0.15+ g/dl) with respect to problem drinking indicators and other variables of interest. Dying with a BAC of 0.15+ g/dl was the primary outcome of interest because such drivers meet the standard operational definition of a hard core drinking driver.
As a supplement to these analyses, risk ratios (with 95% confidence intervals) for drivers having BACs of 0.15+ g/dl in comparison with drivers having no detectable blood alcohol were calculated for problem drinking indicators. Risk ratios for other BAC categories were not calculated because the numbers in other BAC positive categories were too small for robust statistical interpretations.
Two statistical software programs (SAS and SPSS) were
used to compute risk ratios andχ2
tests comparing proportions of variables by BAC category. See appendix at end of paper for formulas for risk ratios and their 95% confidence intervals.
RESULTS
Demographic characteristics
Compared with drivers who had not been drinking, fatally injured drivers with very high BACs (0.15+ g/dl) were more
likely to be male (86%v67%, aged 30–49 (50%v30%), and
divorced or separated (27%v 14%). Differences by urban or
rural residence were not remarkable. Drivers with high BACs (0.10–0.14 g/dl) were similar demographically to those with very high BACs except that they were more likely to be younger than age 20.
BACs and drinking patterns
Of the 818 driver fatalities, 254 (31%) had very high BACs of 0.15+ g/dl, 57 (7%) had high BACs of 0.10–0.14 g/dl, 58 (7%) had low to moderate BACs ranging from 0.01–0.09 g/dl, and 449 (55%) had BACs of zero. Forty six (19%) of the drivers with very high BACs had been convicted of driving under the influence or while intoxicated during the three years before their fatal crashes (table 2). Almost one third of the fatally Table 1 Classification of drinking level by quantity and frequency of alcohol
consumption*
No of drinks
Usual drinking frequency
Daily 3–6 times/week 1–2 times/week 1–3 times/month <1 time/month
5+ Very heavy Very heavy Heavy Heavy Moderate 3–4 Very heavy Heavy Moderate Moderate Light
2–3 Moderate Moderate Moderate Light Light
1–2 Moderate Moderate Light Light Light
<1 Light Light Light Light Light
None Non-drinker Non-drinker Non-drinker Non-drinker Non-drinker *Number of drinks was based on exact wording of the question.
injured drivers—70% of drinking drivers—met the usual operational definition of being a hard core drinking driver (254 with BACs of 0.15+ g/dl and an additional four with BACs of 0.10–0.14 g/dl who had alcohol related driving convictions in the previous three years).
Fatally injured drivers who had BACs of 0.10 g/dl or greater were often characterized by signs of potential problem drink-ing (tables 2 and 3). Dependdrink-ing on the indicator variable for problem drinking, the estimated percentages of fatally injured drivers with very high BACs (0.15+ g/dl) who were problem drinkers ranged from 21% to 61% (table 2). In contrast, estimates of problem drinking prevalence among driver fatali-ties with no detectable blood alcohol ranged from 1% to 7%. At least one of the indicators of problem drinking, usually heavy drinking, was reported for 68% of drivers with BACs of 0.15+ g/dl, 41% with BACs of 0.10–0.14 g/dl, 32% with BACs of 0.01– 0.09 g/dl, and 7% with BACs of zero. Specific results for indi-vidual indicator variables were as follows, all of which had significantly raised risk ratios for having BACs of 0.15+ g/dl (tables 2 and 3):
(A) 31% of drivers with very high BACs compared with 1% with zero BACs were described as problem drinkers during their last month of life (risk ratio 3.3).
(B) 21% of drivers with very high BACs compared with 2% with zero BACs were described as driving within two hours after having five or more drinks at least once a month during their last year of life (risk ratio 6.8).
(C) 61%of drivers with very high BACs compared with 7% with zero BACs were classified as heavy or very heavy drinkers during their last year (risk ratio 8.1).
(D) 54% of drivers with very high BACs compared with 7% with zero BACs were reported as having five or more drinks at a time at least once a month during their last year (risk ratio 4.0).
Comparisons among drivers with very high BACs of 0.15+ g/dl and other drinking drivers were hampered by the small numbers with lower BACs. Fatally injured drivers with high BACs of 0.10–0.14 g/dl were similar to drivers with very high BACs with regard to the percentages having five or more Table 2 Distribution of drinking variables by BACs of fatally injured drivers,* 1993; values are number (%)
Zero BAC Low–moderate BAC0.01–0.09 g/dl High BAC0.10–0.14 g/dl Very high BAC0.15+ g/dl
Convictions (FARS)
Conviction for driving under influence or while intoxicated 3 years before crash (n=804)
Yes 8 (2) 1 (2) 4 (7) 46 (19)
Last month of life
“Was X a problem drinker?”† (n=757)
Yes 6 (1) 0 5 (10) 72 (31)
Place driving from at time of fatal crash
Bar/tavern/nightclub 1 (0) 1 (2) 4 (10) 49 (26)
Decedent’s home 120 (35) 11 (25) 6 (15) 27 (14)
Other people’s homes/restaurant 75 (22) 12 (27) 15 (37) 64 (34)
Work/school/church 69 (20) 9 (20) 3 (7) 14 (7)
Personal errands/other 82 (24) 11 (25) 13 (32) 37 (19)
Last year of life
Usual number of drinks per day on days when decedent drank
5+ drinks 24 (6) 10 (20) 16 (39) 81 (41)
3–4 drinks 9 (2) 4 (8) 3 (7) 44 (22)
1–3 drinks 124 (31) 25 (49) 12 (29) 61 (31)
<1 drink or not drinking 240 (60) 12 (24) 10 (24) 12 (6)
Total 397 (100) 51 (100) 41 (100) 198 (100)
How often had 5+ drinks at one time
At least once a week 21 (5) 10 (20) 15 (38) 84 (43)
1–3 times/month 6 (2) 3 (6) 3 (8) 21 (11)
Less than once a month 20 (5) 3 (6) 2 (5) 18 (9)
Not applicable 348 (88) 33 (67) 20 (50) 72 (37)
Total 395 (100) 49 (100) 40 (100) 195 (100)
Drinking quantity-frequency categories‡
Very heavy 8 (2) 3 (6) 6 (15) 57 (29) Heavy 21 (5) 11 (22) 13 (33) 62 (32) Moderate 42 (11) 11 (22) 6 (15) 41 (21) Light 219 (55) 19 (37) 8 (20) 32 (16) Non-drinkers 106 (27) 7 (14) 7 (18) 4 (2) Total 396 (100) 51 (100) 40 (100) 196 (100)
Drinking and driving frequency
At least weekly 17 (4) 6 (13) 8 (20) 68 (40)
1–3 times/month 14 (4) 5 (10) 6 (15) 26 (15)
At least once a year 20 (5) 4 (8) 6 (15) 28 (17)
Not drinking and driving 345 (87) 33 (69) 20 (50) 47 (28)
Total 396 (100) 48 (100) 40 (100) 169 (100)
Number of drinks when drinking and driving
5+ drinks 9 (2) 2 (4) 8 (20) 43 (26)
3–4 drinks 4 (1) 3 (6) 3 (8) 30 (18)
1–2 drinks 36 (9) 10 (21) 9 (23) 47 (28)
Not drinking and driving 345 (88) 33 (69) 20 (50) 47 (28)
Total 394 (100) 48 (100) 40 (100) 167 (100)
Drinking and driving within 2 hours after having 5+ drinks, at least monthly (n=653)
Yes 8 (2) 2 (4) 6 (15) 36 (21)
*Fatality Analysis Reporting System (FARS) and National Mortality Followback Survey, 1993.
†Interviewer explained: “By alcoholic or problem drinker, I mean a person who has physical or emotional problems because of drinking, problems with a spouse, family or friends because of drinking, problems at work or school because of drinking, problems with money because of drinking, or problems with the police because of drinking, such as drunk driving.”
drinks on days when they drank and having five or more drinks at a time at least once a week (table 2).
A total of 59 of the 818 drivers (7%) had been convicted of alcohol related driving offenses during the three years before their fatal crashes; eight of the 59 had no detectable blood alcohol at the time of their fatal crashes (table 2). Such a con-viction was significantly associated with having a BAC of 0.15+ g/dl (risk ratio 2.7) (table 3). The occurrence of problem drinking indicators was similar among drivers with very high BACs of 0.15+ g/dl whether or not they had histories of alco-hol impaired driving convictions, although the small numbers of drivers with convictions made such comparisons less than conclusive.
A variable with implications for alcohol enforcement prac-tices is the place where the fatal trip originated (table 2). Twenty six per cent of drivers with very high BACs of 0.15+ g/dl and 10% of those with high BACs of 0.10–0.14 g/dl had left a bar.
Comparing drinking histories by relationship of informants to drivers killed in crashes
Spouses appeared to provide more credible responses than other relatives to questions about the drinking habits of driv-ers dying in crashes because they were more likely to report that decedents with very high BACs (0.15+ g/dl) drove after drinking. For drivers with very high BACs, 70% of spouses reported that decedents had driven within two hours after drinking at least once a month during the last year of life compared with 65% of adult children, 57% of siblings, and 44% of parents (table 4). Similarly, spouses were far less likely to report that decedents with very high BACs did not drink and
drive at all during the last year of life: 12% of spouses compared with 35% of parents.
When analyses were restricted to decedents for whom spouses were the respondents, problem drinking indicators increased among drivers with very high BACs, with percent-ages almost doubling compared with reports from other respondents. For the most direct signs of problem drinking (described as a problem drinker during the last month of life or frequently driving after having five or more drinks), spousal reports suggested that the prevalence of problem drinking among drivers with very high BACs could be 22% (based upon having both indicators), 32% (frequently driving after having five or more drinks), 44% (described as problem drinker), or 57% (having either indicator).
DISCUSSION
This study provides detailed information on drinking histories of fatally injured drivers. The results shed light on the question regarding the extent to which drivers who meet the operational definition of hard core drinking drivers (BAC of 0.15+ g/dl or repeated offenses for alcohol impaired driving) have characteristics indicative of problem drinking. Drivers with very high BACs (0.15+ g/dl) were far more likely than other fatally injured drivers to be described as having histories suggestive of problem drinking, but a substantial proportion were not so described. The findings among drivers with high BACs of 0.10–0.14 g/dl and low to moderate BACs of 0.01–0.09 g/dl are consistent with an increase in drinking problems as BACs increase among drivers. A small percentage of drivers without detectable blood alcohol had markers for problem drinking.
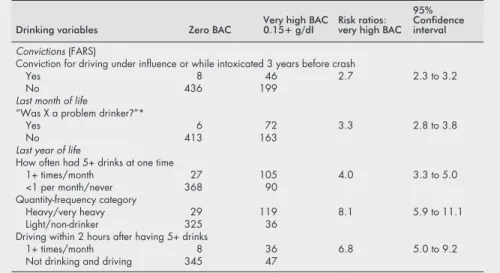
Table 3 Risk ratios for very high BACs in relation to drinking variables among fatally injured drivers, 1993*
Drinking variables Zero BAC Very high BAC0.15+ g/dl Risk ratios:very high BAC 95% Confidence interval
Convictions (FARS)
Conviction for driving under influence or while intoxicated 3 years before crash
Yes 8 46 2.7 2.3 to 3.2
No 436 199
Last month of life
“Was X a problem drinker?”*
Yes 6 72 3.3 2.8 to 3.8
No 413 163
Last year of life
How often had 5+ drinks at one time
1+ times/month 27 105 4.0 3.3 to 5.0
<1 per month/never 368 90 Quantity-frequency category
Heavy/very heavy 29 119 8.1 5.9 to 11.1
Light/non-drinker 325 36
Driving within 2 hours after having 5+ drinks
1+ times/month 8 36 6.8 5.0 to 9.2
Not drinking and driving 345 47
*Fatality Analysis Reporting System (FARS) and National Mortality Followback Survey, 1993.
Table 4 Reported driving after drinking by relationship to decedent among drivers with BACs of 0.15+ g/dl; values are number (%)
Variable
Relationship
Parent Spouse Sibling Child Other
Reported driving within 2 hours after drinking
1+ times/month 21 (44) 35 (70) 16 (57) 13 (65) 9 (39) At least once a year 10 (21) 9 (18) 4 (14) 2 (10) 3 (13) Did not drink and drive 17 (35) 6 (12) 8 (29) 5 (25) 11 (48) Total 48 (100) 50 (100) 28 (100) 20 (100) 23 (100)
Spouses appeared to be the most credible respondents because they were least likely to state that fatally injured driv-ers with very high BACs had not ever driven a motor vehicle within two hours of drinking during the last year of life. Any informants for deceased drivers with very high BACs who said their relative never drove a motor vehicle within two hours of having a drink during the last year of life clearly were incorrect. Based on spousal reports of the two strongest mark-ers for problem drinking (being described as a problem drinker in the last month of life or frequently driving after drinking five or more drinks), reasonable estimates of problem drinking among drivers with very high BACs range from 22% to 57%, depending on whether both or just one of these indi-cators were present. The drivers with both indiindi-cators would be most likely to engage in alcohol impaired driving on a regular basis and have alcohol related problems in other realms of their lives, although the two markers probably failed to
iden-tify some problem drinkers.15
Conversely, persons who consume five or more drinks before driving are not necessar-ily impaired or problem drinkers because the length of time during which the alcohol is imbibed is a critical factor.
Small numbers of drivers with BACs of 0.10–0.14 g/dl made findings among them less than definitive. None the less, their similarity to drivers with very high BACs with regard to most drinking and behavioral variables has important implications. BACs of 0.10–0.14 g/dl are more than three times as common as higher BACs among drivers on the road on weekend nights,21
and probably contribute to a substantial number of crashes resulting in non-fatal injuries.
One limitation of the NMFS data is that the information was based on proxy reports from the next of kin. It is possible that some proxies were ignorant of habitual problem drinking by the decedents or unwilling to report the drinking problems of a close family member. Also, spouses constituted only 30% of all respondents; decedents with spouses may have had drinking characteristics different from those for whom other relatives acted as informants. The research literature compar-ing self reports with proxy reports of drinkcompar-ing behavior is contradictory, with some studies finding spouses reporting more problem drinking, other studies finding spouses report-ing lower quantities of alcohol consumption than the drinkers, and still others reporting high concordance for
drinking descriptions between drinkers and next of kin.22–26
Based on affirmative answers to driving after drinking for drivers with very high BACs, the majority of NMFS informants seemed to be credible sources.
Another limitation of using NMFS data is that the findings among fatally injured drivers likely differ considerably from those in the general population of drivers; however, there is no reason to think that fatally injured drivers with high BACs would have a lower prevalence of problem drinking indicators than drivers overall. Our study might provide a maximum bound for drinking problems among drivers on the road with high BACs, assuming proxy reports were accurate. Although the data were from 1993, substantial temporal changes since then in the relationship between problem drinking and dying in a crash seem unlikely because the proportion of fatally injured passenger vehicle drivers in the United States with BACs of 0.10 g/dl or higher changed little between 1993 and 2000.27
Drinking history data and BACs were available for only 60%–70% of the fatally injured drivers in the NMFS sample, which was acceptable although less than optimal with respect to avoiding potential biases from missing data. A minor limi-tation of this study was that linking the data from NMFS to individual drivers in FARS precluded the use of sampling weights. Despite the lack of weights, NMFS drivers whose records were linked to FARS were similar demographically to all drivers killed in 1993.
Results of this research suggest a need for prevention efforts broader than those targeting repeat offenders and problem
drinkers. Many fatally injured drivers with illegally high BACs of 0.15+ g/dl or 0.10–0.14 g/dl were not described as problem drinkers or as typically driving after having five or more drinks. Moreover, the distinction often made by researchers and public health practitioners between drinking drivers with BACs of 0.10–0.14 g/dl and 0.15+ g/dl appears to be arbitrary for the purpose of identifying persons who chronically drive while impaired by alcohol.
Tough sanctions to deter repeat offenders, such as vehicle impoundment or ignition interlocks, are an important
component of programs to prevent alcohol impaired
driving,28 29but other measures directed at the general
popula-tion of drinking drivers also are needed. Some have argued against measures such as reducing the legal BAC threshold to 0.08 g/dl based on the premise that hard core drinking drivers are the major contributors to alcohol related crashes and
deserve primary attention.9 30
The evidence is growing, however, that 0.08 g/dl thresholds dissuade people from driv-ing after excessive drinkdriv-ing across the entire range of BACs,
including high BACs.31–34Other community-wide measures to
deter alcohol impaired driving, including sobriety checkpoints and administrative license suspension, are effective but are
underused.28 35–40 The substantial number of drivers with
illegally high BACs whose fatal trips originated from bars suggests that some sobriety checkpoints should be located in areas with bars and nightclubs.
FUNDING
This work was supported by the Insurance Institute for Highway Safety. Partial funding was provided by the Centers for Disease Promotion and Prevention, grant R49CCR302484. The opinions, find-ings, and conclusions expressed in the publication are those of the authors and do not necessarily reflect the views of the Insurance Institute for Highway Safety.
. . . . Authors’ affiliations
S P Baker, L-H Chen,Johns Hopkins University Bloomberg School of Public Health, Center for Injury Research and Policy, Baltimore, Maryland
Key points
• There is a question about the extent of the contribution of “hard core drinking drivers”—people with drinking problems who repeatedly drive while impaired by alcohol and resist changing their behavior—to alcohol related motor vehicle deaths. Some say such drivers should be the main focus of prevention programs; others favor programs directed toward the broader population of drinking drivers. • Relatives of a sample of US drivers dying in crashes in 1993 were interviewed concerning the drinking habits of the decedents. Their responses were compared by the post-mortem blood alcohol concentration (BAC) category of the decedents.
• Depending on the indicator variable, estimated percent-ages of fatally injured drivers who were problem drinkers ranged from 21% to 61% among those with BACs of 0.15+ g/dl. Among those with zero BACs, estimated percentages of problem drinkers ranged from 1% to 7%.
• Spouses appeared to be the most credible respondents. Based on spousal reports for the two strongest markers of problem drinking, estimates of problem drinking among deceased drivers with BACs of 0.15+ g/dl ranged from 22% to 57%.
• Drivers with very high BACs were far more likely to be described as having histories suggestive of problem drink-ing than other fatally injured drivers, but a substantial pro-portion were not so described.
• Results suggest that measures, such as sobriety checkpoints, directed toward the general population of drinking drivers are needed to prevent alcohol impaired driving. Tough sanctions also should be implemented to deter repeat offenders.
E R Braver, A F Williams,Insurance Institute for Highway Safety, Arlington, Virginia
G Li,Johns Hopkins University Bloomberg School of Public Health, Center for Injury Research and Policy, and Johns Hopkins University School of Medicine, Department of Emergency Medicine, Baltimore, Maryland
REFERENCES
1Vingilis E. Drinking drivers and alcoholics: are they from the same population?Res Adv Alcohol Drug Probl 1983;7:299–342.
2Soderstrom CA, Dischinger PC, Smith GS,et al. Alcoholism at the time of injury among trauma center patients: vehicular crash victims compared with other patients.Accid Anal Prev 1997;29:715–21.
3Duncan DF. Chronic drinking, binge drinking, and drunk driving. Psychol Rep 1997;80:681–2.
4Duncan DF, Donnelly J, Nicholson T,et al. Chronic drinking, binge drinking, and drunk driving II.Psychol Rep 1999;84:145–6. 5Simpson HM, Mayhew DR.The hard core drinking driver. Ottawa,
Ontario: Traffic Injury Research Foundation, 1991.
6Simpson HM, Mayhew DR, Beirness DJ.Dealing with the hard core drinking driver. Ottawa, Ontario: Traffic Injury Research Foundation, 1996.
7Simpson HM. Drunk, dangerous, and deadly: who are the hard core drunk drivers and what should be done to get them off the nation’s roads. Vital Speeches of the Day 1999;66:61–3.
8Beirness DJ, Simpson HM, Mayhew DR,et al. The road safety monitor: drinking and driving. Ottawa, Ontario: Traffic Injury Research Foundation, 2001.
9Bedard P. Experts refuse to say the sky won’t fall, but it won’t.Car and Driver 2000;46(1):20(July).
10National Transportation Safety Board.Safety report: actions to reduce fatalities, injuries, and crashes involving the hard core drinking driver. Report No NTSB/SR-00/01. Washington, DC: US Department of Transportation, 2000.
11National Center for Health Statistics.1993 National Mortality Followback Survey. NCHS Series 20. Atlanta, GA: Centers for Disease Control, 1998.
12National Highway Traffic Safety Administration.Fatality Analysis Reporting System: 1993 annual reports. Washington, DC: US Department of Transportation, 1994.
13National Highway Traffic Safety Administration. 1998.Multiple imputation of missing blood alcohol concentration (BAC) values in FARS. Washington, DC: US Department of Transportation. Available at: http://www.nhtsa.dot.gov/people/ncsa/ multimp_resnote.html. Accessed 1 April 2001.
14Cahalan D, Cisin I, Crossley H.American drinking practices: a national study of drinking behavior and attitudes. New Brunswick, NJ: Rutgers Center for Alcohol Studies, 1969.
15Bradley K, Bush K, McDonell M,et al. Screening for problem drinking: Comparison of CAGE and AUDIT.J Gen Intern Med 1998;13:379–88. 16Li G, Smith GS, Baker SP. Drinking behavior in relation to cause of death
among US adults.Am J Public Health 1994;84:1402–6.
17Dawson D. Alternative definitions of high risk for impaired driving: the overlap of high volume, frequent heavy drinking and alcohol dependence.Drug Alcohol Depend 1999;54:219–28.
18Brewer R, Morris P, Cole T,et al. The risk of dying in alcohol-related automobile crashes among habitual drunk drivers.N Engl J Med 1994;331:513–17.
19Liu S, Siegel PZ, Brewer RD,et al. Prevalence of alcohol-impaired driving. Results from a national self-reported survey of health behaviors. JAMA 1997;277:122–5.
20Lund AK, Thum D, Preusser CW.Completeness of driver records. Arlington, VA: Insurance Institute for Highway Safety, 1991. 21Zador PL, Krawchuk SA, Voas RB. Alcohol-related relative risk of driver
fatalities and driver involvement in fatal crashes in relation to driver age and gender: an update using 1996 data. J Stud Alcohol
2000;61:387–95.
22Midanik LT. Validity of self-reported alcohol use: a literature review and assessment.British Journal of Addiction 1988;83:1019–29.
23Graham P, Jackson R. Primary versus proxy respondents: comparability of questionnaire data on alcohol consumption.Am J Epidemiol 1993;138:443–52.
24Passaro KT, Noss J, Savitz DA, Little RE, ALSPAC study team. Agreement between self and partner reports of paternal drinking and smoking.Int J Epidemiol 1997;26:315–20.
25Morse RM, Swenson WM. Spouse response to a self-administered alcoholism screening test.J Stud Alcohol 1975;36:400–5.
26Davis LJ, Morse RM. Patient-spouse agreement on the drinking behaviors of alcoholics.Mayo Clin Proc 1987;62:689–94.
27Insurance Institute for Highway Safety.Fatality facts: alcohol. Arlington, VA. Available at: http://www.highwaysafety.org/ safety_facts/fatality_facts/alcohol.htm. Accessed 11 December 2001. 28Dejong W, Hingson R. Strategies to reduce driving under the influence
of alcohol.Annu Rev Public Health 1998;19:359–78.
29Beck KH, Rauch WJ, Baker EA,et al. Effects of ignition interlock license restrictions on drivers with multiple alcohol offenders: a randomized trial in Maryland.Am J Public Health 1999;89:1696–700.
30National Licensed Beverage Association.October 2000 NLBA report: .08 update. Alexandria, VA. Available at: http://www.nlba.org/ NLBAreports10–00.htm. Accessed 15 May 2001.
31Apsler R, Char AR, Harding WM,et al. The effects of .08 BAC laws. Report No DOT HS-808–892. Washington, DC: US Department of Transportation, 1999.
32Hingson R, Heeren T, Winter M. Effects of recent 0.08% legal blood alcohol limits on fatal crash involvement.Inj Prev 2000;6:109–14. 33Johnson D, Fell J. The impact of lowering the illegal BAC limit to .08 in
five states.Proceedings of the 39th Annual Conference of the Association for the Advancement of Automotive Medicine. Des Plaines, IL: Association for the Advancement of Automotive Medicine, 1995: 45–64.
34Voas RB, Tippets AS, Fell J. The relationship of alcohol safety laws to drinking drivers in fatal crashes.Accid Anal Prev 2000;32:483–92. 35Fell JC, Ferguson SA, Williams AF,et al. Why aren’t sobriety
checkpoints widely adopted as an enforcement strategy in the United States?Accic Anal Prev (in press).
36Klein T.Changes in alcohol-involved fatal crashes associated with tougher state alcohol legislation. Brookville, MD: Sigmastat, Inc, 1989. 37Levy D, Shea D, Asch P. Traffic safety effects of sobriety checkpoints and
other local DWI programs in New Jersey.Am J Public Health 1988;79:291–3.
38Ross HL.The deterrent capability of sobriety checkpoints: summary of the American literature. Report no. DOT HS-807–862. Washington, DC: US Department of Transportation, 1992.
39Voas RB. The relative effectiveness of checkpoints.Proceedings of the 11th International Conference on Alcohol, Drugs, and Traffic Safety. Washington, DC: National Safety Council, 1989: 76–80. 40Zador PL, Lund AK, Fields M,et al. Fatal crash involvement and laws
against alcohol-impaired driving.J Public Health Policy 1989;4:467–85.