PhD in Electronics, Computer Science and Telecommunication
Cycle XXV
Settore concorsuale di afferenza: 09/H1 - SISTEMI DI ELABORAZIONE DELLE INFORMAZIONI Settore scientifico disciplinare: ING-INF/05 - SISTEMI DI ELABORAZIONE DELLE INFORMAZIONI
Pervasive Business Intelligence
Elisa Turricchia
Coordinator
Advisor
Prof. Alessandro Vanelli Coralli
Prof. Matteo Golfarelli
Contents
1 Introduction 1
1.1 Business Intelligence . . . 1
1.2 Motivations and Contributions . . . 4
1.2.1 Distributed BI . . . 5
1.2.2 OLAP Personalization and Similarity . . . 6
1.2.3 Agile Data Warehouse Design . . . 7
2 Background 9 2.1 Basic Concepts . . . 9 2.1.1 Data Warehouse . . . 9 2.1.2 Architectures . . . 11 2.1.3 ETL . . . 14 2.1.4 OLAP Analysis . . . 15 2.2 Life-cycle Design . . . 16 2.3 Multidimensional Model . . . 17 3 Distributed BI 21 3.1 Introduction. . . 21 3.2 Related Works . . . 24 3.2.1 Warehousing Approaches . . . 26 3.2.2 Federative Approaches . . . 26 3.2.3 Peer-to-Peer Approaches. . . 28 3.3 Formal Background. . . 29 3.4 Mapping Language . . . 31 3.4.1 Mapping Predicates . . . 32 3.4.2 Mapping Accuracy . . . 34 3.5 A Reformulation Framework. . . 36 3.5.1 Translating schemata . . . 37 3.5.2 Translating queries . . . 38 3.5.3 Translating mappings . . . 40 3.5.3.1 Exact Mappings . . . 41 3.5.3.2 Loose/Approximate Mappings . . . 43
3.6 Query Reformulation in a BIN . . . 44
3.6.1 The Inter-Peer Reformulation Algorithm. . . 45
3.6.1.1 Step 1: Mapping Selection . . . 45
3.6.1.2 Step 2: Query Reformulation . . . 47
3.6.2 Properties of the Inter-Peer Reformulation Algorithm . . . 52 3.7 Implementation . . . 54 3.8 Conclusions . . . 56 4 OLAP Personalization 59 4.1 Introduction. . . 59 4.2 Related Works . . . 60 4.3 Formal Background. . . 62
4.4 ThemyMDX Preference Language . . . 63
4.5 A Personalization Framework . . . 64 4.5.1 Log Mining . . . 65 4.5.2 Rule Selection . . . 66 4.5.3 Fragment Translation . . . 69 4.6 Implementation . . . 69 4.7 Validation . . . 70 4.8 Conclusions . . . 71 5 OLAP Similarity 73 5.1 Introduction. . . 73 5.2 Formal Background. . . 74
5.3 Requirements for OLAP sessions similarity . . . 75
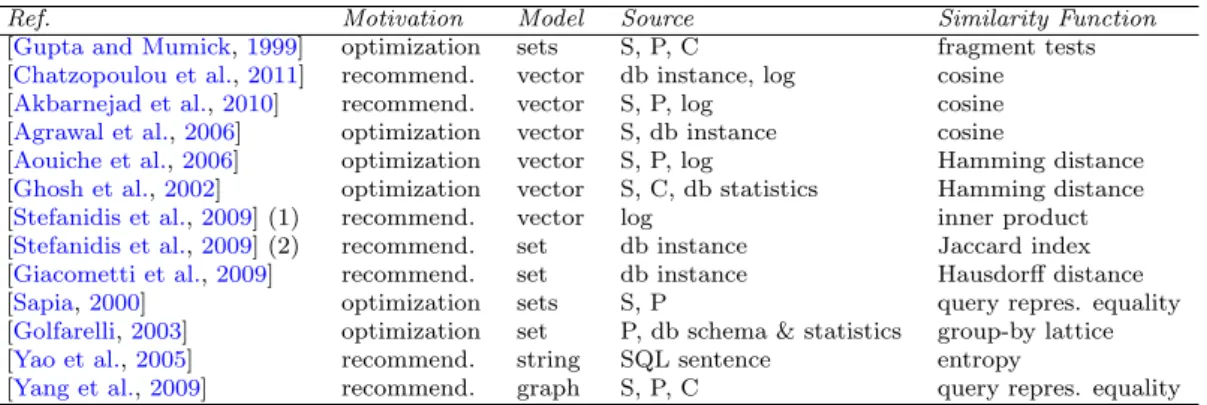
5.4 Related Works . . . 77
5.4.1 Sessions . . . 77
5.4.2 Queries . . . 79
5.5 Query Similarity . . . 82
5.6 Session Similarity. . . 85
5.6.1 Edit-Based Session Similarity . . . 85
5.6.2 Subsequence-Based Session Similarity . . . 86
5.6.3 Log-Based Session Similarity . . . 86
5.6.4 Alignment-Based Session Similarity . . . 89
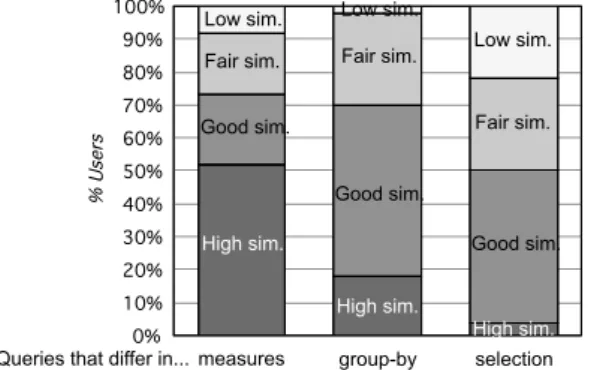
5.7 Validation . . . 93
5.7.1 User Tests. . . 93
5.7.2 Objective Tests . . . 96
5.8 Conclusions . . . 99
6 Agile Data Warehouse Design 101 6.1 Introduction. . . 101
6.2 Related Works . . . 102
6.3 The Motivation for 4WD . . . 103
6.3.1 From Problems to Goals . . . 103
6.3.2 From Goals to Principles . . . 105
6.3.3 From Principles to 4WD . . . 106
6.4 The 6 Features of 4WD . . . 108
6.4.1 Incrementality and Risk-Based Iteration . . . 108
6.4.2 Prototyping . . . 109
6.4.5 Formal and Light Documentation. . . 112
6.4.6 Automated Schema Transformation . . . 113
6.5 Validation . . . 114
6.6 Conclusions . . . 115
7 Project Scheduling Optimization in Agile Data Warehouse Design 117 7.1 Introduction. . . 117
7.2 Related Works . . . 119
7.3 Multi-Sprint Planning Problem . . . 121
7.3.1 Baseline Planning Optimization Model . . . 124
7.3.2 Smooth Replanning Optimization Model. . . 127
7.3.3 Implementation . . . 129
7.3.4 Validation . . . 129
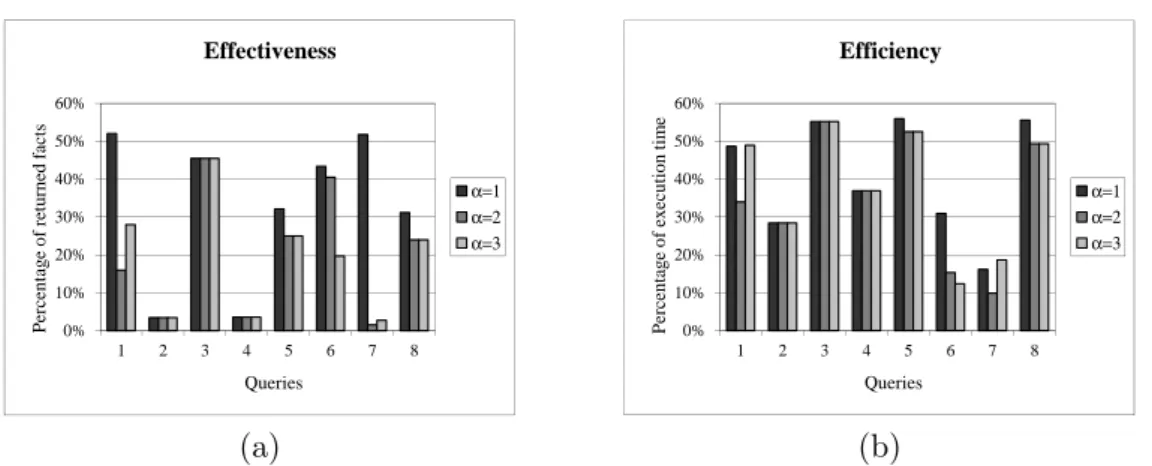
7.3.4.1 Effectiveness Tests for Baseline Planning . . . 129
7.3.4.2 Efficiency Tests for Baseline Planning . . . 134
7.3.4.3 Effectiveness Tests for Smooth Replanning . . . 135
7.3.4.4 Efficiency Tests for Smooth Replanning . . . 136
7.4 Efficient Algorithms for the Multi-Sprint Planning Problem . . . 137
7.4.1 Reductions . . . 137
7.4.1.1 Modifying the Sprint Capacities . . . 137
7.4.1.2 Modifying the Weights of Stories . . . 137
7.4.2 Cover Inequalities . . . 138
7.4.3 Dominance Inequalities . . . 138
7.4.3.1 Dominance of Type 1 . . . 138
7.4.3.2 Dominance of Type 2 . . . 138
7.4.3.3 Dominance of Type 3 . . . 139
7.4.4 Greedy and Exchange Heuristics . . . 139
7.4.5 A Lagrangian Heuristic . . . 144
7.4.6 Validation . . . 146
7.5 Conclusions . . . 152
8 Conclusions and Future Works 155
A Theorem Proofs 157
Keywords
• Business Intelligence 2.0
• Distributed Data Warehouses
• Query Reformulation
• Lean Development
• OLAP Query Personalization and Recommendation
• Agile Release Scheduling
Acknowledgements
I would like to thank my tutor Prof. Dario Maio for the supervising activity during my PhD. I would like to express my sincere gratitude to my advisors Prof. Matteo Golfarelli and Prof. Stefano Rizzi for supporting and motivating me during these three research years. They gave me the opportunity to take part in several activities that have contributed to my professional and personal growth.
Moreover, I wish acknowledge Prof. Patrick Marcel and Julien Aligon for their collabo-ration and support during my research period in France at Universit´e Fran¸cois-Rabelais Tours.
I would like to thank Prof. Marie-Aude Aufaure and Prof. Patrick Marcel for reviewing this thesis.
Finally, I wish to thank my family and my friends for believing in me during this journey, and in particular my friend Silvia who has encouraged me during this research activity with her motivation and enthusiasm.
Introduction
1.1
Business Intelligence
Traditionally, we refer to Business intelligence (BI) as the process of transforming raw data into useful information to support effective and aware business strategies; capturing the business data and getting the right information to the right people, at the right time, through the right channel, is a crucial aspect of BI often referred to as
pervasiveness.
In the last few years, a new generation of BI tools called BI 2.0 has emerged to meet the new and ambitious requirements of business users [Nelson,2010]. BI 2.0 not only introduces brand new topics, but in some cases it re-examines past challenges according to new perspectives depending on the market changes and needs. In this context, the term pervasive BI has gained increasing interest as an innovative and forward-looking perspective. Different interpretations have been proposed of this concept, mainly focused on keywords such as Personalization,Timeliness, and Integration:
• Personalization (BI to ANYONE). In this case the term pervasive is re-ferred to the capacity of BI tools to customize the result according to the user who takes advantage of it, facilitating the fruition of BI information by different type of users (e.g., front-line employees, suppliers, customers, or business part-ners). In this regard, [Markarian et al.,2007] states that “the goal of pervasive BI applications is to take the data that produced the back office Return On Invest-ment (ROI) of more than 400% and deliver it to front-line employees in a form appropriate to their job functions with similar results”. This work points out two critical aspects of the decision process: identifying and also presenting the most relevant information of the company’s trend, depending on the specific recipients. In this direction, BI information can be exploited by a wider range of people and
different perspectives of analysis can enrich the business vision as well. Typi-cally, at the core of BI architectures, aData Warehouse(DW) stores information in multidimensional form to facilitate the extraction of relevant business data. However, DW analysis is still a complex activity due to the huge quantity of data to take into account. Moreover, users might not undertake the right direction of analysis. In this scenario, user-centric BI applications could have a strategic role in driving the business analysis. For instance, the result of a user query could be personalized according to the user preferences or depending on the user context. Besides, a BI system can suggest the next query to formulate to the user, exploiting past analysis of the same user or queries of groups of analysts with similar characteristics.
• Timeliness (BI ANYTIME). Here the term pervasive is related to the timely provision of business information for decision-making. Different factors may af-fect this capacity. First of all, as shown in [The Data Warehousing Institute,
2008], one of the major shortcoming of DW solutions is the long and complex development process, that also discourages the adoption of BI tools. Typically, DW design implies heavyExtraction, Transformation, and Loading(ETL) activ-ities that delay the fruition of useful business information. Besides, the design complexity (i.e., time and cost) increases for enterprise-wide BI solutions where heterogeneity problems are more serious. The risk is to yield inadequate results with respect to needs in continuous evolution. To overcome this issue, deeper investigations on methodological aspects to make the DW development process more flexible and faster represent a promising direction. On the other hand, after the implementation of the DW, a further issue is the need to maintain fresh data to support well-informed decisions. Moreover, the integration of the DW infor-mation with structured or semi-structured data coming from additional sources (e.g., external vendors, Internet) could complete the business view (in the so-called situational BI). Since this type of information is constantly changing, its integration on-the-fly represents an added value. In this direction, a new gener-ation of BI systems providing informgener-ation on demand with near-0 latency (the so-calledreal-time BI) may deal with the market unpredictability and dynamism [Teradata,2008].
• Integration (BI ANYWHERE). In this case the term pervasive refers to the ability of BI tools to allow users to access information anywhere it can be found, by using the device they prefer. We can distinguish two different inter-pretations. In the first one, pervasiveness is related to the ability of extracting relevant information from different BI systems (i.e., BI FROM-ANYWHERE) mainly dealing with heterogeneity and security issues. This feature is particular significant in collaborative contexts (collaborative BI) where enterprises collabo-rate and share information to create new business opportunities but preserving their autonomy and independence [Lachlan,2012]. In the second interpretation,
pervasiveness is justified by the fact that the information can be analyzed with different types of devices, depending on the user and on the context of analy-sis (i.e., BI TO-ANYWHERE). In this direction, the fruition of BI information from mobile devices represents one of the major trend today, making the data access easier and faster. As a consequence, new issues on data visualization and transmission arise.
Each of the aforementioned features impacts on the concept of data trust (or data quality) which in turn strongly affects the adoption of BI tools. If the user cannot fully understand data, she cannot perceive the utility of the information provided (BI to ANYONE). At the same time, if the user cannot access data in a timely manner, she cannot have a proactive role in the market (BI ANYTIME). Finally, if the user has not the right vision of the overall business environment, described by both internal and external factors, she can hardly define effective market strategies (BI ANYWHERE). We close this vision of BI by describing the additional BI trends for 2012 as emerging from [Lachlan,2012] and [Chaudhuri et al.,2011]:
• Location Intelligence (LI): it starts from the assumption that more than 70% of the data collected by companies have a spatial topic [Yellowfin,2010]. Enrich-ing traditional business data with geographical information may lead to effective geo-targeted marketing, tactical business investments and strategic customer seg-mentation as well. It may represents the added value to capture significant pat-terns from the vast amount of data gathered by a company. In this perspective, LI may yield a competitive advantage in different contexts such as healthcare, gov-ernance, communications, and banking. For instance, the work in [Weber and Chapman, 2011] describes an innovative approach to location decision-making based on a geo-business classification of the London neighbourhood, aimed at attracting foreign investments to support economy.
• Mobile BI: it is strictly related to the concept of BI TO-ANYWHERE, referring to the fruition of business results on mobile devices. New metaphors of data visualization and real-time transmission techniques must be investigated to make the mobile experience effective. Managers can get business information wherever they are, by using a tool they are familiar with. Easier and self-service data source access is favoured. Besides, personalization techniques can reduce query results to the most significant information, decreasing the transmission time and facilitating an effective result fruition.
• Cloud BI: cloud BI is tightly related to the term BI ANYWHERE, in both perspectives. It refers to the ability of using BI platforms as a service (often calledBI as a service) where users can access information from simple web inter-faces (BI TO-ANYWHERE), while data are placed on multiple remote servers
(BI FROM-ANYWHERE). The accent is on the different types of architectures characterizing the cloud and multiple types of contract for service provision. As shown in [Baars and Kemper,2010], different cloud configurations could be ap-plied to the BI context. A simple vision implies the inclusion of additional func-tional blocks to the existing tradifunc-tional BI system in a grid approach. A more sophisticated model includes a complete mashup of DW components distributed on the web, making the access to business information easier and faster.
• Big Data: the term refers to the ability of managing increasing amount of data. As a matter of fact, the number of sources (e.g., social networks, e-mails, geo-data) storing significant business information increases year by year as the technology evolves. Besides, the quantity of data logging grows as the business activity advances. As a consequence, performance and data storage issues arise to design scalable solutions. In this regard, the MapReduce paradigm is one of the most appreciated strategies [He et al.,2011], mainly based on efficient structures for data partitioning and compressing.
• Social BI: it usesData Mining(DM) techniques to integrate business data with social information, exploiting unstructured data retrieved from e-mails, forums, and social networks, to support marketing activities such as brand reputation, topic discovery, and sentiment analysis. The company can exploit the customer opinions to have a complete vision of its own business, and also to better under-stand the market position of direct competitors.
1.2
Motivations and Contributions
According to the Gartner survey [Gartner,2012] on the major priorities of 2,335 CIOs, analytics and BI are the top-ranked technologies for 2012. This vision includes the com-bination of BI tools with different technologies to create new capabilities: standalone applications give way to integrated solutions supporting the whole supply chain; more-over, geo-information and social factors can be exploited to study customer behaviour and market trends.
A deeper investigation on BI topics is justified by the increasing complexity of the decision-making process. The growth of the information affecting the business process is faster than the evolution of tools and techniques to manage and analyze it effec-tively. The unpredictability and dynamism of the market force companies to operate under constant-pressure conditions, where a proper analysis of both their own business activity and environmental features can lead to success strategies.
Companies need significant information about the outer world, for instance about trading partners and related business areas [T.A.D. Hoang, 2009]. According to BI
ANYWHERE, cooperation is seen as a key point to improve flexibility and competi-tiveness. For example, in the health-care area, combining data coming from different hospitals allows to monitor global phenomena, for instance to prevent epidemics. In banking and insurance contexts, acquisitions and fusions have become more frequent. In this case, an exhaustive knowledge of the several factors affecting the group activities can enforce the decision-making process.
Moreover, the effectiveness of decision-making depends on the quality of information [Chaudhuri et al., 2011]. The fresher the data, the more relevant the business strate-gies. To this end, BI ANYTIME focuses on both lean DW design and real-time DW applications.
Finally, the quality of business analysis is strictly related to the capacity of users to correctly understand the data. Providing information in the right format to the right user is the goal of BI to ANYONE.
In this regard, we focus on three different aspects of pervasive BI:
• Distributed BI: we consider the concept of pervasiveness in terms of location of data to answer an OLAP query (i.e., analysts can retrieve relevant information from multiple and heterogeneous BI systems);
• OLAP Personalization and Similarity: in this case the term pervasiveness refers to the utilization of BI tools by many users characterized by different profiles (i.e., the result of an OLAP query is personalized according to the characteristics of the user who has formulated the query, leading to a better and simplified result interpretation);
• Agile Data Warehouse Design: in this last case, pervasiveness is used in terms of distribution of BI tools in the market (i.e., the aim is to reduce cost and duration of DW projects to favour the penetration of BI solutions even in small and medium firms);
1.2.1 Distributed BI
We envision a Business Intelligence Network (BIN) of heterogeneous DW systems where users can share business information, preserving their autonomy and indepen-dence. The model supports the concept of BI FROM-ANYWHERE, in the sense that we combine information coming from multiple heterogeneous sources, located in dif-ferent places, offering an innovative solution to company collaboration. The model includes a peer-to-peer network of BI systems where each node contains a specific DW with a particular multidimensional schema. The user can query her own system and receive results from every node storing relevant data for her request, by exploiting se-mantic mappings between the different schemata. The added value of this framework
is the federated structure of the net. Typically, the implementations that integrate BI systems imply the creation of a global schema for query answering, but this solution is not feasible in particular contexts where companies want to maintain their autonomy and share just limited contents. In this context, we give the following contributions:
• We design a model for the distributed DW infrastructure.
• We define a language to link heterogeneous concepts in different multidimensional schemata.
• We propose a query reformulation algorithm to propagate the user query to the multiple nodes of the network and we provide its proof of correctness.
• We discuss the main implementation issues to develop a BIN.
These issues will be discussed in Chapter 3.
1.2.2 OLAP Personalization and Similarity
The goal of personalization is to deliver information that is relevant to an individual or a group of individuals in the most appropriate format and layout. In this sense, we can use personalization to support the concept of BI to ANYONE. In the On-Line Analytical Processing (OLAP) area, personalization may be pursued using different approaches:
• Result ranking: query results are organized in a total or partial order so that the user visualizes the most relevant data first [Golfarelli et al.,2011b].
• Query contextualization: the query is enhanced by adding preference predicates that depend on the query context [Jerbi et al.,2008].
• Query recommendation: based on the current query and on the past sessions, the system suggests further queries to help users navigating the cube [Giacometti et al.,2009].
• Personalized visualization: users specify a set of constraints that are used to determine a preferred visualization [Bellatreche et al.,2005].
We investigate the first three points of the list. As toresult rankingandquery contextu-alization, we propose a proactive approach that couples aMultidimensional eXpression
MDX-based language ([Microsoft,2009]) for expressing OLAP preferences to a mining technique for automatically deriving preferences for the current query. In this regard, our main contributions are:
• We design an algorithm to mine a set of association rules that relate sets of frequent query fragments, starting from the log of past MDX queries issued by a user.
• We define a procedure that selects a subset of pertinent and effective association rules for a particular query; after that, the selected rules are translated into a preference that is used to annotate the user query.
• We discuss a set of experimental results to prove both effectiveness and efficiency of our approach.
As to query recommendation, we design different measures to assess the similarity between the current OLAP analysis and the past ones, to derive significant hints for the next user query. To this end, we compare OLAP concepts from different perspectives: queries and sessions. In particular, we give the following contributions:
• We carry out a case study to identify the requirements for OLAP similarity.
• We define different measures of similarity for queries and sessions in the OLAP context.
• We test the effectiveness of the aforementioned measures.
For a detailed investigation on OLAP personalization see Chapter 4, while for OLAP similarity refer to Chapter 5.
1.2.3 Agile Data Warehouse Design
This term refers to methodological investigations to make DW design faster and nim-bler, so as to support the concept of BI ANYTIME. First, we analyze the potential advantages arising from the application of modern software engineering methodologies (e.g., agile approaches) to a DW project; then we define an optimization model based on agile principles to support the analyst during the planning phase. The model is flexible enough to be applied in different contexts, even in data warehousing. In the following, the main contribution of this work:
• We identify the problems arising in DW development and we investigate how they can be solved by working on four qualities of the software development process (reliability, robustness, productivity, and timeliness); we also extract the main principles for an effective DW design methodology.
• Starting from the aforementioned principles, we propose an innovative method-ology, called Four-Wheel-Drive(4WD), for DW development.
• We formalize an optimization model for the planning problem, based on the maximization of the project utility perceived by the user and complying with different development constraints; the model manages project uncertainty allow-ing a smooth replannallow-ing of new or disrupted software functionalites.
• We design efficient algorithms to solve the model for complex problems.
• We evaluate the effectiveness and efficiency of the approach.
4WD is described in Chapter6, while the optimization model is presented in Chapter 7.
Background
This chapter describes the basic concepts of BI. As mentioned in chapter1, the DW is at the core of BI technologies. It stores data in a multidimensional structure to favour the extraction of relevant business information. We explain the basic DW features and the main activities for the ETL process. We also introduce the main OLAP operators to explore a DW and the typical phases of the DW life-cycle. Finally, a formalization of the multidimensional model is provided to be used as a reference in the following chapters.
2.1
Basic Concepts
Here we focus on DW characteristics and we informally illustrate the multidimensional model. The three typical DW architectures are described, as well as the main ETL procedures and OLAP operators.
2.1.1 Data Warehouse
In today’s market, the DW is the main tool to support BI in both industrial and sci-entific contexts. Informally, a DW is an optimized repository that stores information for the decision-making process. As a matter of fact, the increasing number of infor-mation a company has to take into account to find relevant business strategies implies more sophisticated solutions than operational databases, that store accounting data deriving from daily management activities. A typical workload on operational data involves queries asking information on a particular customer, the items included in a specif order, or the total daily revenue. We typically refer to the process of managing operational data asOnline Transactional Processing(OLTP). On the contrary, OLAP analyses are based on historical and analytical data. Typical OLAP queries are:
YƵĂŶƚŝƚLJ sĂůƵĞ KƉĞƌĂƚŝŽŶĂůĚĂƚĂƐŽƵƌĐĞƐ ^ĞůĞĐƚĞĚ /ŶĨŽƌŵĂƚŝŽŶ ZĞƉŽƌƚƐ ^ƚƌĂƚĞŐŝĐ ŬŶŽǁůĞĚŐĞ
Figure 2.1: Information value as a function of quantity
• Which products maximize the profit?
• What is the total revenue per product category and state?
• What is the relationship between profits gained by two different products?
• What is the revenue trend in the last three years?
The previous requests can hardly be directly formulated on traditional information systems. The integration of data from different databases is needed, and historical data must be explored as well. Figure 2.1 shows how to achieve the real business knowledge through a progressive selection and aggregation process on the operational data.
To this end, [Golfarelli and Rizzi, 2009b] proposes a set of principles for the DW process, to turn operational data into information for decision-making:
• Accessibility to users not familiar with IT and data structures.
• Integration of data based on a standard enterprise model.
• Query flexibility to maximize the advantages obtained from the existing infor-mation.
• Information conciseness allowing for target-oriented and effective analyses.
• Multidimensional representation to give users an intuitive and manageable view of information.
• Correctness and completeness of integrated data.
A DW can be defined as a collection of data that supports decision-making processes. It provides the following features [Inmon,1996]:
ƉƌŽĚƵĐƚ ƐƵďĐĂƚĞŐŽƌLJ
ĐĂƚĞŐŽƌLJ
Figure 2.2: Theproducthierarchy
• It is subject-oriented.
• It is integrated and consistent.
• It shows its evolution over time and it is not volatile.
A DW is subject-oriented because it depends on enterprise-specific concepts, such as customers, products, sales, and orders. On the contrary, operational databases hinge on many different enterprise-specific applications. Since the DW takes advantage of multiple data sources, integration and consistency are significant properties. Moreover, it stores data covering multiple years to assess the company trend across several years and to compare data of different periods.
To facilitate OLAP analyses, the DW is typically broken up into different data mart, each representing a subset or an aggregation of the data stored in the primary DW. A data mart includes a set of information pieces relevant to a specific business area, corporate department, or category of users. The data mart is composed by different
facts(e.g., orders and sales) that are the basic concepts of the multidimensional schema. Each fact is analyzed by different perspectives, called dimensions (e.g., products and stores). Each instance of a fact is called anevent (e.g., a particular order or a specific sale) and it is described by the values of a set of relevant measures(e.g., the quantity sold) that provide a quantitative description of the event. Starting from these concepts, the multidimensional data can be represented by ann-dimensionalcube, wherenis the number of dimensions. For example, the sales in a store chain can be represented in a three-dimensional space whose dimensions are products, stores, and dates as shown in Figure2.3. If more than three dimensions exist, the cube is called ahypercube. Each cell of the cube includes a value for each measure. Each dimension in the cube is associated to a hierarchy characterized by different levels of aggregation, called attributes. For instance, if we consider the dimension product (see Figure 2.2), a possible hierarchy aggregates the products (e.g., belt B) into subcategories (e.g., leather accessories) and the latter into categories (e.g., accessories).
2.1.2 Architectures
A common classification divides DW architectures in three main classes depending on the number of levels they involve.
date st o re ƋƵĂŶƚŝƚLJсϰ ƌĞǀĞŶƵĞсϮϱΨ
Figure 2.3: A three-dimensional cube modelling sales
ŽƉĞƌĂƚŝŽŶĂů ĚĂƚĂ ŵŝĚĚůĞǁĂƌĞ ƌĞƉŽƌƚŝŶŐ ƚŽŽůƐ K>WƚŽŽůƐ ƐŽƵƌĐĞůĂLJĞƌ ĚĂƚĂ ǁĂƌĞŚŽƵƐĞ ĂŶĂůLJƐŝƐ ŽƉĞƌĂƚŝŽŶĂů K>W ƚŽŽůƐ
Figure 2.4: Single-layer architecture
• Single-layer: as shown in Figure 2.4 the architecture is characterized by a mid-dleware (i.e.,data warehouse layer) representing a virtual multidimensional view of the operational data. This intermediate level redirects the user query to the operational sources (i.e.,source layer) and forwards the result to the OLAP layer (i.e., analysis layer), adapting the operational result to the multidimensional structure of the DW.
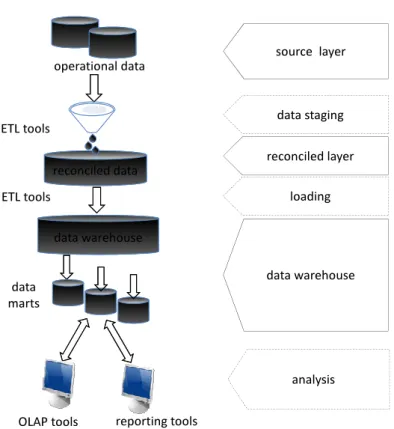
• Two-layer: in this architecture the DW layer is materialized. The DW can be represented by either a unique repository or different data marts. The data staging layer includes the ETL procedures (see Figure2.5).
• Three-layer: Figure 2.6 shows that the result of ETL procedures is materialized in thereconciled layer. The other levels are equivalent to the ones of the two-layer architecture.
ŽƉĞƌĂƚŝŽŶĂůĚĂƚĂ ƌĞƉŽƌƚŝŶŐƚŽŽůƐ K>WƚŽŽůƐ d>ƚŽŽůƐ ĚĂƚĂ ĚĂƚĂ ǁĂƌĞŚŽƵƐĞ ĚĂƚĂ ŵĂƌƚƐ ƚŽŽůƐ
ƐŽƵƌĐĞůĂLJĞƌ
ĚĂƚĂ
ǁĂƌĞŚŽƵƐĞ
ĂŶĂůLJƐŝƐ
ĚĂƚĂƐƚĂŐŝŶŐ
Figure 2.5: Two-layer architecture
ƌĞĐŽŶĐŝůĞĚĚĂƚĂ ŽƉĞƌĂƚŝŽŶĂůĚĂƚĂ ƌĞƉŽƌƚŝŶŐƚŽŽůƐ K>WƚŽŽůƐ d>ƚŽŽůƐ ĚĂƚĂǁĂƌĞŚŽƵƐĞ ĚĂƚĂ ŵĂƌƚƐ ƐŽƵƌĐĞůĂLJĞƌ ĂŶĂůLJƐŝƐ ĚĂƚĂƐƚĂŐŝŶŐ d>ƚŽŽůƐ ƌĞĐŽŶĐŝůĞĚůĂLJĞƌ ĚĂƚĂǁĂƌĞŚŽƵƐĞ ůŽĂĚŝŶŐ
2.1.3 ETL
The ETL process extracts, integrates, and cleans data from operational sources to feed the DW layer. In the following we report a brief description of the activities involved in the process, as proposed in [Golfarelli and Rizzi,2009b]:
• Extraction: includes the extraction of data from the sources. We can distinguish between static and incremental extraction. We use a static extraction when the DW needs populating for the first time; on the contrary, anincremental extraction
is used to update the DW regularly depending on the changes occurred in the operational data. Typically, a timestamp indicates when source data are changed or added.
• Cleansing: the cleansing procedures aim at improving the data quality. Typically, they are based on rectification and homogenization of the data to correct mistakes and inconsistencies:
– Duplicate data: for example, a customer is recorded many times in the client database due to multiple registrations in different stores.
– Inconsistent values that are logically associated: such as addresses and ZIP codes.
– Missing data: such as the customer’s income.
– Unexpected use of fields: such as a comment field used improperly to store the fax number.
– Impossible or wrong values: such as 2/30/2012.
– Inconsistent values for a single entity because different practises were used: such as University of Bologna rather than Univ. of Bologna. – Inconsistent values for own individual entity because of typing
mistakes: such as Oxford Steet instead of Oxford Street.
• Transformation: the source data are turned into the DW format. An integration procedure is required to manage data coming from different sources. To this end, amatchingprocedure is used to associates equivalent fields in different sources; a
selectionphase can reduce the number of source filed and records; finally, conver-sion andnormalization procedures are applied to make data uniform. Typically, in the DW context, normalization is replaced by a denormalization phase to reduce the join operations at the query time.
• Loading: it is the last step of the ETL process. It can be carried out in two ways, refresh and update: in the first case, the DW is completely rewritten; in the second one, only those changes applied to source data are added to the DW.
Figure 2.7: Roll-up operator
Figure 2.8: Drill-down operator
2.1.4 OLAP Analysis
OLAP analyses allow users to interactively navigate the DW information. Typically, the data are analyzed at different levels of aggregation, by applying subsequent OLAP operators, each yielding one or more different queries. The user can scout the multi-dimensional model choosing the next operator based on the outcome of the previous ones. In this way, the user creates a navigation path that corresponds to an analysis process for facts according to different points and at different detail levels. This is also informally called an OLAP session. In the following we describe the most common OLAP operators, referring to the cube of sales of Figure 2.3:
• Roll-up causes an increase in data aggregation and removes a detail level from a hierarchy (e.g., from product tosubcategory), as shown in Figure 2.7.
• Drill-downis the complement to the roll-up operator; it reduces data aggrega-tion and adds a new detail level to a hierarchy (e.g., fromcategorytosubcategory), as shown in Figure 2.8.
• Slice-and-dice reduces the number of cube dimensions after setting one of the dimensions to a specific value (e.g., product=’belt B’); the dicing operation re-duces the set of data being analyzed by a selection criterion (see Figure 2.9).
Figure 2.9: Slice and dice operators
• Pivot implies a change in layouts, aiming at analyzing a group of data from a different viewpoint.
• Drill-across allows to create a link between concepts in interrelated cubes, to compare them.
• Drill-through switches from multidimensional aggregate data to operational data in sources or in the reconciled layer.
2.2
Life-cycle Design
Typically, DW development relies on a bottom-up strategy that incrementally merges the different data marts the DW is composed of. As proposed in [Golfarelli and Rizzi,
2009b], data mart development is based on seven different phases:
• Analysis and reconciliation of data sources: it includes a detailed investi-gation of source schemata and a normalization phase to discover possible unex-pressed relationships; the relevant data for the current data mart are selected, and its quality is assessed as well; if multiple sources exist, an integration process is required.
• Requirement analysis: the team collects the user requirements to define the main facts of the data mart and to design the preliminary workload.
• Conceptual design: it involves the multidimensional definition of the facts characterizing the data mart; each fact is described in terms of its measures, dimensions and hierarchies, producing a fact schema; a graphical specification for the fact schema is theDimensional Fact Model (DFM).
• Workload refinement, validation of conceptual schemata: the preliminary workload is refined and the team checks that queries can be solved on the available conceptual schema, so as to validate it.
• Logical design: the team designs the logical implementation of the conceptual schema; the most common implementation is based on relational DBMSs and is called Relational OLAP(ROLAP).
• Data staging design: the design team and the users collaborate to define the updating process to populate both the reconciled layer and the data marts.
• Physical design: it involves the selection of indexes to optimize the DW per-formance.
These phases can accommodate both the classical approaches for data mart design:
data-driven and requirement-driven. In the first case, the data mart schema is de-rived from the schema of source operational databases, while user requirements help designers choose facts, dimensions, and measures. In the second case, the data mart is designed starting from user requirements.
2.3
Multidimensional Model
In this section we introduce a basic formal setting to manipulate multidimensional data, and we introduce a running example based on the CENSUS [Minnesota Population Center,2008] schema we will use in many chapters of the thesis.
Definition 2.1 (Multidimensional-Schema). A multidimensional schema (or, briefly, an md-schema) is a tripleM=hA, H, Miwhere:
• A={a1, . . . , ap}is a finite set ofattributes, each defined on a categorical domain Dom(ai);
• H ={h1, . . . , hn}is a finite set of hierarchies, each characterized by (1) a subset Attr(hi) ⊆ A of attributes (such that the Attr(hi)’s for i = 1, . . . , n define a
partition of A); (2) a roll-up total order hi of Attr(hi) and a family of roll-up
functions including a function RollU paajk :Dom(ak) →Dom(aj) for each pair of attributes ak and aj such that akhi aj;
• M ={m1, . . . , ml}is a finite set ofmeasures, each defined on a numerical domain Dom(mi) and aggregable through a set of one or more aggregation operators, Agg(mi).
For each hierarchy hi, the root attribute of the order is called dimension, denoted
State Region AllCities City Race RaceGroup MRN AllRaces Year AllYears
RESIDENCE RACE TIME
Occ AllOccs OCCUPATION Sex AllSexes SEX
Figure 2.10: Roll-up orders for the five hierarchies in the CENSUS schema (MRN
stands forMajorRacesNumber)
the bottom level is denoted by ALLi, has a single possible value and determines the
coarsest aggregation level. A pair µ=hmi, αji such that mi ∈M and αj ∈Agg(mi)
is called a metricof M.
A group-by set includes one attribute for each hierarchy, and defines a possible way to aggregate data. A coordinate of a group-by set is a point in the n-dimensional space defined by the attributes in that group-by set.
Definition 2.2 (Group-by Set). Given schema M = hA, H, Mi, let Dom(H) =
Attr(h1) ×. . . ×Attr(hn); each G ∈ Dom(H) is called a group-by set of M. Let G=hak1, . . . , akni and Dom(G) =Dom(ak1)×. . .×Dom(akn); each g∈Dom(G) is called acoordinateof G.
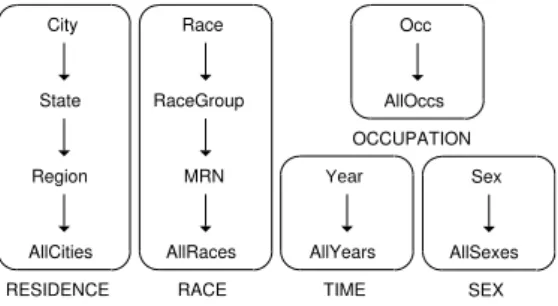
Example 2.1. The CENSUS schema includes five hierarchies, namely RACE, TIME, SEX, OCCUPATION, and RESIDENCE, and measures AvgIncome, AvgCostGas, Avg-CostWtr, and AvgCostElect. It is City RESIDENCE State (the complete roll-up orders are shown in Figure 2.10); examples of group-by sets are:
g1=hState,Race,Year,AllSex,Occi
g2=hState,RaceGroup,Year,AllSex,Occi
g3=hRegion,AllRaces,Year,Sex,Occi
A schema is populated with facts, each recording a useful information for the decision-making process. A fact is characterized by a group-by setGthat defines its aggregation level, by a coordinate of G, and by a value for one measure.
Definition 2.3 (Fact). Given schema M=hA, H, Mi, a group-by set G∈Dom(H), and a measure m ∈ M, a fact is a couple fG,m = hg, vi, where g ∈ Dom(G) and v∈Dom(m). The space of all facts for Mis
FM=
[
G∈Dom(H),m∈M
Finally, an instance of a schema (datacube) is a set of facts D⊆ FM such that no two
Distributed BI
In this chapter we describe the BIN framework to support the concept of BI FROM-ANYWHERE. The framework is aimed at manipuliting business information from dif-ferent DW tools, creating complex networks of companies chasing mutual advanteges through the sharing of BI information and functionalities. A BIN is a peer-to-peer data warehousing architecture, where each peer exposes query answering functionalities. To enhance the decision making process, an OLAP query expressed on a peer needs be properly reformulated on the local multidimensional schemata of the other nodes. To this end, we present a language for the definition of mappings between the multidi-mensional schemata of peers and we introduce a query reformulation framework that relies on the translation of mappings, queries, and multidimensional schemata onto the relational level. Then, we formalize a query reformulation algorithm and prove two properties: correctness and closure, that are essential in a peer-to-peer setting. Finally, we describe the main implementation issues to develop a BIN.
3.1
Introduction
As mentioned in Chapter 1, one of the key features for BI in 2012 is the ability to ac-cess information anywhere it can be found, by locating it through a semantic proac-cess and performing integration on the fly. This is particularly relevant in inter-business collaborative contexts where companies organize and coordinate themselves to share opportunities, respecting their own autonomy and heterogeneity but pursuing a com-mon goal. In such a complex and distributed business scenario, traditional BI systems —that were born to support stand-alone decision-making— are no longer sufficient to maximize the effectiveness of monitoring and decision making processes. Accessing local information is no more enough, users need to transparently and uniformly access information scattered across several heterogeneous BI platforms [Hoang and Nguyen,
2009].
peer i Multidimensional Engine peer N peer 1 Business Intelligence Network data warehouse OLAP Adapter Query Handler Data Handler
User Interface
semantic mappings
Figure 3.1: Envisioned architecture for a BIN
To fill this gap, we envision BIN ([Golfarelli et al.,2010, 2011a,2012a,b]), a peer-to-peer data warehousing architecture sketched in Figure3.1. A BIN is an architecture for sharing BI functionalities across a dynamic and collaborative network of heterogeneous and autonomous peers. Each peer is equipped with an independent DW system, that relies on a local multidimensional schema to represent the peer’s view of the business and exposes OLAP query answering functionalities (based for instance on the MDX language, a de-facto standard for querying multidimensional databases) aimed at shar-ing business information, in order to enhance the decision makshar-ing process and create new knowledge. The main benefits the BIN approach aims at delivering to the cor-porate world are the possibility of building new inter-organizational relationships and coordination approaches, and the ability to efficiently manage inter-company processes and safely sharing management information besides operational information.
The core idea of a BIN is that of enabling users to transparently access business infor-mation distributed over the network. A typical interaction sequence is the following:
1. A user formulates an OLAP query q by accessing the local multidimensional schema exposed by her peer, p.
2. Query q is processed locally on the DW of p. 3. At the same timeq is forwarded to the network.
4. Each involved peer locally processes the query on its DW and returns its results top.
5. The results are integrated and returned to the user.
The local multidimensional schemata of peers are typically heterogeneous; so, before a query issued on a peer can be forwarded to the network, it must be first reformulated
according to the multidimensional schemata of the destination peers. In line with the approach adopted in Peer Data Management Systems(PDMSs) [Halevy et al., 2004], query reformulation in a BIN is based onsemantic mappingsthat mediate between the
different multidimensional schemata exposed by two peers, i.e., they describe how the concepts in the multidimensional schema of one peer map onto those of another peer. Direct mappings cannot be realistically defined for all the possible couples of peers. So, to enhance information sharing, a query q issued on pis forwarded to the network by first sending it to the neighborhood of p; then, each peer in this neighborhood in turn sends q to its neighborhood, and so on. In this way, q undergoes a chain of reformulations along the peers it reaches, and results are collected from any peer that is connected to p through a path of semantic mappings.
The approach outlined above is reflected by the internal architecture of each peer, sketched in the right side of Figure 3.1, whose components are:
1. User Interface. A web-based component that manages bidirectional interaction with users, who use it to visually formulate OLAP queries on the local multidi-mensional schema and explore query results.
2. Query Handler. This component receives an OLAP query from either the user interface or a neighboring peer on the network, sends that query to the OLAP adapter to have it locally answered, reformulates it onto the neighborhood (using the available semantic mappings), and transmits it to the peers in that neighbor-hood.
3. Data Handler. When the peer is processing a query that was locally formulated, the data handler collects query results from the OLAP adapter and from the peers, integrates them, and returns them to the user interface. When the peer is processing a query that was formulated on some other peer p, the data handler just collects local query results from the OLAP adapter and returns them to p. 4. OLAP Adapter. This component adapts queries received from the query handler
to the querying interface exposed by the local multidimensional engine.
5. Multidimensional Engine. It manages the local DW according to the multidimen-sional schema representing the peer’s view of the business, and provides MDX-like query answering functionalities.
Interactions between peers are based on a message-passing protocol.
Query answering in a BIN architecture poses several research challenges, ranging from languages and models for semantic mediation to query reformulation issues and proper techniques and data structures for the query processing phase. Much work has been done on these issues in the context of PDMSs (e.g., [Mandreoli et al., 2006, 2007,
2009]) and relational databases [Penzo, 2005], however those results are not directly applicable in the OLAP scenario presented by the BIN. A more detailed explanation of the existing approaches is provided in Section 3.2.
The rest of the chapter is organized as follows:
• In Section 3.4, we present a language for the definition of semantic mappings between the schemata of peers, using predicates that are specifically tailored for the multidimensional model. To overcome possible differences in data formats, mappings can be associated with transcoding functions. Mappings are classified according to the accuracy they allow in query reformulation and a set of require-ments for the query reformulation algorithm is introduced when dealing with mapping of different accuracies.
• In Section3.5, we introduce a framework for OLAP query reformulation that re-lies on the translation of mappings and queries towards the underlying relational schemata. For simplicity, we will use standard star schemata to this end.
• In Section 3.6, we propose a query reformulation algorithm and show that it is correct for compatible reformulations, that it satisfies all the requirements, and that our language for expressing OLAP queries is closed under reformulation. Remarkably, this means that our reformulation algorithm can be safely used to implement chains of reformulations as required by the BIN setting. Besides, AppendixA gives the proofs of the theorems the algorithm is based on.
• In Section 3.7, we discuss the main implementation issues.
3.2
Related Works
In this section we discuss the related works, comparing those specifically placed in the DW context from those in the OLTP context. We focus on three different architectural approaches to share information in the two fields: warehousing, federative, and P2P approaches.
In the OLTP context, the research area sharing most similarities with warehousing approaches to the concept of BI FROM-ANYWHERE is data exchange. In data ex-change, data structured under one source schema must be restructured and translated into an instance of a different target schema, that is materialized [Fagin et al., 2003]. In this scenario, the target schema is often independently created and comes with its own constraints that have to be satisfied. On the other hand, federative approaches have their OLTP counterpart in data integration systems. Data from different sources are combined to give users a unified view [Lenzerini, 2002]; in this way, users are freed from having to locate individual sources, learn their specific interaction details, and manually combine the data [Halevy,2010]. The unified view that reconciles the sources is represented by a global schema. In this case query processing requires a reformulation step: a query over the global, target schema has to be reformulated in terms of a set of queries over the sources. Finally, P2P approaches to support BI
FROM-ANYWHERE are related to the decentralized sharing of OLTP data between autonomous sources, that has been deeply studied in the context of PDMSs. PDMSs were born as an evolution of mediator systems in the data integration field [Halevy et al., 2004] and generalize data exchange settings [Fuxman et al., 2005]. A PDMS consists of a set of peers, each with an associated schema representing its domain of interest; peer mediation is implemented by means of semantic mappings between por-tions of schemata that are local to a pair or a small set of peers. Every peer can act freely on its data, and also access data stored by other peers without having to learn their schema and even without a mediated schema [Tatarinov and Halevy, 2004]. In a PDMS there is no a priori distinction between source and target, since a peer may simultaneously act as a distributor of data (thus, a source peer) and a recipient of data (thus, a target peer). As in the case of data integration systems, in a PDMS data remain at the sources and queries processing entails query reformulation over the peer schemata. In all these contexts, modeling the relationships (mappings) between source and target schemata is a crucial aspect. Research in the data integration area has provided rich and well-understood schema mediation languages [Lenzerini, 2002] to this end. The two commonly used formalisms are the global-as-view (GAV) ap-proach, in which the mediated (global) schema is defined as a set of views over the data sources, and the local-as-view (LAV) approach, in which the contents of data sources are described as views over the mediated schema. Depending on the kind of formalism adopted, GAV or LAV, queries posed to the system are answered differently, namely by means of query unfolding or query rewriting techniques [Halevy,2001], re-spectively. In a data exchange setting, assertions between a source query and a target query are used to specify what source data should appear in the target and how. These assertions can be represented neither in the LAV nor in the GAV formalisms, but rather they can be thought of asglobal-and-local-as-viewGLAV [Fagin et al.,2003]. A structural characterization of schema mapping languages is provided in [ten Cate and Kolaitis,2010], together with a list of the basic tasks that all languages ought to support. In distributed OLTP environments, the schema mapping generation phase and the preceding schema matching phase pose new issues with reference to simpler centralized contexts: consistency problems are studied in [Cudr´e-Mauroux et al.,2006] and innovative learning techniques are presented in [Madhavan et al., 2005]. Other studies in the field have focused on integrating the computation of core solutions in the mapping generation process, aimed at determining redundancy-free mappings in data exchange settings [Fagin et al.,2005,Mecca et al.,2009]. Declaring useful map-pings in the OLAP context necessarily requires also the level of instances to be taken into account. Unfortunately, in the OLTP literature the definition of mappings is typically done at the schema level, and the problem of managing differences in data formats has only marginally been considered. A seminal paper regarding this topic is [Chang and Garcia-Molina,1999], where constraint queries are translated across het-erogeneous information sources taking into account differences in operators and data formats. A related problem is that of reconciliation of results, that takes a primary
role in federative and P2P approaches. In the OLTP context this issue is referred to as object fusion [Papakonstantinou et al., 1996]. This involves grouping together infor-mation (from the same or different sources) about the same real-world entity. In doing this fusion, the mediator may also refine the information by removing redundancies, resolving inconsistencies between sources in favor of the most reliable source, and so on.
3.2.1 Warehousing Approaches
As already mentioned, in this family of approaches the data that result from the process of integrating a set of component DWs according to a global schema are materialized. The main drawback of these approaches is that they can hardly support dynamic scenarios like those of mergers and acquisitions. An approach in this direction is the one proposed in [Torlone, 2008]. Given two dimensions belonging to different data marts where a set of mappings between corresponding levels has been manually declared or automatically inferred, three properties (namely coherence, soundness, and consistency) that enable a compatibility check between the two dimensions are defined. A technique that combines the contents of the dimensions to be integrated is then used to derive a materialized view that includes the component data marts. A hybrid approach between the warehouse and the federation approach is suggested in [Jiang et al.,2007] as a way to obtain a more flexible and applicable architecture. The idea is to aggregate selected data from the component DWs as materialized views and cache them at a federation server to improve query performance; a set of materialized query tables are recommended for the benefits of load distribution and easy maintenance of aggregated data. Another borderline approach is proposed in [Berger and Schrefl,
2008]: while fact data are not physically integrated, a central dimension repository is used to replicate dimensional data (according to a global schema) from the component DWs, aimed at increasing querying efficiency. To effectively cope with evolutions in the schema of the components, a fact algebra and a dimension algebra are used in this approach for declaring maintainable mappings between the component schemata.
3.2.2 Federative Approaches
A federated DW, sometimes also called distributed DW, is a logical integration of DWs that provides transparent access to the component DWs across the different functions of an organization. This is achieved through a global schema that represents the com-mon business model of the organization [Jindal and Acharya,2004]. Differently from warehousing approaches, the integrated data are not physically stored, so queries for-mulated on the global schema must be rewritten on the component schemata. This adds complexity to the query management framework, but enables more flexible ar-chitectures where new component DWs can be dynamically inserted. A distributed
DW architecture is outlined in [Albrecht and Lehner,1998], and a prototype named CubeStar for distributed processing of OLAP queries is introduced. CubeStar includes a middleware layer in charge of making the details of data distribution transparent to the front-end layer, by generating optimized distributed execution plans for user queries. A distributed DW architecture is considered also in [Akinde et al., 2003] as a solution for contexts where the inherently distributed nature of the data collection process and the huge amount of data extracted make the adoption of a central reposi-tory impractical. The Skalla system for distributed query processing is proposed, with particular emphasis on techniques for optimizing both local processing and commu-nication costs; however, since it is assumed that all collection points share the same schema, the approach cannot be used to cope with heterogeneous settings. In the con-text of a federated architecture, with specific reference to the healthcare domain, the work in [Banek et al., 2006,2008] presents an algorithm for matching heterogeneous multidimensional structures, possibly characterized by different granularities for data. Mappings between the local schemata of the DWs to be integrated and a given global schema are discovered in a semi-automated manner, based on a measure of similarity between complex concepts. A process to build an integrated view of a set of DWs is outlined in [Schneider, 2006]. This integrated view is defined as the largest com-mon schema to all the components, and its instances are obtained by merging the instances of the components. In [Torlone, 2008], the problem of virtual integration of heterogeneous data marts is faced in a loosely-coupled scenario where there is a need for identifying the common information (intuitively, the intersection) between the components while preserving their autonomy. A set of rules to check for dimension compatibility are declared first, then drill-across queries are used to correlate on-the-fly the component data marts. A multi DW system is introduced in [Berger and Schrefl,
2006] as one relying on a distributed architecture where users are enabled to directly access the heterogeneous schemata of the component DWs, which makes the coupling between the components looser than in federated DWs. A SQL-MDi query language is proposed to transform a cube in order to make it compatible with a global, virtual cube and ready for integration. Specific attention is devoted to solving schema and instance conflicts among the different components. An XML-based framework for sup-porting interoperability of heterogeneous DWs in a federation scenario is described in [Mangisengi et al., 2001]. In the proposed architecture, a federated layer allows for restructuring and merging local data and schemas to provide a global, single view of the component DWs to the end users. XML is used both to represent the local DW schemata, the global schema, and the mapping between them. Another XML-based approach is the one in [Tseng and Chen, 2005], that discusses the possible conflicts arising when heterogeneous DWs are integrated and proposes solutions to resolve the semantic discrepancies. Data cubes are transformed into XML documents and queried under a global view. XML topic maps are used in [Bruckner et al.,2001] to integrate the information stored in distributed DWs. The schema integration process is based on merging local topic maps to generate global topic maps, taking different types of
semantic conflicts into account. A different approach is presented in [Zhou et al.,2000], that introduces an architecture for hierarchically distributed DWs where component DWs are organized into a tree and data are progressively summarized level over level. A local OLAP query can be posed at any node of the tree, it is rewritten on remote nodes, and the results are merged.
3.2.3 Peer-to-Peer Approaches
Though federative approaches support more flexible and dynamic architectures than warehousing ones, still they do not fully preserve the autonomy of individual actors. In complex business scenarios where no leadership can be established among a set of actors interested in cooperating, to maximize the effectiveness of monitoring and de-cision making processes there is a need for truly decentralized approaches. This can be achieved by relying on P2P architectures. In [Abiteboul, 2003, Abiteboul et al.,
2005], the authors introduced the idea of using a P2P architecture for warehousing XML content. In their view, a P2P warehouse is not different from a centralized one from the logical point of view, while from the physical point of view information is distributed over a set of heterogeneous and autonomous peers rather than centralized. Because of this, query processing necessarily requires distributed computation. Among the advantages of this approach, we mention ownership (each peer has full control over its information) and dynamicity (peers can transparently enter and leave the system). How to map the local schema of each peer onto each other is one of the open problems. The approach proposed in [Miller et al.,2000] reformulates XML queries over a set of peers hosting XML databases with heterogeneous (and possibly conflicting) schemata, in the absence of a global schema. Reformulation is based on mapping rules inferred from informal schema correspondences. In [Espil and Vaisman, 2004,Vaisman et al.,
2009] the authors present a model for multidimensional data distributed across a P2P network, together with a mapping-based technique for rewriting OLAP queries over peers. In presence of conflicting dimension members, an approach based on belief re-vision is proposed to revise the instance of the source peers dimension and adapt it to the instance of the target peers dimension. Another work centered on interoperabil-ity issues among heterogeneous DWs is the one by [Kehlenbeck and Breitner, 2009], that emphasizes the importance of a semantic layer to enable communication among different components. This approach supports the exchange of business calculation definitions and allows for their automatic linking to specific component DWs through semantic reasoning. Three models are suggested: a business ontology, a DW ontology, and a mapping ontology between them. As to performance aspects, in [Kalnis et al.,
2002] the authors propose a P2P architecture for supporting OLAP queries focusing on the definition of a caching model to make the query rewriting process more effi-cient. They also define adaptive techniques that dynamically reconfigure the network structure in order to minimize the query cost. Finally, as to the data reconciliation,
a typical requirement in collaborative BI is the merging of results at different levels of aggregation. In this direction, the work proposed in [Dubois and Prade,2004] dis-cusses a general approach on the use of aggregation operations in information fusion processes and suggests practical rules to be applied in common scenarios.
3.3
Formal Background
In this section we extend Definition 2.1of multidimensional schema and Definition2.2 of group-by set. We also introduce two new concepts, transcodingandBIN query, and we describe two different multidimensional schemata we adopt as reference points in this chapter.
As concerns the multidimensional schema, we consider more complex hierarchies char-acterized by branches. To this purpose, we relax the definition of hierarchy considering a roll-up partial order hi of Attr(hi). According to the extended definition of
hi-erarchy, we can consider a group-by set including more than one attribute for each hierarchy. To this end, we overwrite the definition of group-by set by using the concept of projection.
Definition 3.1 (Projection). Given a multidimensional schema M = hA, H, Mi, a
projection of M is a subset of attributes P ⊆ A. The domain of P is Dom(P) =
×ai∈PDom(ai); each value ofDom(P) is called acoordinateofP.
We clarify the new definition of multidimensional schema and projection with a refer-ence example:
Example 3.1. A set of local health-care departments participate in a collaborative network to integrate their data about admissions so as to enable more effective analysis of epidemics and health-care costs by the Ministry. For simplicity we will focus on two peers: the first, located in Rome, hosting data on hospitalizations at the most detailed level; the second, located in Florence, hosting data on admissions grouped by patient gender, residence city, and birth year. The underlying md-schemata for Rome and Florence are called HOSPITALIZATION and ADMISSIONS, respectively; their roll-up orders are shown in Figure 3.2.
Assuming that each hierarchy is named after its finest-level attribute, but capitalized, relationships DIMPatient = patient and city Patient region hold. The HOSPITALIZA-TION md-schema includes measures cost and durationOfStay; ADMISSIONS includes measures totStayCost, totExamCost, totLength, maxLength, and numAdmissions. The
date month year week ward LHD patient city
birthDate segment gender region organ disease date month year ward unit patientCity patientNation patientBirthYear patientGender diagnosis category HOSPITALIZATION(@Rome) ADMISSIONS(@Florence)
Figure 3.2: Roll-up orders for the hierarchies in the HOSPITALIZATION and
AD-MISSIONSmultidimensional-schemata (LHD stands for local health department)
aggregation operators exposed by the two md-schemata are as follows:
Agg(cost) ={sum,avg}
Agg(durationOfStay) ={sum,avg,min,max}
Agg(totStayCost) =Agg(totExamCost) =Agg(totLength) ={sum,avg}
Agg(maxLength) ={max} Agg(numAdmissions) ={sum}
Note that the HOSPITALIZATIONmd-schema stores data at the maximum detail, so all its measures can in principle be aggregated using any operator. On the other hand, AD-MISSIONS stores pre-aggreggated data, so the (additive) measures totStayCost, totEx-amCost, and totLength can be also averaged thanks to the presence of numAdmissions, that acts as a support measure for the avg operator.
Examples of projections of HOSPITALIZATIONand ADMISSIONSareP ={week,region} and P0 ={date,patientCity}, respectively.
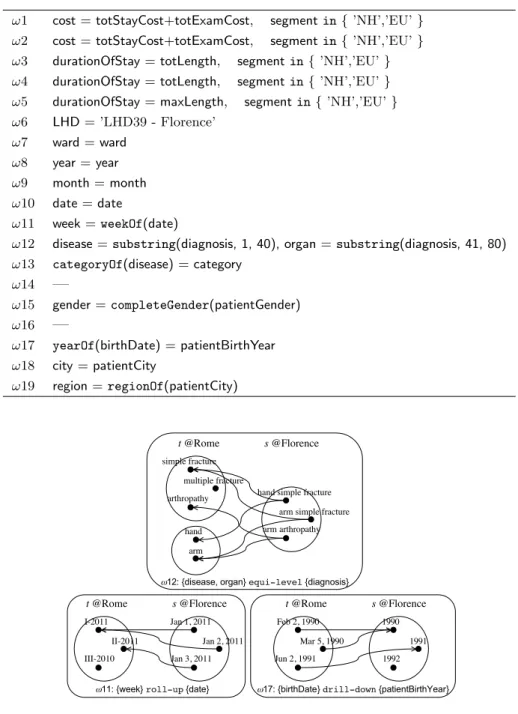
Definition 3.2 (Transcoding). Given the multidimensional schema M, let Dom be a generic domain of values. A transcoding of M is a function f :Dom(P) → Dom, where P is a projection ofM, that maps each coordinate ofP onto a value ofDom. Note thatDomcan be a compound domain (e.g., Dom=Dom(week)×Dom(region)); in this case, the transcoding is made of components, each mapping onto a simple domain.
Example 3.2. A transcoding of ADMISSIONS is f : Dom(P0) → Dom(P) whose components are week=weekOf(date),region=regionOf(patientCity), whereweekOf()
is a common SQL function and regionOf() is a user-defined function that returns the region a city belongs to by accessing a CITIES relational table stored at the Florence peer.
As concerns BIN queries, we will consider a simple form of OLAP queries character-ized by an aggregation and a selection (GPSJ - Generalized Projection / Selection /
Join query, [Gupta et al.,1995]), where transcodings can be applied to attributes and measures can appear within expressions. To avoid getting burdened with the details of a specific multidimensional query language, we will express queries using an abstract syntax.
Definition 3.3 (BIN query). A BIN queryis a 5-tuple q=hM, E, p, expr, Tiwhere:
1. M=hA, H, Miis the md-schema q is formulated on;
2. E is a generalized query group-by set, and it is a set where each element is either an attribute of Mor a component of a transcoding ofM;
3. p is an (optional) selection predicate; it is a conjunction of Boolean predicates, each involving either an attribute of Mor a component of a transcoding ofM; 4. expr is the expression computed by q; it is a numerical expression involving
measures in M;
5. T is a list of metrics of M, one for each measure used in expr, expressing the operators that will be used for aggregation.
Consistently with the behavior of the MDX language, the semantics we assume for BIN queries is that aggregation is executed first. This means that q returns an expression of aggregates (rather than an aggregation of expressions).
Example 3.3. The query
q1=hHOSPITALIZATION,
{region,year},(gender=’Female’),
cost,hhcost,sumiii
computes, at the Rome peer, the total hospitalization cost of female patients for each region and year. The query
q2 =hADMISSIONS,
{year,regionOf(patientCity)},—,
totLength,hhtotLength,avgiii
computes, at the Florence peer, the yearly average admission length for each patient region.
3.4
Mapping Language
In this section we describe the language we devised for the definition of semantic mappings between the md-schemata of peers. As mentioned in Section 3.1, these
mappings play a key role in a BIN because, as we will show in Section3.5, they enable query reformulation. After introducing a set of mapping predicates in Subsection3.4.1, in Subsection 3.4.2we informally discuss how the mapping predicates introduced can lead to query reformulations at different levels of accurateness, and we derive a set of requirements for our reformulation algorithm accordingly.
3.4.1 Mapping Predicates
We preliminarily note that, according to the PDMS terminology, data are extracted from a source peer and are mapped onto the schema of a target peer. Accordingly, we will name the peer on whose md-schema a BIN query q is originally formulated as
target peer, and the one on whose md-schemaq has to be reformulated assourcepeer.
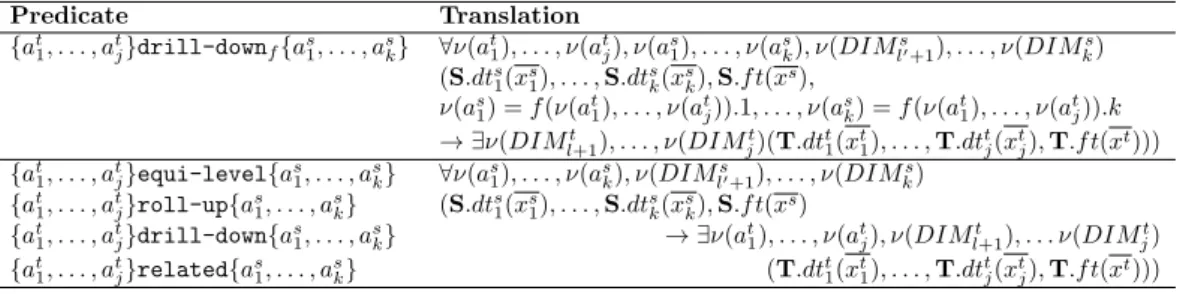
The language we propose to express how the md-schema Ms of a source peer smaps onto the md-schema Mt of a target peer t includes five mapping predicates, namely
same,equi-level,roll-up,drill-down, andrelatedthat will be discussed in detail
below. In general, a mapping establishes a semantic relationship from one or more concepts (either measures or attributes) of Ms to one or more concepts of Mt, and
enables a BIN query formulated on Mt to be reformulated on Ms. Optionally, a mapping involving attributes can be annotated with a transcoding that specifies how values of the target concepts can be obtained from values of the source concepts. If this function is available, it is used to increase the reformulation effectiveness.
• same predicate: µt sameexpr,p Ns, where µt = hmt, αti is a metric of Mt, Ns is
a subset of measures of Ms, and expr is an expression involving the measures in Ns. This mapping predicate is used to state that whenever mt is asked in a
query on Mt using αt, it can be rewritten as expr on Ms. The same mapping
predicate can be annotated with a conjunctive Boolean predicatepinvolving one or more attributes in Mt, to restrict the validity of the rewriting for metricµt.
• equi-level predicate: Pt equi-levelf Ps, where Pt and Ps are projections
of Mt and Ms, respectively. This predicate is used to state that Pt has the
same semantics and granularity as Ps. Optionally, it can be annotated with an
injective transcoding f : Dom(Ps) → Dom(Pt) that establishes a one-to-one
relation between coordinates ofPsandPt, and is used to integrate data returned
by the source and target peers.
• roll-up predicate: Pt roll-upf Ps. This predicate states that Pt is a roll-up
of (i.e., it aggregates) Ps. Optionally, it can be annotated with a non-injective
transcoding f : Dom(Ps) → Dom(Pt) that establishes a many-to-one relation
between coordinates ofPs and Pt, and is used to aggregate data returned by the