Middlesex University Research Repository
An open access repository of
Middlesex University research
http://eprints.mdx.ac.uk
Paranthaman, Vishnu Vardhan, Ghosh, Arindam, Mapp, Glenford E., Iniovosa, Victor Otite,
Shah, Purav ORCID: https://orcid.org/0000-0002-0113-5690, Nguyen, Huan X. ORCID:
https://orcid.org/0000-0002-4105-2558, Gemikonakli, Orhan ORCID:
https://orcid.org/0000-0002-0513-1128 and Rahman, Shahedur (2017) Building a prototype
VANET testbed to explore communication dynamics in highly mobile environments. Guo, Song,
Wei, Guiyi, Xiang, Yang, Lin, Xiaodong and Lorenz, Pascal, eds. Testbeds and Research
Infrastructures for the Development of Networks and Communities::11th International
Conference, TRIDENTCOM 2016, Hangzhou, China, June 14-15, 2016, Revised Selected
Papers. In: International Conference on Testbeds and Research Infrastructures (TridentCom
2016), 14-15 Jun 2016, Hangzhou, china. pbk-ISBN 9783319495798, e-ISBN 9783319495804.
ISSN 1867-8211 (doi:10.1007/978-3-319-49580-4_8)
Final accepted version (with author’s formatting)
This version is available at:
http://eprints.mdx.ac.uk/28487/
Copyright:
Middlesex University Research Repository makes the University’s research available electronically.
Copyright and moral rights to this work are retained by the author and/or other copyright owners
unless otherwise stated. The work is supplied on the understanding that any use for commercial gain
is strictly forbidden. A copy may be downloaded for personal, non-commercial, research or study
without prior permission and without charge.
Works, including theses and research projects, may not be reproduced in any format or medium, or
extensive quotations taken from them, or their content changed in any way, without first obtaining
permission in writing from the copyright holder(s). They may not be sold or exploited commercially in
any format or medium without the prior written permission of the copyright holder(s).
Full bibliographic details must be given when referring to, or quoting from full items including the
author’s name, the title of the work, publication details where relevant (place, publisher, date),
pag-ination, and for theses or dissertations the awarding institution, the degree type awarded, and the
date of the award.
Repository Team at Middlesex University via the following email address:
[email protected]
The item will be removed from the repository while any claim is being investigated.
See also repository copyright: re-use policy:
http://eprints.mdx.ac.uk/policies.html#copy
Building a Prototype VANET Testbed to
Explore Communication Dynamics in Highly
Mobile Environments
Vishnu Vardhan Paranthaman, Arindam Ghosh, Glenford Mapp, Victor Iniovosa, Purav Shah, Huan X. Nguyen, Orhan Gemikonakli, and Shahedur
Rahman
Middlesex University, Hendon, London NW4 4BT, UK,
WWW home page:http://www.vanet.mdx.ac.uk
Abstract. Applications for VANETs will require seamless communica-tion between vehicle-to-infrastructure and vehicle-to-vehicle. However, this is challenging because this is a highly mobile environment. There-fore, traditional handover techniques are inadequate due to the high velocity of the vehicle and the small coverage radius of Road-side Units. Hence in order to have seamless communication for these applications, a proactive approach needs to be carefully investigated. This requires mea-surements from a real testbed in order to enhance our understanding of the communication dynamics. This paper is about building and evaluat-ing a prototype VANET network on the Middlesex University Hendon Campus, London to explore these issues. The testbed is being used to investigate better propagation models, road-critical safety applications as well as algorithms for traffic management. In addition, the Network Dwell Time of vehicles travelling in the coverage of the RSUs is measured to explore proactive handover and resource allocation mechanisms.
Key words: Vehicular Ad hoc Network, Intelligent Transport System, propagation model, proactive handover
1 Introduction
Intelligent Transportation Systems (ITS) are a key requirement in the develop-ment of Smart Cities which will play an important part in the developdevelop-ment of sustainable living. Significant research efforts from both the automotive indus-try and academia have been underway to accelerate the deployment of a wire-less network based on dedicated short-range communications (DSRC) among moving vehicles to-Vehicle, V2V) and roadside infrastructure (Vehicle-to-Infrastructure, V2I). This network is called a Vehicular Ad Hoc Network (VANET) and is characterized by high node speed, rapidly changing topolo-gies, and short connection lifetime. VANETs allow several new applications to be available for road-safety, traffic efficiency, and infotainments (i.e., informa-tion and entertainment applicainforma-tions). VANETs are realised by the deployment
of Roadside Units (RSUs) located along the transport infrastructure and On-board Units (OBUs) in the vehicles or worn by pedestrians or cyclists [1].
In order to provide new applications which can make use of the VANET environment, it is necessary to provide seamless handover as the mobile node (MN) moves between the RSUs. In VANETs, beacons are used to signal the presence of both OBUs and RSUs. Since, beacons are broadcast, handover be-tween RSUs simply involves the hearing of beacons for different networks as the MN moves from one RSU to another [2] [3]. Traditional handover policies have been based on a reactive approach in which the MN reacts to signalling indicating changes in network connectivity as the MN moves around. However, in highly mobile environments with small cell coverage, such an approach can quickly lead to degradation of connections due to the small time there is to effect a handover [4].
Proactive handover in which the MN actively attempts to decide when and where to hand over can help to develop an efficient and reliable handover pol-icy mechanism. By using proactive handover, it is possible to minimize packet loss and service disruption as an impending handover can be signalled to the higher layers of the network protocol stack. Proactive handover has been widely investigated by the Y-Comm research group, this effort led to key parameters: time before vertical handover (TBVH), which is the time after which the han-dover should occur, and network dwell time (NDT), which is the time the MN spends in the coverage of the new network [5]. Therefore, in order to study seamless connectivity it is necessary to have realistic measurements of TBVH and NDT. Hence, we have designed and deployed a prototype VANET Testbed at the Hendon Campus of Middlesex University, London, funded by Department for Transport (DfT) to explore the potential of VANET Technology. In this, our first experimental study, we have analysed the coverage range of the VANET Testbed comprising four RSUs deployed and analysed the NDT of the MN.
The rest of the paper is structured as follows: Section 2 describes the design and implementation of the MDX VANET Testbed. Section 3 presents the cov-erage map results. Section 4 compares the actual received signal strength values with free space pathloss (FSPL) model. Section 5 looks at the NDT of the MNs from the trials conducted. Finally, Section 6 highlights some of the future work, and we conclude in Section 7.
2 Designing and Implementation of VANET Testbed
A VANET testbed has been fully deployed with four RSUs, as shown in Fig-ure 1. The RSUs and OBUs were manufactFig-ured by ARADA Systems [6] with the IEEE 802.11p (Wireless Access in Vehicular Environment: WAVE) standard specifications and the maximum output power used was 200mW or +23dBm. The challenge was to identify the best locations to mount the RSUs in order to cover most of the Hendon Campus and the surrounding roads. This involved making a detailed coverage map based on proposed locations of the RSUs. This was done by manually measuring the coverage of the deployment using an OBU,
Building a VANET Testbed 3
moving around the university roads and inside the campus. In order to deter-mine the best location for the RSU, it was important to minimise the distance between the RSU and the router elements in the university network. This en-abled us to directly backhaul data from the RSU to the central MDX VANET Server located at the basement of Sheppard library using the university net-work. Four RSUs have been deployed on top of the Hatchcroft building (latitude 51.5890742 and longitude -0.22848055), Williams building (latitude 51.5904948 and longitude -0.22859444), Sheppard library building (latitude 51.5908083 and longitude 0.22967222) and Grove building (latitude 51.5888797 and longitude -0.23071111) to cover the roads around the campus and to support the movement of pedestrians within the campus, hence enabling the development of vehicle-to-pedestrian (V2P) applications. Sheppard Building Williams Building Hatchcroft Building Grove Building OBU RSU
Fig. 1: RSU Deployment Satellite view and Live OBU Tracking
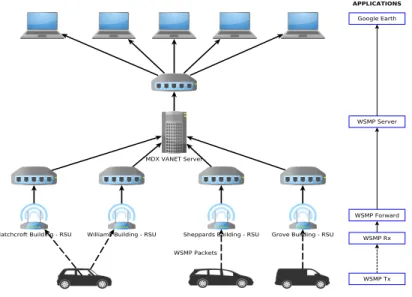
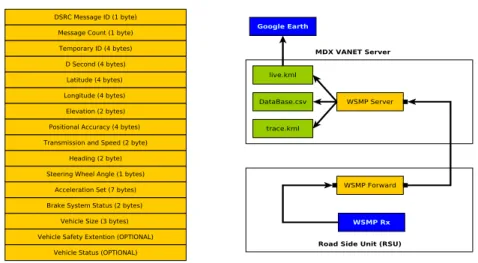
Figure 2 shows the network diagram of the MDX VANET Testbed and the applications running at the respective devices. There are different types of mes-sages used to communicate various items of information between RSUs and OBUs such as Cooperative Awareness Messages (CAMs), Basic Safety Mes-sages (BSMs), Road Side Alerts (RSAs), Intersection Collision Alerts (ICAs) and Probe Vehicle Data (PVD). Since we are interested in safety applications, the BSM message was used as the first message to be collected for analysis. BSMs were periodically broadcast from the OBU to the RSU and a BSM con-tains information regarding position, motion, time, and general status of the vehicle as shown in the Figure 3 [7]. At the present time, we are able to only use the Message ID and 3D Position i.e., Latitude, Longitude and Elevation
param-Fig. 2: Network Diagram.
eters of the BSM message. This is because all other fields such as steering wheel angle, acceleration set, brake system etc., have to be gathered from the vehicle via sensors or other mechanical devices and then added to the BSM packet and broadcast. This will be explored in the next phase of the project.
Wave Short Message Protocol (WSMP) Tx is an application used by the OBU to broadcast the BSM packets and the RSU receives these packets using WSMP Rx application. The received packets are forwarded to the server using the WSMP Forward application via an IPv6 address of the server as shown in Figure 3. The MDX VANET Server uses a WSMP Server application to receive the packets and save the data. At this stage additional information such as a timestamp and the RSUs IP address are stored along with the message received. The received data was saved in three different files: trace.kml, live.kml and Database.csv, trace.kml contains the whole trace of the GPS coordinates contained in the received packet, live.kml contains the live or current positions of each OBU through the packets received from those OBU and this file is saved in the Apache Web Server space for remote access. Using Google Earth and by adding a network link to the live.kml file, the live tracking of the OBUs was achieved. The third file Database.csv contains the most of the available information in the packets such as the OBUs MAC address, the received signal strength indicator (RSSI) value of the received packet, GPS coordinates along with the time stamp of the packet and IP address of the RSU by which the packet has been forwarded. Every day the Database.csv file was backed up for analysis through MySQL.
Building a VANET Testbed 5
Fig. 3: BSM packet format and packet forwarding from RSU to Server.
The proposed network was intended to encompass the Hendon Campus of the University and surrounding roads including the Watford Way (A41). With the successful deployment of the Testbed, the Network was then used to do a extensive trial in which OBUs were placed in volunteered vehicles and the drivers asked to drive around the area. The trial lasted for two weeks i.e., from Jan 4th to 15th Jan 2016. Around ten people with their car volunteered for the trial.
3 Coverage Map Result
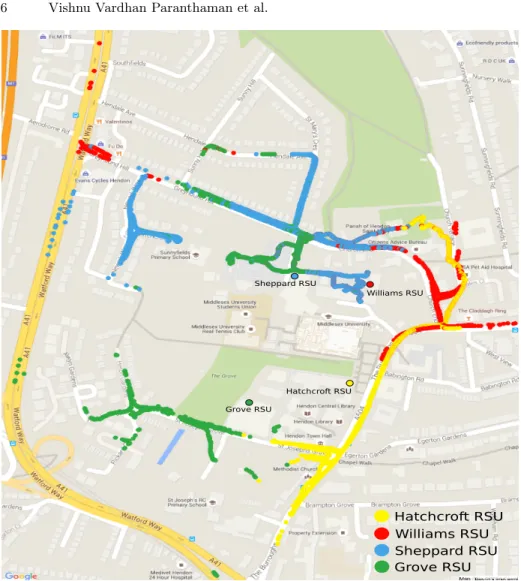
Figure 4 shows the unique GPS coordinates from the packets received by the MDX VANET Server, sent by the OBUs which were placed in the cars of the volunteers. Figure 4 displays the trial data for a 24-hour period which was col-lected on 8th January 2016 and a total of 390653 packets (around 17.14 MB) was received during that period. The coverage map shows the individual cov-erage achieved by the RSU located on each building with different colour dots. We can observe that the more coverage is achieved for the RSUs deployed at higher heights and also which have clear Line-of-Sight (LoS) in relation to the intended roads [8]. The coverage was better than anticipated but this was mainly because of the height of the RSU deployment. There are some blind spots that can be observed; these were purely due to effects of surrounding buildings. From these observations it is clear that we need more RSUs alongside the road to be deployed in an urban area. However, from our results, the deployment of RSU on high buildings and cellular masts should also be explored. The dense lines indicate very reliable communication and single spots indicate only few packets were received and hence there is no continuous communication in these regions. For example, the coverage map of RSU deployed at Grove building has almost
Hatchcroft RSU Williams RSU Sheppard RSU Grove RSU Hatchcroft RSU Williams RSU Sheppard RSU Grove RSU
Fig. 4: Coverage Map.
no coverage on the A504 due to the blockade of signal propagation because of the nearby buildings.
The farthest point from where the packets were sent by the vehicles and successfully received by the RSU was approximately 1.15 Km from the Williams Building RSU to a point on the East side of Watford way close to where the A41 and A1 divide. This was achieved purely due to the very high elevation of the RSU on the Williams Building hence allowing Line-of-Sight communication over a great distance.
Building a VANET Testbed 7
4 Pathloss Model Analysis
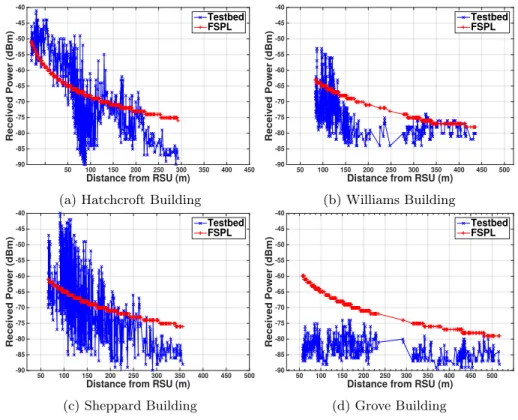
These readings are omnidirectional with respect to the RSU, so only the radius of the RSU was considered, so that better readings were due to the LoS and multi-path. For Figure 5 the detailed analysis as follows.
Distance from RSU (m)
50 100 150 200 250 300 350 400 450 Received Power (dBm) -90 -85 -80 -75 -70 -65 -60 -55 -50 -45 -40 Testbed FSPL
(a) Hatchcroft Building
Distance from RSU (m)
50 100 150 200 250 300 350 400 450 500 Received Power (dBm) -90 -85 -80 -75 -70 -65 -60 -55 -50 -45 -40 Testbed FSPL (b) Williams Building
Distance from RSU (m)
50 100 150 200 250 300 350 400 450 500 Received Power (dBm) -90 -85 -80 -75 -70 -65 -60 -55 -50 -45 -40 Testbed FSPL (c) Sheppard Building
Distance from RSU (m)
50 100 150 200 250 300 350 400 450 500 Received Power (dBm) -90 -85 -80 -75 -70 -65 -60 -55 -50 -45 -40 Testbed FSPL (d) Grove Building
Fig. 5: Power Received for each packet - Testbed vs FSPL.
Figure 5a Hatchcroft Building (yellow on the coverage map):- The readings showed that in front of the Hatchcroft Building, very good coverage was received up to 120m. However, after this the road starts to turn left towards the Church End Road resulting in less effective coverage, but as we go down the Greyhound Hill more readings are obtained.
Figure 5b Williams Building (red on the coverage map):- Here, we again see that the there is a good coverage close to the RSU, however there is a large drop due to the sharp drop in the road going down the Greyhound Hill. In comparison, more readings are obtained at the traffic lights further down the Greyhound Hill and along the Watford Way (A41).
Figure 5c Sheppard Library (blue on the coverage map):- This was the most consistent readings relative to the FSPL model. Therefore, signals closer to the
RSU generally gave very strong readings. But there is a sharp drop due to LoS issues, further away from the RSU.
Figure 5d Grove Building (green on the coverage map):- The RSU did not re-ally cover the surrounding roads as its position relative to the extended roads was blocked by surrounding buildings. Hence, most of the readings for the extended coverage were lower than the FSPL calculations. However, the RSU allowed most of the readings to be covered in an east-to-west direction.
5 Network Dwell Time Analysis
The aim of this section is to understand the communication time of the vehicle in a network coverage provided on the roads around the deployed testbed. A single car with the OBU was driven around the roads covered by the testbed. To identify the time spent in a coverage range, only the continuous spots where the packets are received with consistency were considered and the inconsistent spots was removed. Each RSU provides different segment of coverage around the testbed as detailed below:
Segment 1:From St Josephs Grove road, Grove building entrance till Citi-zens Advice Bureau in Church End Road.
Segment 2: From The Burroughs road till St Josephs Grove road, Grove building entrance gate.
Segment 3:From The Burroughs road starting at the Hatchcroft building and ending at the Greyhound Hill road (Opp. University Car park) via Church end road.
Segment 4:From the end of Sunny Hill road through St Mary’s Cres Road-ing turRoad-ing right.
Segment 5: From Citizens Advice Bureau in Church End road towards Greyhound Hill road.
Segment 6:From St Mary’s Cres (Road Opp. to Hendon car park) towards north ending on Sunny Hill road.
Segment 7:From St Mary’s Cres (Road Opp. to Hendon car park) towards north ending on Hendale Avenue road.
Segment 8:From St Josephs Grove near Grove building till Handowe close beyond the round about.
Segment 9:From St Mary’s Cres (Road Opp. to Hendon car park) towards north.
Table 1 shows the NDT, the distance travelled for that period of NDT and the average velocity of the vehicle for the identified segments. The accuracy of the results depended on two factors; the accuracy of GPS and the timestamp which was generated at the RSU and not at the OBU. Both these factors affect the results in a minimal way because most of the relevant area was elevated and hence the GPS readings are fairly accurate as they generally were not affected by the local environment. Secondly, the network was lightly loaded and hence the timestamp given by the RSU would be close to the actual transmission time of the beacon. The RSUs were deployed at very high height thus we can
Building a VANET Testbed 9
Table 1: Network Dwell Time for the coverage segments of RSU
Segment NDT Distance Average Average
(s) (m) Velocity (m/s) Velocity (km/h) Hatchcroft RSU 1 79 536.10 6.79 24.43 2 69 308.77 4.50 16.11 Williams RSU 3 69 533.34 7.73 27.83 4 19 129.81 6.83 24.60 Sheppard RSU 5 31 282.93 9.13 32.86 6 48 300.14 6.25 22.51 7 40 168.64 4.22 15.20 Grove RSU 8 42 269.40 6.41 23.10 9 61 285.53 4.70 16.80
observe good performance; if deployed along the road side on the lamp posts, then the coverage distance will be significantly reduced in an urban area. Hence, studying and obtaining a deep understanding of propagation models is required to estimate NDT for increasing the efficient utilization of resources and thereby achieving a seamless communication [9] [10].
6 Future Work
In future, the testbed will be used to explore the BSM message with all its parameters acquired from a car. This will lead to a huge accumulation of data which will be stored in the MDX Cloud System and will be analysed using Big Data algorithms. Also, visualization of the data will be a challenging area. Further more, we are also building a Mobile RSU which will allow us to move the RSU setup anywhere required for future tests. In order to backhaul the data received by the RSU, an LTE Outdoor Router will be interfaced to the RSU. Hence, the Internet will be used to forward the data to the MDX VANET Server.
7 Conclusion
This project has clearly shown that VANET technology can be used to form an Intelligent Information Platform for Smart Cities. The key issues for wide scale deployment has been explored. Hence, the evolution of this technology and its potential to transform Smart Cities need to be fully understood. Pathloss models and the effects on Network Dwell Time were investigated. Future use of
the testbed will be to explore new propagation models, algorithms of improved safety and traffic management traffic management.
8 Acknowledgement
This work is funded in part by Depart of Transport (DfT) through Transport Technology Research Innovation Grant (T-TRIG). We would also like to thank our technical support team at Middlesex University: Barry Harte, Jairam Reddy, Jamie Smith, Louis Slabbert and Simon Hinks.
References
1. Paier, A., Tresch, R., Alonso, A., Smely, D., Meckel, P., Zhou, Y., Czink, N.: Av-erage downstream performance of measured ieee 802.11p infrastructure-to-vehicle links. In: Communications Workshops (ICC), 2010 IEEE International Conference On, pp. 1–5 (2010). doi:10.1109/ICCW.2010.5503934
2. Vinel, A., Staehle, D., Turlikov, A.: Study of beaconing for car-to-car commu-nication in vehicular ad-hoc networks. In: Commucommu-nications Workshops, 2009. ICC Workshops 2009. IEEE International Conference On, pp. 1–5 (2009). doi:10.1109/ICCW.2009.5208066
3. Shafiee, K., Leung, V.C.M.: Connectivity-aware minimum-delay geographic rout-ing with vehicle trackrout-ing in {VANETs}. Ad Hoc Networks9(2), 131–141 (2011). doi:10.1016/j.adhoc.2010.06.003. Advances in Ad Hoc Networks (I)
4. Ghosh, A., Paranthaman, V., Mapp, G., Gemikonakli, O.: Exploring efficient seam-less handover in vanet systems using network dwell time. EURASIP Journal on Wireless Communications and Networking2014(1), 227 (2014)
5. Mapp, G.E., Shaikh, F., Cottingham, D., Crowcroft, J., Baliosian, J.: Y-comm: A global architecture for heterogeneous networking. In: Proceedings of the 3rd International Conference on Wireless Internet. WICON ’07, pp. 22–1225. ICST (Institute for Computer Sciences, Social-Informatics and Telecommunications En-gineering), ICST, Brussels, Belgium, Belgium (2007)
6. ARADA Systems.http://www.aradasystems.com
7. SAEInternational: DSRC Implementation Guide - A Guide to Users of SAE J2735 Message Sets over DSRC. http://www.sae.org/standardsdev/dsrc/ DSRCImplementationGuide.pdf
8. Gozalvez, J., Sepulcre, M., Bauza, R.: Ieee 802.11p vehicle to infrastructure commu-nications in urban environments. IEEE Commucommu-nications Magazine50(5), 176–183 (2012). doi:10.1109/MCOM.2012.6194400
9. Ghosh, A., Paranthaman, V.V., Mapp, G., Gemikonakli, O., Loo, J.: Enabling seamless v2i communications: toward developing cooperative automotive applica-tions in vanet systems. Communicaapplica-tions Magazine, IEEE53(12), 80–86 (2015) 10. Paranthaman, V.V., Mapp, G., Shah, P., Nguyen, H.X., Ghosh, A.: Exploring
markov models for the allocation of resources for proactive handover in a mobile environment. In: Local Computer Networks Conference Workshops (LCN Work-shops), 2015 IEEE 40th, pp. 855–861 (2015)