Florida International University
FIU Digital Commons
FIU Electronic Theses and Dissertations University Graduate School
7-16-2012
The Development of Direct Ultra-Fast PCR for
Forensic Genotyping Using Short Channel
Microfluidic Systems With Enhanced Sieving
Matrices
Maurice J. Aboud
Florida International University, [email protected]
Follow this and additional works at:http://digitalcommons.fiu.edu/etd
This work is brought to you for free and open access by the University Graduate School at FIU Digital Commons. It has been accepted for inclusion in FIU Electronic Theses and Dissertations by an authorized administrator of FIU Digital Commons. For more information, please [email protected]. Recommended Citation
Aboud, Maurice J., "The Development of Direct Ultra-Fast PCR for Forensic Genotyping Using Short Channel Microfluidic Systems With Enhanced Sieving Matrices" (2012).FIU Electronic Theses and Dissertations.Paper 715.
FLORIDA INTERNATIONAL UNIVERSITY
Miami, Florida
THE DEVELOPMENT OF DIRECT ULTRA-FAST PCR FOR FORENSIC
GENOTYPING USING SHORT CHANNEL MICROFLUIDIC SYSTEMS WITH
ENHANCED SIEVING MATRICES
A dissertation submitted in partial fulfillment of
the requirements for the degree of
DOCTOR OF PHILOSOPHY in CHEMISTRY by Maurice J. Aboud 2012
ii To: Dean Kenneth G. Furton
College of Arts and Sciences
This dissertation, written by Maurice J. Aboud, and entitled, The Development of Direct Ultra-Fast PCR For Forensic Genotyping Using Short Channel Microfluidic Systems With Enhanced Sieving Matrices, having been approved in respect to style and intellectual content, is referred to you for judgment.
We have read this dissertation and recommend that it be approved.
_______________________________________ Martin Tracey _______________________________________ Watson Lees _______________________________________ John Berry _______________________________________ John Landrum _______________________________________ Bruce McCord, Major Professor
Date of Defense: July 16, 2012
The dissertation of Maurice J. Aboud is approved.
_______________________________________ Dean Kenneth G. Furton College of Arts and Sciences
_______________________________________ Dean Lakshmi N. Reddi University Graduate School
iii
© Copyright 2012 by Maurice J. Aboud
iv DEDICATION
I would like to dedicate this dissertation to my Grandparents and Parents. Without their
patience, family values, hard work, love and unending support, the completion of this
v
ACKNOWLEDGMENTS
In life we are sometimes so anxious to reach our destination that we forget the
journey in arriving there, the years of studying and the many people whom we have
encountered along the way. I would like to take this opportunity to remember that
journey and thank everyone who motivated me along the way and imparted some little bit
of knowledge or support to keep me going.
Being successful in my academic achievements required a lot of sacrifice and
hard work but while I may be the author of this dissertation the guidance, encouragement
and prayers have allowed me to excel and achieve my full potential. I have been studying
for many years, and the writing of this dissertation has probably been one of the most
difficult challenges.
Dr. Bruce McCord, my advisor, words cannot begin to express my gratitude to
you for all you have done for me over the last few years. You have not only guided, but
inspired me to achieve at my highest level. Despite your other commitments you have
always found the time to help and always provided the missing pieces to any puzzle that I
brought.
To members of my committee Dr. Martin Tracey, Dr. Watson Lees, Dr. John
Berry and Dr. John Landrum, many thanks for your thoughtful criticisms and for your
enthusiasm for my project. Members of my research team, thanks for putting up with my
Caribbean music and wish you all a successful career. To all the members of the
Department of Chemistry and Biochemistry at FIU, thanks for everything you have done
vi
I would also like to make special acknowledgement to Dr. Marcus Gassmann,
who has been a tremendous help and support while working on this project. I would like
to thank Hye Hyun Oh and Saleem Saman who worked with me on the validation of
these techniques and development of Rapid Direct PCR. Special thanks to Stefano
Boulos and my silent supporters for your prayers and words of encouragement
My family, you have made this whole process worth it, as for Dad, thank you for
lessons on sacrifice, commitment and your constant patience with me on this journey.
Mom your constant questions have always driven me to make you proud and I will
continue to strive to always be the best at what I do. You have always believed and
encouraged me with your constant prayers. My sister Justine thanks for your constant
support and help along the way. My Godson Zane, thanks for the happiness and joy that
you have brought to the family and I am sure you will make us all proud.
A great deal of the research was made possible by the contributions of the
following people: Dr. George Duncan of the Broward’s Sheriff’s Office, Broward
County, FL for his constant support and ‘wheeling and dealing’ to get samples, reagents
and other valuable information that otherwise could not be obtained. Agilent
Technologies for their assistance and financial support through Agilent Technologies
Research Gift #2182. I would also like to thank Florida International University for the
financial support provided by the Graduate School Doctoral Evidence Acquisition
vii
ABSTRACT OF THE DISSERTATION
THE DEVELOPMENT OF DIRECT ULTRA-FAST PCR FOR FORENSIC
GENOTYPING USING SHORT CHANNEL MICROFLUIDIC SYSTEMS WITH
ENHANCED SIEVING MATRICES
by
Maurice J. Aboud
Florida International University, 2012
Miami, Florida
Professor Bruce R. McCord, Major Professor
There are situations in which it is very important to quickly and positively
identify an individual. Examples include suspects detained in the neighborhood of a
bombing or terrorist incident, individuals detained attempting to enter or leave the
country, and victims of mass disasters. Systems utilized for these purposes must be fast,
portable, and easy to maintain. The goal of this project was to develop an ultra fast, direct
PCR method for forensic genotyping of oral swabs.
The procedure developed eliminates the need for cellular digestion and extraction
of the sample by performing those steps in the PCR tube itself. Then, special high-speed
polymerases are added which are capable of amplifying a newly developed 7 loci
multiplex in under 16 minutes. Following the amplification, a postage stamp sized
microfluidic device equipped with specially designed entangled polymer separation
matrix, yields a complete genotype in 80 seconds. The entire process is rapid and reliable,
reducing the time from sample to genotype from 1-2 days to under 20 minutes. Operation
viii
thermal-cycler, reagents, and a microfluidic device with a laptop. The system was
optimized and validated using a number of test parameters and a small test population.
The overall precision was better than 0.17 bp and provided a power of discrimination
greater than 1 in 106.
The small footprint, and ease of use will permit this system to be an effective tool
to quickly screen and identify individuals detained at ports of entry, police stations and
remote locations. The system is robust, portable and demonstrates to the forensic
ix
TABLE OF CONTENTS
CHAPTER PAGE
CHAPTER I: FORENSIC DNA ANALYSIS ... 1
a) History & Technology ... 1
b) DNA: Its Biology ... 8
i) DNA Structure ... 9
ii) DNA Arrangement: Chromosomes, Genes and Loci ... 11
iii) DNA Marker nomenclature ... 12
iv) DNA Degradation ... 13
CHAPTER II: COLLECTION AND ISOLATION OF BIOLOGICAL EVIDENCE .. 18
a) Collection of Biological Evidence... 18
i) The Collection of Blood Evidence ... 19
ii) The Collection of Semen evidence ... 19
iii) The Collection of Salvia Evidence ... 20
iv) The Collection of Hair, Tissue, Bone, Urine and Teeth Evidence ... 21
b) Isolation (Extraction) of Biological Evidence ... 22
i) Phenol-Chloroform Isoamyl Alcohol (PCIA) ... 22
ii) Chelex Extraction ... 23
iii) FTA® Paper ... 24
iv) Solid Phase Extractions ... 25
CHAPTER III: AMPLIFICATION: POLYMERASE CHAIN REACTION ... 27
a) PCR: Basics ... 27 b) PCR Components ... 28 c) PCR Controls ... 30 d) Thermal Cycling ... 30 e) PCR inhibition ... 32 f) Real time PCR ... 33
CHAPTER IV: SHORT TANDEM REPEATS (STRs) ... 37
a) STRs: Basics ... 37
b) Allelic Ladders ... 38
c) Commercial STR kits ... 39
d) STRs: Chemical and Biological Artifacts ... 41
i) Stutter ... 41
ii) Microvariants ... 43
iii) Null Alleles ... 44
iv) Non template addition ... 45
x
CHAPTER V: STR MULTIPLEX DESIGN ... 47
a) Selection of Markers... 47
b) Primer Design ... 47
i) Primer Length ... 48
ii) Primer Melting Temperature (Tm) ... 49
iii) Primer annealing temperature (Ta) ... 50
iv) GC content ... 50
v) Primer efficiency ... 50
vi) Secondary structures ... 51
vii) Primer concentration ... 53
CHAPTER VI: ANALYSIS AND INSTRUMENTATION ... 54
a) Capillary Electrophoresis (CE)... 54
i) Sample Preparation ... 55
ii) Injection ... 55
iii) Separation ... 56
iv) Sample detection ... 62
v) Interpretation ... 63
b) Microfluidic Electrophoresis ... 64
CHAPTER VII: DEVELOPMENT OF MINI-PENTAMERIC STRs FOR USE ON PORTABLE RAPID MICROFLUIDIC SYSTEMS ... 69
a) Introduction ... 69
b) Methods and Materials ... 71
i) Reference Sequences and Allele Range Information ... 71
ii) Primer Design ... 72
iii) PCR primers and other reagents ... 74
iv) Polymer Preparation ... 74
v) DNA samples ... 75
vi) Quantification of DNA samples ... 75
vii) PCR Amplification ... 76
viii) Analysis on ABI 310 (Single Capillary) Genetic Analyzer ... 77
ix) Analysis with Microfluidic Electrophoresis ... 77
c) Results & Discussion ... 79
i) Selection of STR Markers ... 79
ii) Individual amplification of Pentameric STR Loci ... 89
iii) STR Multiplex Optimization ... 92
iv) Analysis by Microfluidic Chip ... 96
d) Conclusions ... 101
CHAPTER VIII: THE DEVELOPMENT OF ENTANGLED SIEVING MATRICES FOR FORENSIC GENOTYPING ON MICROFLUIDIC SYSTEMS ... 102
a) Introduction ... 102
xi
i) Reagents and materials ... 103
ii) Preparation of polymer solutions ... 103
iii) Determination of the separation performance ... 105
iv) Viscosity Measurements ... 105
c) Results and Discussion ... 106
i) Optimization of polymer ... 109
ii) Viscosity study ... 113
iii) Effect of field strength ... 117
iv) Effect of PVP relative to HEC ... 122
v) Effect of Polymer Molecular Weight ... 124
d) Conclusion ... 125
CHAPTER IX: DEVELOPMENT OF RAPID GENOTYPING ON SHORT CHANNEL MICROFLUIDIC SYSTEMS ... 127
a) Introduction ... 127
b) Methods and material ... 129
i) DNA Samples ... 129
ii) Extraction and Quantification of DNA samples ... 129
iii) PCR amplification and Optimization ... 130
iv) Microfluidic system and electrophoresis ... 132
c) Results and Discussion ... 132
i) Development of Precise and Accurate DNA Sizing on Microchip System .... 133
ii) Reproducibility ... 138
iii) Development of MP7 ... 140
iv) Optimization of MP7 ... 141
d) Conclusions ... 149
CHAPTER X: ULTRA-FAST DIRECT PCR FOR FORENSIC GENOTYPING ... 150
a) Introduction ... 150
b) Methods and Materials ... 152
i) DNA samples ... 152
ii) Fast Thermal Cyclers ... 153
iii) Rapid Polymerases ... 155
iv) Direct Buffers ... 155
v) Rapid Direct STR PCR amplification ... 157
vi) STR Analysis ... 157
c) Results and Discussions ... 158
i) Fast Thermal Cycling ... 158
ii) Enzymes ... 159
iii) Direct amplification from paper punches ... 163
iv) Rapid Direct PCR optimization ... 167
v) Thermal cycling parameters ... 172
vi) Validation and Concordance ... 174
xii
CHAPTER XI: CONCLUSIONS ... 187
CHAPTER XII: FUTURE WORK ... 190
LIST OF REFERENCES ... 191
APPENDICES ... 207
xiii
LIST OF TABLES
TABLE PAGE
Table 1: Microchip design parameters ... 66
Table 2: Penta Markers and Primer Sequences ... 73
Table 3: Penta B mini primer sequences start and end location on the chromosome 7. ... 81
Table 4: Penta C mini primer sequences start and end location on the chromosome 9. ... 83
Table 5: Penta D mini primer sequences start and end location on the chromosome 21. 85 Table 6: Penta E2 mini primer location ... 86
Table 7: The optimization of the Primer Concentration of the mini Penta B,C,D multiplex showing the Allele peak sizes, peak heights and stutter. ... 94
Table 8: Calculation values for development of Polymer depending on concentration (w/v%) and PVP relative to HEC ratio. ... 104
Table 9: 2-Factor Doehlert Matrix model use to create 7 polymers at different concentrations (w/v%) and ratios (PVP/HEC) ... 111
Table 10: Table showing the calculated viscosities from the polymer concentration and ratios used in the Doehlert matrix model. ... 116
Table 11: Summary of peak resolution over a separation voltage range of 350-500V/cm. ... 122
Table 12: Effect of PVP relative to HEC on resolution ... 123
Table 13:Summary of resolution obtained using 720k MW HEC polymer. ... 125
Table 14: The MP7 Locus information, Primer Sequences and Allelic Range ... 131
Table 15: The Precision and Reproducibility Data for 100 runs of a 400bp DNA ladder separated on a 1.5cm channel microfluidic system in under 2minutes. ... 140
Table 16: List of Rapid Polymerases and Direct Components ... 156
Table 18: The summary of the rapid polymerase and direct buffer tests performed under rapid conditions. Cycling conditions were, 98°C for 5s, 60°C for 10s, 72°C for 10s. A total 30 cycles was completed in 14minutes. ... 162
xiv
Table 19: P1 vs. P2 amplified using MP7 cycled 30 times at 98°C for 5s, 60°C for 5s, 72°C for 10s with a total amplification time of 14mins. ... 162
Table 20: Rapid-Direct amplification of MP7, Magnesium concentration study. MP7 amplifications were performed at 98°C for 5s, 60°C for 10s, 72°C for 15s, 30 cycles with a total time of 16minutes. ... 168
Table 21: Rapid-Direct amplification of MP7, dNTPs concentration study. MP7
amplifications were performed at 98°C for 5s, 60°C for 10s, 72°C for 15s, 30 cycles with a total time of 16minutes. ... 170
Table 22: Rapid-Direct amplification of MP7, BSA concentrations study. MP7
amplifications were performed at 98°C for 5s, 60°C for 10s, 72°C for 15s, 30 cycles with a total time of 16minutes. ... 171
Table 23: The results from the RD-MP7 Sensitivity Study showing the allele peak heights at D5S818 and Penta D along with their decrease factors. Below is the graph of the peak heights versus the amount of input template DNA. ... 176
Table 24: Genotype Concordance of 18 individuals from RD-PCR compared to PP16 HS ... 183
Table 25: Summary of detectable alleles using RD-amplification on microchip ... 184
xv
LIST OF FIGURES
FIGURE PAGE
Figure 1: Schematic of the VNTR-RFPL process. DNA is extracted and digested with a restriction enzyme. After electrophoresis the fragments are transferred to a nylon membrane and a radioactive probe binds to its complimentary position. The membrane is then exposed to X-rays and visualized. If two bands align with each other then a match occurs at that marker. Adapted from How Stuff Works website. 3
Figure 2: A: The chemical structures of the 4 DNA nucleotides, adenine (A), cytosine (C), guanine (G) and thymine (T) showing the Hydrogen bonding, A-T double H-bonds and C-G triple H-H-bonds. B: The DNA sugar phosphate backbone with
attached nucleotides showing the 5’ phosphate and 3’ Hydroxyl ends. ... 10
Figure 3: The structure of cell nucleus containing chromosomes. These chromosomes contain tightly bound DNA organized into X-like structures which when unwound code for genes and other proteins. Adapted from National Human Genome Research Institute website. ... 12
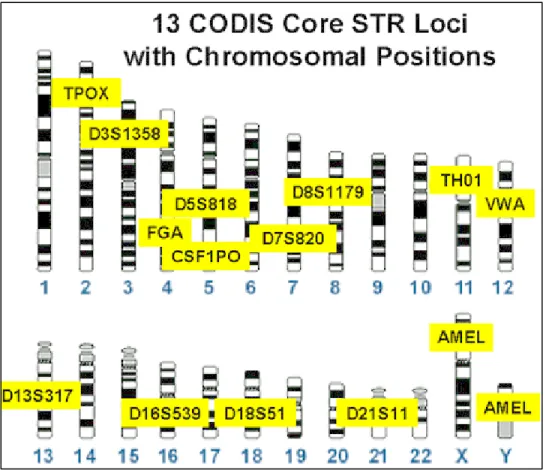
Figure 4:The chromosome location and nomenclature of the 13 core CODIS loci.17 ... 13
Figure 5: The hydrolytic loss of an amino group, which can result in translation mutations. The deamination of cytosine to uracil (above) and 5-methylctosine to thymine (below). ... 15
Figure 6: The attack of an oxidant on a DNA strand. The radial attacks the sugar residue first at the C4 position, where the nearby oxygen atom stabilizes it. The Phosphate group is ejected resulting in a positively charged radical. This radical can then react further with a different backbone DNA molecule, in the presence of water, removing yet another phosphate group. The end result is a DNA strand that is broken. ... 16
Figure 7:Formation of dimers from exposure of UV radiation. (A)
cyclobutane-pyrimidine dimer (B) Thymine-cytosine dimer. ... 17
Figure 8: DNA swabbing and collection of control or reference samples. A sterile cotton swab is opened, the inside of the suspect’s check is swabbed for 1 minute firmly, the swab is then allowed to dry and cut for the extraction process. ... 21
Figure 9: Overview of the phenol-chloroform isoamyl alcohol extraction process. Step 1; addition of proteinase K, SDS, DTT incubated at 56°C for 2-4hrs. Step 2; remove cotton swab and spin down. Step 3, add PCIA spin and remove aqueous layer into a new tube. ... 23
xvi
Figure 10: Overview of the PCR process. Denaturation takes place once the sample is heated 95°C. The addition of enzyme, dNTPs, and primers and buffer are all required for the PCR process. Primer annealing takes at a lower temperature. After the primers bind, the enzyme complex can come in and start to add new nucleotides. The overall result is a copy of that template. This process is repeated over and over until the desired amount of product is reached. ... 28
Figure 11: Ultra fast thermal cyclers from Analytik Jena and Streck technologies. The cycler pictured on the left, is the SpeedCycler2 capable of heating rates of 15°C/s and 10°C/s cooling. The Philisa cycler is shown on the right with heating rates of 15°C/s and 12°C/s cooling. ... 31
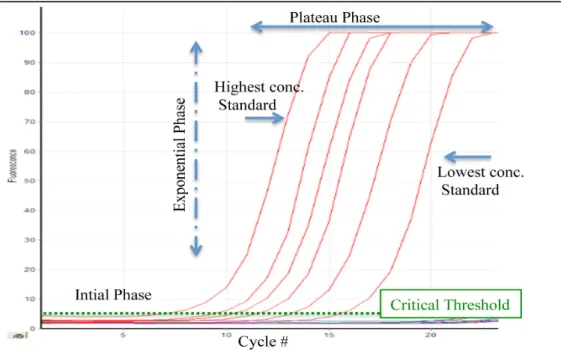
Figure 12: Real Time PCR overview. The initial phase where there is little product, the exponential phase where the amount of product is great and the plateau phase where reagents are consumed and the reaction completed. The critical threshold is the point at which the reaction goes from the initial to the exponential phase. ... 34
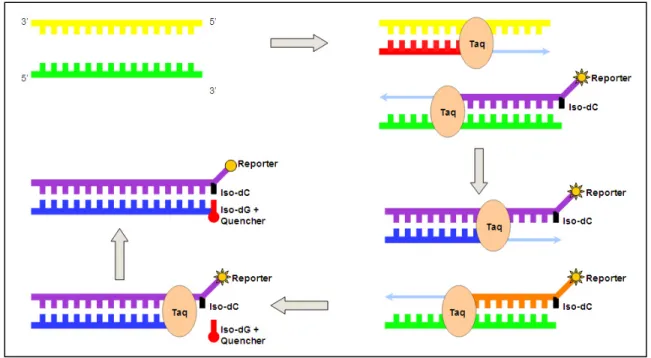
Figure 13: Overview of Plexor real time chemistry. As amplification takes place the reporter dye in quenched resulting in a decrease in fluorescence signal. The Ct values is then compared to the standards and the unknown concentration determined. Adapted from Thompson et al. ... 36
Figure 14: An electropherogram of the AmpFℓSTR® Identifiler® allelic ladder showing all allele for each locus.17 ... 39
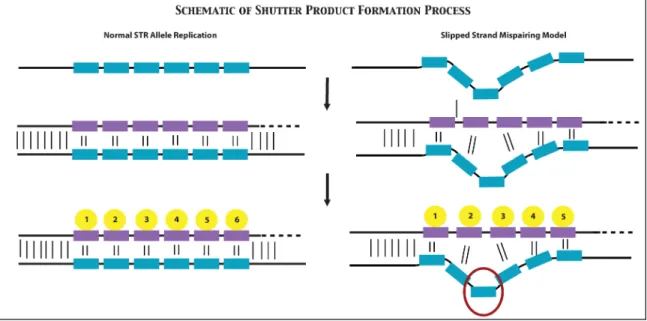
Figure 15: Schematic of the formation of stutter products during the PCR process. On the left shows a normal amplification without any stutter formation. On the right shows the slip strand model in which the primer is temporarily separated from the template. As it re-anneals it ‘slips’ resulting in a product that is one repeat short. Adapted from Walsh et al.78 ... 43
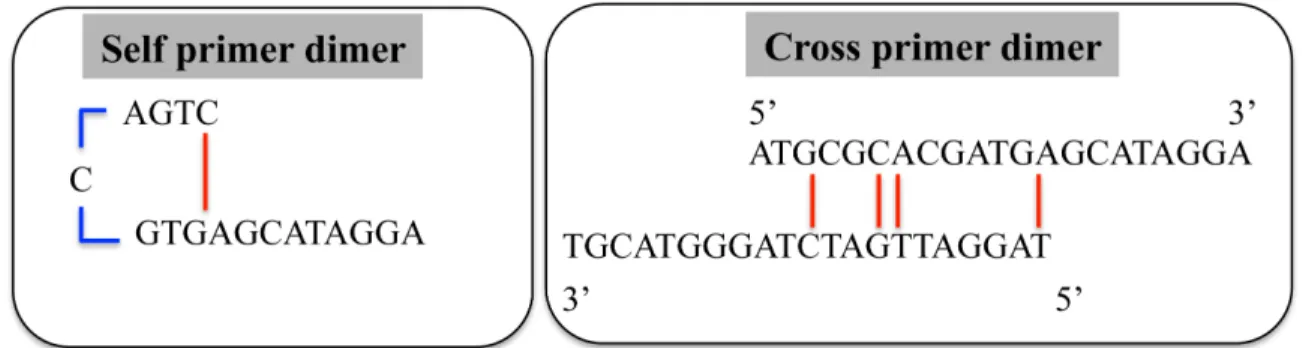
Figure 16: (Left) a primer self-dimer formed as a result of high ΔG values. (Right) a cross dimer formed between two different primers in a multiplex. ... 52
Figure 17: Diagram of fused silica capillary and the silanol groups along the wall surface. Coating of the wall surface can reduce the electroosmotic flow. ... 57
Figure 18: Chemical structures of TAPS and EDTA two major components in the buffer for separation of DNA on CE systems. ... 62
Figure 19: On the Left, a schematic of a Crossed-tee intersection most widely used in microchip designs. On the Right a Double Tee intersection design that allows for multiple rapid injections. ... 67
xvii
Figure 20: The schematic of a crossed-T microchip using a ‘pinched injection’ with pull back voltages. Once the sample is in the separation channel electrophoresis take place. The DNA is separated by size through an entangled polymer and detected using laser induced fluorescence. ... 68 Figure 21: The position of Penta B STR marker on chromosome 7. The small dots along
the top of the figure represent the position of genes (coding region) on that
chromosome. ... 80
Figure 22: The position of Penta C STR marker on chromosome 7. The small green dots along the top of the figure represent the position of genes (coding region) on that chromosome. The light blue selection (F) represents the forward primer while the red selection (R) represents the reverse primer region. ... 82
Figure 23: The position of Penta D STR marker on chromosome 21. The green lines along the top of the figure represent the position of genes (coding region) on that chromosome. The blue selection (F) represents the forward primer while the green selection (R) represents the reverse primer region. ... 84
Figure 24: The position of Penta E STR marker on chromosome 15. The new forward and reverse primer region is shown in green(F) and blue (R) respectively. ... 85
Figure 25: Primer3Plus parameter control settings for selection of primers. Primer length selection range between 18-27 bases, Primer annealing temperature of 60°C and >50 GC%. Parameters may be varied to improve primer pair matches to desired
product.89 ... 88
Figure 26: Primer 3 Plus Penta B mini primer match output view. The repeat unit is highlighted in green, forward primer in purple and reverse primer in yellow. Forward primer length 19bp, Tm 59.1°C, GC% 57.9, primer-primer score 3, self-dimer score 3. Reverse primer length 20bp, Tm 59°C, GC% 59, primer-primer score 4, self-dimer score 2.89 ... 88
Figure 27: 2% Agarose gel with ethidium bromide showing the products amplified using the mini pentameric primers. Lane 1 contains a size ladder, Lane 2 Penta B mini, Lane 3 Penta C mini, Lane 4-6 Penta E mini at different annealing temperatures, Lane 7-8 Penta D mini duplicate. ... 89
Figure 29: Graph of primer optimization showing the allelic height (RFU) vs. the final primer concentration (µM). The primer concentration with the highest peak heights and most balanced allele between all three loci can be seen at 1.5uM. Bm, Cm and Dm correspond to the respective mini-penta Markers. ... 93
Figure 30: Electropherogram from ABI 310 Genetic Analyzer of 0.5ng template K562 DNA Standard, filter set D, injection 5s @15kV and run temperature of 61°C . Blue lane (A)- Penta Bm Marker Alleles at 124.06 bp and 138.86 bp with RFU of 4393
xviii
and 3572 respectively. Green Lane (B)- Penta Cm marker alleles at 107.55 bp and 118.35 bp with RFU of 2428 and 2778 respectively Yellow lane (black, C) - Penta Dm Marker Alleles at 118.35 bp and 138.79 bp with RFU of 2586 and 2859
respectively. ... 95 Figure 31: Result from Agilent Bioanalyzer 2100 electropherogram of a K562 DNA
standard showing the penta D alleles 9 and 13 on 1.5cm separation channel length run at 350 V/cm. Top panel- Large Penta D marker with K562 standard alleles 9 &13 (20bp apart). Bottom panel - the mini-Penta D marker (Dm) with reduced amplicon sizes and improved resolution. ... 97
Figure 32: ssDNA assay showing Penta B, C and D Markers of an extracted DNA sample 29. Top- Penta Bm showings alleles at 118bp and 128bp with resolution of 2.2bp. Middle- Penta Cm showing alleles at 111bp and 121bp with resolution of 2.2bp. Bottom – Penta Dm showing alleles at 124bp and 144bp with resolution of 2.2bp. 99
Figure 33: The percent increase in resolution for the single stranded assay when
compared with the original native DNA separation. A 79%, 61% and 77% increase in resolution with the mini-Penta B, C and D markers ... 100
Figure 34: Results show the stability and reproducibility of the allele sizing over eight runs for each pentameric loci with a precision of 0.15bp. ... 100
Figure 35: Results from Agilent Bioanalyzer 2100 comparing, ABI POP-6, 3.5%
PVP/HEC custom denaturing polymer and Agilent denaturing polymer on a 1.3 cm separation channel length run at 350 V/cm. (Note that time scales (s) vary due to differences in polymer separation time) ... 108
Figure 36: The comparison of three denaturing polymers on a short channel microfluidic system. The resolution was measured across a 500bp range. ... 109
Figure 37: The figure on the left shows the range of PVP relative to HEC on the Y-axis and the range of polymer concentration (w/v%) on the X-axis used for the 2 factor Doehlert matrix. The figure on the right is a 3-dimentional representation. ... 110
Figure 38: [A] the predicted resolution for small size fragments, RS with respect to the
Polymer Ratio (Y-axis) and Polymer w/v% (X-axis). [B] The predicted resolution for large size fragments, RL with respect to the Polymer Ratio (Y-axis) and Polymer
w/v% (X-axis). ... 113
Figure 39: The response factor of viscosity over a range of polymer concentrations and ratios. The lower viscosities are observed at lower w/v % and higher ratio of PVP. The most optimum region of viscosity is between the pink/blue regions shown on the right figure. ... 115
xix
Figure 40: The effect of electric field strength to the separation of GeneScan Liz 500 size standard. An increase in resolution is observed, seen at the 490/500 bp peaks at higher voltages (330V/cm) over B, D & F. ... 118 Figure 41: The separation of a LIZ 500 standard diluted 1/5 in formamide and analyzed
on a 1.5cm Agilent 2100 microfluidic chip at 60 °C with 4 % HEC/PVP polymer. The separation was performed with electric field strength of 350 V/cm. ... 119
Figure 42: The separation of a LIZ 500 standard diluted 1/5 in formamide and analyzed on a 1.5cm Agilent 2100 microfluidic chip at 60°C with 4% HEC/PVP polymer. The separation was performed with field strength of 400 V/cm. ... 120
Figure 43: The separation of a LIZ 500 standard diluted 1/5 in formamide and analyzed on a 1.5cm Agilent 2100 microfluidic chip at 60°C with 4% HEC/PVP polymer. The separation was performed with field strength of 450 V/cm. ... 120
Figure 44: The separation of a LIZ 500 standard diluted 1/5 in formamide and analyzed on a 1.5cm Agilent 2100 microfluidic chip at 60°C with 4% HEC/PVP polymer. The separation was performed with field strength of 500 V/cm. ... 121
Figure 45: The 139/150bp and the 490/500bp peak resolution versus the separation voltage. ... 122
Figure 46: Electropherogram showing the separation of Liz 500 on the ABI 310 Genetic Analyzer using 720K MW HEC. A small increase in resolution can be seen from the figure above (50:50) PVP:HEC to the figure below (80:20). ... 125
Figure 47: MP7 a single lane multiplex designed for rapid microchip electrophoresis. The multiplex contains 6 STR markers in the yellow lane and amelogenin a sex
determining marker in the red lane. ... 131
Figure 48: Electropherogram showing the use of an internal size standard (CC5 ILS500) for increase precision in sizing of a 400bp ladder. A) The raw data showing both the CC5-ILS and TMR-labeled 400bp Ladder. B) The decomposed signals of each dye. C) The CC5-ILS 500-size standard with the sized fragments. D) The TMR-labeled MapMarker 400bp ladder with sized fragments. Runs were performed using
conditions described in the methods section. ... 135
Figure 49: Graph showing the relation between the separation DNA fragment size against the actual fragment size in basepairs. The correlation between the experimental and actual data is shown with a R2 value of 0.99. The runs were performed with a
separation voltage of 350V/cm with total run time of under 2minutes. ... 137
Figure 50: The maximum deviation from the calculated size to the actual size observed during the separation of a 400bp MapMarker® ladder on a 1.5cm separation channel microfluidic system. The average deviation is less than 0.3bp. The runs were
xx
performed with a separation voltage of 350V/cm with total run time of under
2minutes. ... 138 Figure 51: Electropherogram showing the separation of TMR labeled MapMarker® 400bp
DNA ladder on a 1.5cm separation channel Bioanalyzer system. The run was performed with a 350V/cm separation voltage with a sample run time less than 2 minutes. ... 139
Figure 52: The optimization of [Mg2+] at each locus ranging from 2mM to 10mM run in
triplicates. The peak height ratios were calculated from the height of allele 1 versus that of allele 2 at each locus. The optimum value of magnesium ion was determined to be between 6mM and 8mM. The highest PHR deviation was 0.08 at 10mM Penta D ... 142
Figure 53: The optimization of [dNTPs] at each locus at 200μM, 300μM and 500μM. The Peak Height Ratios calculated from triplicate runs with a maximum standard
deviation of 0.08. The optimum value of dNTP concentration was determined to be 300μM. ... 143
Figure 54: Peak fit software used to fit the data from an electropherogram of a DNA K562 standard amplified using a PCR mix containing 8mM [Mg2+], 300μM dNTPs, 2.5U Taq using cycling condition from the method section. The chromatographic resolution was then calculated between adjacent peaks. ... 144
Figure 55: The Effect of [Mg2+] on bp resolution of a DNA standard K562 amplified using 8mM [Mg2+], 300μM dNTPs and 2.5U Taq under standard cycling conditions. The smaller size Markers D5 and D7 show similar resolution across the range of magnesium. The larger markers D16, CSF and Penta D show greater differences with 8mM being the best. Note at D13 there is no resolution calculated because the sample is homozygous at the locus. ... 144
Figure 56: Electropherogram of DNA Standard K562 amplified using MP7 under optimized conditions. The results shows a well balance inter and intra-locus amplification with sufficient resolution to resolve between a single 4bp repeat
observed at the CSF1PO locus. ... 145
Figure 57: Above: Electropherogram of extracted buccal swab sample amplified using the MP7 kit. The resulting genotype was obtained in under 80s with a power of discrimination of 1 in 1.13x10⁶. Below: Electropherogram data from the red lane of an extracted buccal swab showing the internal size standard CC5 ILS 500 and the amplification of the amelogenin a sex-determining marker. The presence of a Y allele at 112bp represents the sample being of male origin. The sample was amplified using the MP7 STR kit with 8mM [Mg2+], 300μM dNTPs, 2.5U Taq under standard cycling conditions. ... 146
xxi
Figure 58: Electropherogram of the MP7 Allelic Ladder showing the separation of all possible allele for the given markers. The largest size adjacent alleles can be clearly differentiated. The ladder was obtained from Promega Corporation and run at the standard microchip run condition of 350V/cm with a denaturing sieving matrix. The ladder run time was performed in under 80 seconds. ... 148
Figure 59: The SpeedCycler2® thermal cycler instrument shown on the left. The gold plated heated block and sample tubes shown on the right. ... 154
Figure 60: The Philisa® thermal cycler instrument shown on the right. The heating block and thin walled polypropylene pcr tubes shown on the right. ... 155
Figure 61: Electropherogram showing the comparison of the amplification of DNA standard 9948 performed in less than 14 minutes. (A) Rapid amplification using P1 (B) amplification performed with P2. The number of PCR cycles was held constant at 30 cycles and using 1ng DNA template. ... 161
Figure 62: Electropherogram showing the comparison of two direct PCR kits performed under rapid cycling conditions from an FTA punch. The top panel A shows no amplification using the Direct buffer C. Panel B shows partial amplification with three loci dropped out of the MP7 using the Direct B. Both samples were amplified using polymerase 1. ... 165
Figure 63: Results showing the amplification of MP7 using various rapid polymerases and direct buffer combinations. A show the results using rapid polymerase P3 with direct buffer A. Panel B shows the results using rapid polymerase P2 with direct buffer A. Panel C shows using rapid polymerase P1 and direct buffer A. The amplification was performed at 98°C for 5s, 60°C for 10s, 72°C for 10s and a total of 30 cycles with a total time of 14minutes. ... 166
Figure 64: The electropherograms from the optimization of MgCl2 for RD-PCR using
MP-7 in a 16-minute amplification. Starting from the top, no additional MgCl2 from
buffer concentration 8mM, 12mM and 16mM. After 8mM MgCl2 the effects of
unspecific amplification and peak balance are observed. The best overall
amplification is observed at 4mM [MgCl2]. ... 168
Figure 65:The effect of additional dNTPs on the amplification of RD-PCR using MP7. The addition of 200μM of each dNTP yielded better peak balance of larger size loci. MP7 amplifications were performed at 98°C for 5s, 60°C for 10s, 72°C for 15s, 30 cycles with a total time of 16minutes ... 169
Figure 66: Electropherogram showing the effect of the addition of BSA to the
amplification of RD-PCR. The increase of BSA leads to a higher yield and a more balance amplification across all loci. ... 171
xxii
Figure 67: The effect of enzyme concentration on the amplification of MP7 using RD-PCR. The sensitivity of the amplification is almost doubled with double the amount of enzyme. ... 172 Figure 68: Electropherogram showing the results from the sensitivity study. From the top
5ng, 2.5ng, 1.25ng and 0.625ng input DNA template (Figure 69) respectively. The peak heights of the alleles decrease by a factor of 1.5, 2.5 and 6 respectively. ... 175
Figure 69:Electropherogram showing a close up of the amplification with 0.625ng DNA template. At the smallest size locus, D5S818 the allele has a peak height of 36.09 RFU. At the largest size locus, Penta D the alleles has a peak height of 25 RFU. . 176
Figure 70: The effects of Coffee, Soda and Alcohol on the amplification directly from a FTA punch. Coffee and Alcohol shows a decrease in peak heights and increase of non-specific peaks. ... 178
Figure 71: The effect of UV radiation at various exposure time intervals from 10s to 300s. A steady decay in the sample can be seen starting at the largest size fragments to the smallest sized fragments. ... 179
Figure 72: Stability of samples on FTA paper then directly amplified using the MP7 kit at RD-PCR conditions. At 3 months samples remain stable with peak heights above 150 RFUs. At 6 months peak heights decrease average 80%. The peak height ratios remained constant. ... 180
Figure 73: The electropherogram of sample 1 using RD-amplification of the MP7 STR kit (TOP) and the PP16HS kit on an ABI 310 Genetic Analyzer (BELOW). ... 181
Figure 74: The electropherogram of sample 7 using RD-amplification of the MP7 STR kit (TOP) and the PP16HS kit on an ABI 310 Genetic Analyzer (BELOW). ... 182
xxiii
ACRONYMS AND ABBREVIATIONS
°C Degree Celsius
A Adenine
ABI Applied Biosystem by Life Technologies
BLAST Basic Local Alignment Search Tool
bp Base Pair
BSA Bovine Serum Albumin
C Cytosine
ccd Charged Couple Device
CE Capillary Electrophoresis
CGE Capillary Gel Electrophoresis
CODIS Combined DNA Index System
Ct Critical Threshold
DMSO Dimethyl sulfoxide
DNA Deoxyribonucleic acid
dNTP Deoxyribonucleotide triphosphate
dsDNA Double Stranded DNA
DTT Dithiothreitol
EDTA Ethylenediaminetetraacetic Acid
ENFSI European Network of Forensic Science Institutes
EOF Electroosmotic Flow
xxiv
G Guanine
HEC Hydroxyethyl Cellulose
I.D. Internal Diameter
ILS Internal Lane Standard
Iso-C 5-methylisocytosine
Iso-G Isoguanine
LIF Laser Induced Fluorescence
LPR Low Profile Rapid
LTDNA Low Template DNA
MgCl2 Magnesium Chloride
MW Molecular Weight
NCBI National Center for Biotechnology Information
NIST National Institute of Standards and Technology
NRC National Resource Council
PCIA Phenol- Chloroform Isoamyl
PCR Polymerase Chain Reaction
PDMS PolyDiMethylSiloxane
PHR Peak Height Ratio
PMMA PolyMethy-MethAcrylate
POP Performance Optimized Polymer
PVP Polyvinyl Pyrrolidinone
xxv
qPCR Quantative PCR
RD Rapid Direct
RD-PCR Rapid Direct PCR
RFLP Restriction Fragment Length Polymorphism
rtPCR Real-Time PCR
SDS Sodium Dodecyl Sulfate
SINE Short Interspersed Nuclear Elements
ssDNA Single Stranded DNA
STRs Short Tadem Repeats
T Thymine
Ta Primer Annealing Temperature
TAPS
3-[[1,3-dihydroxy-2-(hydroxymethyl)propan-2-yl]amino]propane-1-sulfonic acid
Taq Thermus aquaticus Polymerase
Tm Primer Melting Temperature
UV Ultra Violet Radiation
1
CHAPTER I: FORENSIC DNA ANALYSIS
a) History & Technology
Forensic science, the application of science to law, has been used from as early as
society developed a system of order. Quintilian, a Roman attorney in the year 1000 used
a bloody palm print to frame a blind man for his mother’s murder, while the Chinese
book ‘His Duan Yu’ written 1248 shows the difference between drowning and
strangulation.1 While these early accounts were seen as mere logical correlations, many
of these disciplines have advanced greatly and have become detailed scientific areas of
study. It was not until the late 1800’s that technological advances and application of
science was truly seen as a useful tool to solve crimes, and forensics as we know it today
was born. Mathiew Orfila, the scientist who developed testing for the presence of blood,
who is considered the father of toxicology, Sir Francis Galton and Sir Edward Richard
Henry who developed fingerprint classifications for identification of individuals are
among the many scientists who have laid a solid foundation for the science of forensics.1
It is important to note that in this manuscript the author places emphasis solely on the
history of forensic DNA analysis and the technological advancements relevant to its
development.
Deoxyribonucleic acid (DNA) is the genetic material that makes up human and
living organisms. The purpose of DNA is to store genetic information that codes for
biological processes. Work done by Erwin Chargaff on the composition of DNA and its
nucleotides resulted in a discovery that helped James D. Watson and Francis Crick with
2
connected in this structure, Adenine (A), Thymine (T), Cytosine (C) and Guanine (G)
were present in a ratio of 30.9: 29.4: 19.8: 19.9 respectively.2-5 The ratio meant that there
was an almost even number of A and T and also G and C in their compositions. While
Chargaff himself was unable to figure out exactly what this meant for the structure of
DNA, a visit with James D. Watson and Francis Crick at Cambridge in 1952 provided
valuable data to the two scientist, who at that time were trying to solve the structure of
deoxyribonucleic acid. The following year, Watson and Crick discovered the structure of
DNA with insight from Chargaff’s results. They found that a DNA molecule existed as a
double stranded helix made from a chain of nucleotides unlike the alpha helix that was
previously thought to be the correct structure.6
The beginning of forensic DNA analysis can be ascribed to the work done by Sir
Alec Jeffreys, a British geneticist from the University of Leicester, England. Sir Alec
discovered a set of variable regions within the human genome that were able to
differentiate between two individuals within a given population. These regions known as
Variable Number of Tandem Repeats (VNTRs) are based on the number of times a
specific sequence of DNA is repeated in tandem within the DNA.7-10 Because of the
nature of these polymorphisms and the number of length variations that can occur within
individuals, a very high power of discrimination can be achieved. These repeats were
analyzed using a method called restriction fragment length polymorphism (RFLP)
developed in the 1970’s for the detection of single base variations within humans.11 A
restriction enzyme is used to cut the DNA at a specific sequence into smaller fragments,
which are then separated by their differences in size using electrophoresis in an agarose
3
the gel strip. The fragments are then fixed to a nylon membrane which is labeled with a
radioactive (P32) probe. The probe binds to only specific regions on the fragments and
when exposed to X-rays result is a barcode like image. The image was referred to as a
“DNA fingerprint” by Sir Jeffreys, and then compared to a known sample for identity
(Figure 1).7
Figure 1: Schematic of the VNTR-RFPL process. DNA is extracted and digested with a restriction enzyme. After electrophoresis the fragments are transferred to a nylon membrane and a radioactive probe binds to its complimentary position. The membrane is then exposed to X-rays and visualized. If two bands align with each other then a match occurs at that marker. Adapted from How Stuff Works website.
In his original work Jeffreys’ used Hinf I as a restriction enzyme to digest DNA
using multi-locus VNTR probes. These multi-locus probes contain common sequences
for several different VNTR loci that contain sites of different length that could be
observed. The ending result made interpretation very difficult and complex which lead to
4
a civil immigration case in the year 1985 in England, where the paternity of a young boy
from Ghana to relatives living in England was being questioned. The results showed that
indeed the young boy was related and allowed entry into the country and reunion with his
family.10 The following year, 1986 marked the first criminal case tested using the
muti-locus RFLP/VNTR method for identification. The case involved rape and homicide of
two girls in which the only suspect at that time confessed to only one of the murders.
Police believed that the suspect was also responsible for the death of the second victim
and with no additional evidence all members of the small village were asked to submit a
DNA sample for comparison to the DNA found at the scene.12 After all the samples were
tested including the original suspect with no match, the police were confused. It was not
until a man from the village bragged about submitting a sample under a friend’s name
(Pitchfork) that the police were able to find out who the person was and his actual DNA
tested. His DNA matched to the evidence found at the crime scene. The man in this case,
Colin Pitchfork was convicted of his crime and sentence to life in prison.12
Around the same time of Sir Jeffreys and his “DNA fingerprinting” method, an
extremely important biological technique was discovered. In 1983 Kary Mullis came up
with an idea where he would use a pair of primers to encase a small region of DNA, add
polymerase and nucleotides to make an infinite number of copies. This method, known as
the Polymerase Chain Reaction (PCR), was capable of exponentially amplifying a nucleic
acid sequence and making millions of copies of the same sequence.13
The early process of performing PCR using the Klenow region of the E.coli
polymerase required that new polymerase be added after each denaturation stage because
5
polymerase isolated from bacteria found in geothermal springs, Thermus Aquaticus
(Taq), the need for adding additional polymerase was not required and the process
performed without human intervention.16 Later developments in polymerases led to a
“hot start” polymerase, which required that the enzyme be heated before it was activated.
This greatly improved the reaction specificity and efficiency by not allowing
amplification to take place at undesired temperatures.16
Unlike the RFLP/VNTR method of “DNA fingerprinting” which required large
amounts (0.5μg or greater) of intact DNA, PCR permitted the analysis of samples with
low amounts (0.5ng or less) of DNA.17 The first PCR based analysis used in forensics
was the amplification of the HLA DQα1 marker. This region of the genome codes for the
alpha subunit of the DQ protein of the major histocompatibility-complex on chromosome
6 and contains a polymorphic 242bp region that has eight or more alleles, which can be
used in human identification.18, 19 The method used to detect these variations is known as
the reverse “dot blot” method. Using the dot blot method the DNA templates are bound to
a substrate, then a complimentary, evidence or reference probe to the desired allele is
hybridized to the DNA. Following successful binding of the complimentary probe to the
DNA, reagents are added which produce a color change due to an enzyme attached to the
probe by means of the biotinylated end.20 The HLA DQα1 dot blot method was difficult
to interpret when mixtures were present, and the method had a low power of
discrimination.
To improve the power of discrimination, an additional dot blot kit was used,
known as AmpliType PM which co-amplified five additional loci. The five markers were
6
globin (HBGG), D7S8 on chromosome 7 and a group-specific component (Gc). Each
marker had a specific hybridization probe and contained 2-4 alleles.21 The combination of
these markers allowed for higher discrimination powers than the original dot blot kits.
About the same time another PCR method was established that became very
popular using a single locus VNTR marker known as D1S80. The marker amplified a
highly polymorphic 369bp to 801bp region that contained 27 alleles (each containing a
variable number of 16 base repeat units).21 The amplicons were then separated via
electrophoresis on a polyacrylamide gel. The size of the amplicon determines how fast it
moved through the polyacrylamide gel with small molecules migrating faster than larger
ones. The gel was visualized using ethidium bromide, an intercalating agent that binds to
double stranded DNA (dsDNA) under an ultra-violet light source (UV) or silver staining.
The alleles are then determined by comparison to an allelic ladder, which contains all
known alleles for a given locus. The large size of some of the D1S80 amplicons, made it
difficult to amplify degraded DNA samples. The D1S80 method was more sensitive than
some of the earlier RFLP based methods, but was not as statistically powerful even when
combined with the DQA1 polymarker.
The next most important development in forensic DNA analysis was the
identification of microsatellites or short tandem repeats (STRs). Short tandem repeats are
simple sequence repeats, which contain a core-repeating unit of between two and six
nucleotides in length.22 There are abundant numbers of STR markers in the human
genome, but only a small set of these markers were chosen as identification markers for
forensic DNA analysis. While the most typical STRs markers currently being used
7
also been used.23* STRs can be multiplexed permitting multiple loci to be simultaneously
amplified. Current commercial kits may contain up to 21 different sets of alleles on as
many chromosomes. The overall result is a very high power of discrimination (greater
than 1 in 1016) along with the added advantage of increased sensitivity and reduced
analysis time.
By the year 1992, the practice of forensic DNA analysis had become routine and
the interpretation of results were constantly being challenged in court. As a result of the
confusion, the National Research Council (NRC) was asked to form a committee on
forensic DNA to help resolve the outstanding issues in interpretation of results. As a
result, the NRC I report was issued with guidelines to be followed by all forensic
laboratories. In 1996, because of continuing issues with statistical interpretation and the
development of new technologies a second report, NRC II, was issued. The report
improved statistical methods used in data evaluation and assisted with application of
PCR-based methods.24 In order to further help standardize the markers being used and
allow for the establishment of a DNA database that was compatible nationwide, the
Federal Bureau of Investigations (FBI) coordinated a study in 1997 and developed a set
of 13 core loci for use with a computer database known as the Combined DNA Index
System (CODIS). The 13 loci were chosen based on discrimination power and quality of
the results. The loci chosen were: CSF1PO, FGA, THO1, TPOX, vWA, D3S1358,
D5S818, D7S820, D13S317, D16S539, D18S51, D21S11 and a sex determining marker
Amelogenin.17, 25 The sex-determining marker Amelogenin utilizes a 6bp difference
* Note: the use of pentameric STRs markers have additional benefits over tetrameric
8
between the X and Y sex chromosomes allowing for the identification of the sample sex,
making it a useful tool for investigators.2627 While these markers are still considered the
core loci, many commercial kits use more loci than the 13 listed above for increased
discrimination. Up to 21 different makers can be multiplexed today and more loci may be
added to CODIS in the future.28 At present there has been extensive validation of
amplification procedures for the 13 core loci and large databases have been developed.29
STR alleles today are separated using a technique called capillary gel
electrophoresis, which is much faster than agarose gel systems and achieves greater
resolution. The markers are multiplex by size and by labeling the forward primer with a
fluorescent tag at the 5’ end. Different dyes may be used to allow for simultaneous
detection depending on the instrument being used for the analysis. Most systems today
are capable of exciting and detecting a wide range of dyes. Generally dyes are excited by
a single laser and detected over a range of emission wavelengths. The most common
instruments used today for forensic STR DNA typing are the Applied Biosystems (ABI)
Genetic Analyzers. These capillary electrophoresis (CE) systems come with various
numbers of capillaries starting with the single capillary ABI 310, which has been the
standard instrument for most crime labs until recently, where the 16-capillary ABI
3130XL has become more popular for higher throughput.
b) DNA: Its Biology
Robert Hooke, an English physicist and prominent microscopist, first discovered
the cell in 1665 under a compound microscope.30 In the mid 18th century scientists,
9
were the basic unit of life and present in all-living organisms.30 Cells are responsible for
the activity, and contain the hereditary information, which can be passed on through
replication and cell division. Organism with cells containing a nucleus are called
eukaryotes. The nucleus contains DNA and other proteins organized in chromosomes,
which store the genetic information. The genetic information gives instructions for
growth, development and reproduction. The entire ensemble of information contained on
the chromosomes is known as the genome. The human species contains two copies of
each of the twenty-three chromosomes, and is referred to as a diploid system. We inherit
half our chromosomes from each one of our parents, generation to generation.31
i) DNA Structure
The structure of DNA is divided into three main nucleic acid components; a base,
a sugar and a phosphate group. The nucleotides are connected by a phosphate and sugar
backbone, which forms its basic structure. DNA contains four bases; adenine (A),
cytosine (C), guanine (G) and thymine (T) and these account for the structural variation.6
Adenine and guanine are referred to as purines a two ring structure, while cytosine and
thymine are pyrimidines containing a single ring (Figure 2). The bases are attached to the
sugar phosphate backbone such that adenine only bonds to thymine while cytosine only
bonds to guanine as shown by Watson and Crick based on Chargaff’s data. The
differences and combinations of these bases result in different coding messages that make
living organism different physically and genetically. The bases are linked together by a
phosphodiester bond between the 5’ hydroxyl of one pentose sugar to the 3’ hydroxyl of
10
Figure 2: A: The chemical structures of the 4 DNA nucleotides, adenine (A), cytosine (C), guanine (G) and thymine (T) showing the Hydrogen bonding, A-T double H-bonds and C-G triple H-bonds. B: The DNA sugar phosphate backbone with attached nucleotides showing the 5’ phosphate and 3’ Hydroxyl ends.
The two strands of DNA are held together by hydrogen bonds. Even though
hydrogen bonds are weak chemical bonds, they occur in such high numbers that the
two-stranded helix is held together strongly via hybridization. The strands run in opposite
direction one from 5’ to 3’ and the other 3’ to 5’ and bind at its complimentary base.
(Figure 2) As a result of the structure and available H-bonding sites, G-C bonds have
three H-bonds while A-T pairing only contains 2 H-bonds. The G-C bonds require more
energy to break than A-T bonds and hence plays important roles when designing primers
or target sequences to be amplified.33
11
ii) DNA Arrangement: Chromosomes, Genes and Loci
DNA is organized into tightly compact structures along with proteins known as
chromatin, which are located in the chromosome. In the human cell there are 46 different
chromosomes 23 coming from the maternal and 23 from the paternal parent. Two of
these chromosomes are sex chromosomes that determine the gender of an offspring.
Females contain two X-chromosomes and male contain one X-chromosome and one
Y-chromosome. During fertilization of the egg (haploid) with the sperm (haploid) the
zygote cell becomes diploid because of inheritance from each parent.34
When the compact DNA structure is unwound, it contains stretches of DNA
sequences that code for polypeptides or proteins. These regions known as genes, consist
of coding regions called exons and non-coding spacers called introns. Markers typically
used for human identification are found in the non-coding region or introns and do not
code for genetic variations (Figure 3).3533
The location of a gene or marker within the chromosome is known as the locus
(or loci). This terminology is used to describe the exact location of the targeted region
12
Figure 3: The structure of cell nucleus containing chromosomes. These chromosomes contain tightly bound DNA organized into X-like structures which when unwound code for genes and other proteins. Adapted from National Human Genome Research Institute website.
iii) DNA Marker nomenclature
The DNA markers are named depending on their position on the chromosome.
For example the forensic STR locus D5S818 can be described as follows; The ‘D’ stands
for DNA, the 5 refers to its location, on chromosome 5, ‘S’ indicates that it is a single
copy sequence and the 818 represents the order in which it was discovered and
characterized for that particular chromosome, hence it is the 818th marker described on
chromosome 5. The same can be said for other markers like D13S317, D16S820, D7S820
and others. If the marker falls within the coding region of a gene, such as TPOX (thyroid
peroxidase gene) or TH01 (tyrosine hydroxylase gene), it is named after that gene (Figure
4). 17
Cell
Cell Nucleus Chromosome Histones Double Stranded DNA p-arm q-arm13
Figure 4:The chromosome location and nomenclature of the 13 core CODIS loci.17
iv) DNA Degradation
The biological evidence found at crime scenes is often not in pristine condition,
exposed to extreme environmental conditions, and the DNA can be degraded causing
problems in the quality of the amplified product. The degradation of DNA can take place
by biochemical processes such as hydrolysis, oxidation and by bacterial activity or
enzymatic digestion.36 A number of environmental and external factors can also degrade
DNA such as ultraviolet light, temperature change, time, enzymes such as nucleases,
microbial bacteria and chemicals such as bleach.37 Post mortem samples are greatly
14
fragments while exonucleases removes nucleotides from the terminal end one after
another reducing the size of the overall length of the fragment.36
Hydrolysis can result in depurination and depyrimidination of nucleotides as the
glycosidic base-sugar bond is cleaved. Once the glycosidic bond is broken, a β
-elimination reaction can reduce the strand breaking at the 3’ phosphodiester bond of the
sugar. The rate of this process is greatly affected by the environmental and physiological
conditions such as pH, temperature and ionic strength. For example, a typical 800bp
DNA fragment can take about 5,000 to 10,000 years at 15°C to fully degrade.38
Pyrimidines, cytosine and thymine, are not as affected as purines by full hydrolysis
because they are more stable and less affected by pH.39 An excision repair process
quickly corrects the hydrolysis of DNA in living cells.40 The damaged site is cleaved and
DNA polymerase I and DNA ligase comes in and repairs the damage.39
Nucleotides containing secondary amino groups, such as adenine and cytosine,
can also undergo hydrolytic loss of the amino group, and be converted into uracil and
thymine which causes mis-binding and transition mutations. Cytosine and its
5-methylycytosine are especially prone to deamination even though this process occurs
very slowing under natural physiological conditions (Figure 5). DNA strands can also be
cross-linked to proteins as inter molecular bonds form between the open-ring of an abasic
15
Figure 5: The hydrolytic loss of an amino group, which can result in translation mutations. The deamination of cytosine to uracil (above) and 5-methylctosine to thymine (below).
Another common DNA degradation process occurs through oxidation. During
oxidation, reactive species such as oxygen radials (O2.-), hydroxyl radials (OH-) and
hydrogen peroxide (H2O2) can cause endogenous damage to the DNA molecule. These
radicals result from metabolic processes and attack the DNA sugar backbone. The
radical, stabilized by its proximity to an oxygen atom, reacts with the phosphoester group
at the C3 position and causes strand breakage by removal of the phosphate group. The
reaction progresses in presence of water with the radical cation causing the elimination of
16
mutations, for example, in the presence of an hydroxyl radical, adenine can bind with the
mutated base 8-oxo-7-hydroxydeoguanosine causing a mis-binding and translation
problem.
Figure 6: The attack of an oxidant on a DNA strand. The radial attacks the sugar residue first at the C4 position, where the nearby oxygen atom stabilizes it. The Phosphate group is ejected resulting in a positively charged radical. This radical can then react further with a different backbone DNA molecule, in the presence of water, removing yet another phosphate group. The end result is a DNA strand that is broken.
Ultra-Violet light causes DNA lesions that are can be mutagenic and toxic to the
cells destroying the DNA. The most common and harmful are cyclobutane-pyrimidine
dimers and 6-4 photoproducts which cause structural damage and distort the DNA
(Figure 7).40 Temperature change, freeze and thaw cycles also cause damage to the DNA
by cleavage and random breakage. Forensic DNA samples found at crime scenes are
17
degradation process affects the sample, quality of amplification and electropherogram
data.
Figure 7:Formation of dimers from exposure of UV radiation. (A) cyclobutane-pyrimidine dimer (B) Thymine-cytosine dimer.
18
CHAPTER II:COLLECTION AND ISOLATION OF BIOLOGICAL EVIDENCE
a) Collection of Biological Evidence
The collection of evidence at a crime scene should be done in such a manner to
avoid contamination and preserve its quality to ensure the best results when tested.
However, one of the most common problems encountered by forensic scientists in the
laboratory is poor collection, preservation and transport of biological evidence. With
today’s emphasis on DNA, the presence of biological evidence at a crime scene is often
the most incriminating and valuable source. Within most of the 50 states in the United
States of America, forensic scientists rarely leave the lab, and therefore, the collection of
evidence is done by police personnel, investigators or special crime units. At a crime
scene the most common types of biological evidence found are: blood, semen, saliva,
hair, teeth, tissue, bone and urine.41 These are not the only items found at a crime scene,
but account for majority of the evidence collected. There are different collection
standards that vary among departments, but there are some common protocols for the
collection and preservation of evidence. There are numerous techniques that are used by
forensic scientists, and where possible items should be left in their original state and sent
to the laboratory for the DNA collection.*42
* Note: Before any item of physical evidence is collected it must be properly
photographed and fully documented. You must also have the required search and seizure documents. After collection each item should be carefully labeled and sealed so as to establish a chain of custody.
19 i) The Collection of Blood Evidence
Blood is the most commonly biological sample found at crime scenes, and is a
major contributor to successful recovery of DNA profiles. DNA is found within the
nucleus of the white blood cells. The white blood cells are less abundant than red blood
cells, which have no nucleus and no DNA. However, most blood samples once collected
properly yield good results when DNA is extracted. A wet blood sample is collected
using a sterile swab passed over the stained area. The swab is then allowed to dry
completely before being packaged. Dry bloodstains are collected using a sterile swab
slightly moistened with distilled water. Like the wet sample it is important that the swab
be allowed to dry.
If the sample is packaged wet, it may promote the growth of mold and bacteria
and degrade the DNA within the sample. All blood samples are packaged in paper or
cardboard, but never in plastic. If the sample collected is not going to be analyzed within
a short time frame it should be refrigerated at -20°C to help preserve the DNA, or stored
on an FTA card for later analysis. A reference sample should also be collected where
possible.41, 43*
ii) The Collection of Semen Evidence
Semen is another common source of evidence that is critical especially in rape
cases. Semen is often detected as a dry crusty white stain. An alternate light source may
also be used to aid in its location because semen fluoresces under UV radiation when
* Note: In some cases it may be more important to preserve the blood splatter pattern than
20
viewed with the appropriate goggles.41, 43 In the majority of cases, semen is collected
from sexually assaulted victims and bed linens. A semen stain would be collected in the
same manner as a blood sample mentioned before. When possible the entire item
containing the semen sample should be collected and sent to the laboratory, as there may
be trace evidence present.*
iii) The Collection of Salvia Evidence
Saliva samples and buccal swab samples may often be taken as control samples.
Saliva can also be collected from items such as cigarette butts, chewing gum, soda cans,
envelopes, stamps and bite marks. A saliva stain would be collected in the same manner
as blood using a sterile swab. The sample must then be allowed to dry and packaged in a
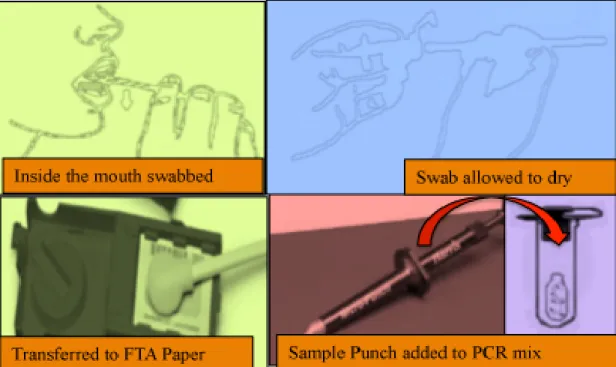
paper envelope or cardboard swab box. Buccal swabs are the most common method of
reference samples used today (Figure 8).
* Note: A rape kit should be conducted by the hospital when possible, with dialogue from
21
Figure 8: DNA swabbing and collection of control or reference samples. A sterile cotton swab is opened, the inside of the suspect’s check is swabbed for 1 minute firmly, the swab is then allowed to dry and cut for the extraction process.
iv) The Collection of Hair, Tissue, Bone, Urine and Teeth Evidence
Hair samples are often considered trace evidence but a forensic biologist may be
required to collect such a sample for DNA analysis. Hair can be found anywhere as it
may easily be transferred throughout a crime scene. Special precautions must be taken as
not to overlook and destroy hair samples. The samples should be collected with a
tweezers and placed in a druggist fold or paper envelope. Each piece of hair should be
separately packaged to avoid any cross contamination.
The use of tissue, bone, urine and teeth to provide DNA samples is more
commonly associated with identification of a victim rather than obtaining evidence from
a suspect. There are specialized fields in forensics that deal with these items of evidence,
22
samples are not as commonly used as blood and semen and will not be discussed in this
manuscript. However there are special procedures for the collection and preservation of
these types of samples, which may prove to be valuable evidence from case to case.
It is important that the evidence collected and submitted for DNA analysis is collected
and persevered in such a manner to maintain the integrity of the sample to permit
successful amplifications.
b)Isolation (Extraction) of Biological Evidence
Biological samples are often first detected using some type of presumptive test
not discussed in this manuscript. However, once identified as a possible source of DNA,
there are a few different methods used by forensic laboratories to break open the nucleus,
release and purify the DNA for downstream STR analysis.
i) Phenol-Chloroform Isoamyl Alcohol (PCIA)
The PCIA extraction is also known as organic extraction, and is one of the most
common methods used to isolate DNA from cells or samples. Many forensic laboratories,
despite newer chemistries that have been developed, still utilize this method of extraction
because of its high rate of recovery. While this method involves numerous steps and is
difficult to automate, it yields a high concentration of DNA that is relatively clean of
contaminants and inhibitors and can work on a variety of sample types. However, phenol
can be toxic and must be carefully handled and used under a hood with proper
ventilation.
The first step in a PCIA extraction is the addition of an enzyme, proteinase K, a
23
dithiothreitol (DTT). These chemicals are used to break open the cell membrane digest
and remove proteins that bind and stabilize DNA in the nucleus.* This process is often
aided by heating in a water bath at 56 °C for 2- 4 hours. After heating and lysing of the
cells, phenol, chloroform, and isoamyl alcohol are added to separate the proteins from the
DNA via a liquid/liquid extraction. Because the DNA is soluble in the aqueous phase, it
can be separated from the organic layer by centrifugation at high speed, followed by
pipetting of the aqueous layer into a new tube. The isoamyl alcohol is used to help
stabilize the chloroform and reduces foaming, leading to a clearer interphase between the
aqueous and organic phases (Figure 9).
Figure 9: Overview of the phenol-chloroform isoamyl alcohol extraction process. Step 1; addition of proteinase K, SDS, DTT incubated at 56°C for 2-4hrs. Step 2; remove cotton swab and spin down. Step 3, add PCIA spin and remove aqueous layer into a new tube.
ii) Chelex Extraction
Another method used for extraction of DNA for PCR based approaches involves
chelating resins. The method requires fewer pipetting steps and tube transfers, which
makes it faster than PCIA extractions. Chelex® 100 (Bio-Rad Laboratories) is a highly
* Proteinase K is an enzyme capable of digesting proteins. SDS, a detergent is used to aid


![Randomized clinical trial of surgery versus conservative therapy for carpal tunnel syndrome [ISRCTN84286481]](data:image/gif;base64,R0lGODlhAQABAIAAAP///wAAACH5BAEAAAAALAAAAAABAAEAAAICRAEAOw==)