Optimizing Energy Baseline for Medium Size
Office Using Hybrid EnergyPlus-Evolutionary
Programming (EP)
N. Y. Dahlan
and A. A. M. Aris
Faculty of Electrical Engineering, Universiti Teknologi MARA, 40450, Shah Alam, Selangor Darul Ehsan, Malaysia. [email protected]
Abstract—This paper presents an optimization approach of
developing building energy baseline for medium sized office using Evolutionary Programming (EP) in comparison with direct methods. This paper applies simulation-based approach by coupling Matlab and EnergyPlus to perform energy building simulation and obtain the best energy baseline configuration with minimal error. On the other hand, direct method relies on try-and-error manually key-in methods using OpenStudio EnergyPlus simulation software. The proposed method is applied to a single story Green Energy Research Centre (GERC) office building located in UiTM Shah Alam with characteristic of partially air-conditioned buildings. The office consists of 5 different size rooms with different purposes. In this regard, 3 building parameters are taken as a decision variables including occupancies, lightings and electrical equipment. The EP objective function was set to minimize the difference between simulated and monitored energy consumption. To evaluate accuracy of building energy model, hourly criteria for Normalized Mean Biased Error (NMBE) and Coefficient of Variance Root Mean Squared Error (CV(RMSE)) endorsed by IPMVP were used. It is found that simulation-based approach has lower value of NMBE at 2.775% and CV(RMSE) at 10.949% compared to direct methods where NMBE at 79.964% while CV(RMSE) at 104.848%.
Index Terms—Building Simulation; Energy Baseline;
EnergyPlus; Evolutionary Programming (EP); IPMVP.
I. INTRODUCTION
Retrofitting is a process of improving the efficiency of energy consumption in a building and it involves a delicate process. One of the processes is to acquire a precise energy baseline with an acceptable error within specified limit. The importance of energy baseline does not lies with the energy itself but rather the configuration of variables that causes it. In reality, energy consumption in a building can be affected by both static and independent variables. Static and independent variables is an energy governing factors that can gives an impact to the energy consumption in a building. In this paper, static variables can be defined as an unchanged variable in a line of codes throughout the simulation such as building parameters, location and direction. Meanwhile independents variable varies within its own limits at a time such as occupancy, lighting, operating schedule, loads and etc. By evaluating the right configuration of variables at a time, the simulated model may produce a more precise energy baseline with less error percentage. Furthermore, a precise energy baseline and its configuration can later be used for quantifying saving in retrofitting.
Several standards, guidelines and protocols has been introduced to help building owner, engineers or energy manager to understand, perform and quantify saving in retrofitting. America Society of Heating, Refrigerating and Air-Conditioning Engineers (ASHRAE) had published energy saving calculation procedures in ASHRAE Guideline 14-2002 [1]. Other than that, International Performance, Measurement and Verification Protocols (IPMVP) is a Measurement and Verification (M&V) guideline that developed to promote a standardized systematical methods and tools to quantify and manage the risks and benefits associated with end-use of energy and water efficiency [2]. IPMVP has been awarded with numerous award on its efforts for EE development, therefore it has been adopted in many countries. In its guidelines, IPMVP introduced four options for retrofitting, and one that is used in this research is option D – calibrated simulation. The value of Normalized Mean Biased Error (NMBE) and Coefficient of Variance Root Mean Squared Error (CV(RMSE)) endorsed by IPMVP are use as evaluation indices to evaluate the accuracy of the building energy model.
Building simulation may involve a lot of parameters and variables including climate condition, HVAC, form and structure, operating schedule, electric equipment and etc. Considering that, it is full with non-linear interaction and complex function beyond human calculation capabilities. On the other hand, a great advancement in computational science and mathematical has been considered a bless in aiding the modelling, design, simulation and analysis. EnergyPlus is an example of whole building simulator, which developed and funded by U.S Department of Energy (DOE) and has been widely employed to model both energy consumption and water use in a building [3]. Currently there are 153 software listed out by DOE at [4], including database, spreadsheets, components and system analysis that can be used to simulate building energy. However, most of the software listed can only be used for direct methods whereas users are expected to have a full complete and correct data in order to gain precise energy baseline. This hypothetically, is time consuming and wasting processing power.
The term ‘simulation-based optimization’ in this paper refers to an automated process by coupling simulators to find the best configuration to an energy problem by using available alternatives configuration with desired objective function. Coupling software between Building Energy Simulator (BES) and algorithmic optimization engine has been found since late 2000s [5]. There are a few built-in ready to be used coupling software for optimization such as ME+
[6], JEPlus [7] and GenOpt [8]. Despite having coupled together, most of the software are only limited to one or certain optimization algorithm. This limitation can only be waive by the software creator(s) through software updates. Building Control Virtual Test Bed (BCVTB) is a coupling software that allows users to couple different simulation program and/or with physical hardware itself for co-simulation [9]. BCVTB is based on Ptolemy II software environment for an easier modelling. There are few simulation software that can be couple together such as TRNSYS [10], Radiance [11], ESP-r [12] and others including algorithmic optimization engine such as Matlab.
The advancement in computer technologies has made the application of numerical optimization at ease since 1980s. Since then, BES have been modelled in term of mathematical/empirical equations which obtained through rigorous energy simulation. There are varieties of optimization algorithm that has been use such as Artificial Bee Colony (ABC) [7], Artificial Neural network (ANN) [10], particle swarm optimisation (PSO) [8] and others which has its own specification and characteristic. Furthermore, a combination of one or few algorithms as a hybrid algorithm also can be done to improve the previous version in term of speed and data processing. Evolutionary algorithm (EAs) are search and optimization techniques based on the principal of natural evolution. There are four main streams in evolutionary algorithms namely Genetic Algorithms (GA), Genetic Programming (GP), Evolution Strategies (ES) and Evolutionary Programming (EP). However, the most commonly use in energy simulation is GA [8], [10], [13]-[15] and its variants.
This paper presents an optimization of energy baseline in medium office using Evolutionary Programming (EP) in comparison with direct method. An optimization-based simulation was chosen and carried out by coupling optimization algorithm engine, Matlab and BES, EnergyPlus with integrated classic EP to solve energy baseline problems with minimal error. BCVTB will be used to couple EnergyPlus with Matlab using Ptolemy II environment. In current work, single objective function is defined and set in EP to minimized error. Furthermore, 3 variables will be randomized for initialization process to search for a desired group of population such as occupancy, lighting and electric equipment. GERC building located in UiTM Shah Alam campus will be used as a case study. A two months monitoring period was investigated to find the optimum energy baseline configuration with minimal error.
II. METHODS
A. Evolutionary Programming (EP)
Evolutionary algorithm (EAs) is a search and optimization techniques based on the principal of natural evolution. In a complex function and fully non-linear interaction environment, natural evolution has proven remarkably robust and effective optimization approach for independent variables. In BPS, the most commonly use EAs for energy optimization problem is GA, which the mutation phase is less importance. In this paper, the effectiveness of other paradigms of EAs was applied to solve energy baseline configuration problem. As such, due to lack of thorough studies and report, EP was chosen to solve the problems. EP was introduced by Lawrence J.Fogel in 1960 [17] and is one of the optimization technique in EAs. EP is a population
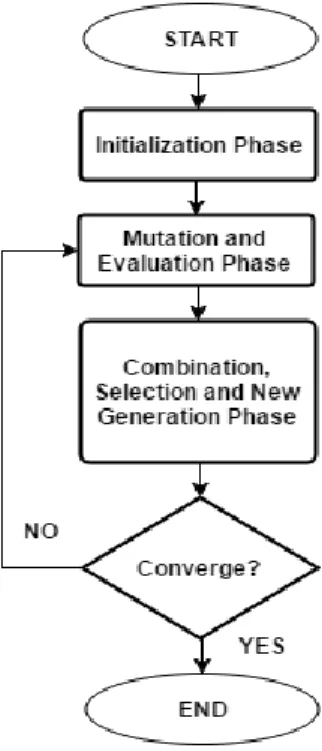
based generation and test approach, in which mutations are the search operator to generate new solutions. EP in effect has similar feature in stochastic selection as that of GA, but emphasizing more on the mutation and its variant operator. Figure 1 shows a typical flow process in an EP.
Figure 1: A typical flow process in an EP
There are few phases involved in EP technique in order to obtain the optimum energy baseline configuration.
a. Initialization Phase
The initialization phase is where an initial population of independent variables would be generated within the parameter’s corresponding bounds. In this paper, there are three variables that randomized which are the number of occupancy, lightings and electrical equipment that are affecting energy consumption in the building. Constraints of each individual variables are set during this phase to obtain the desired output. The command used to generate random number and constrained are in Equations (1) and (2):
B A L K rand Xi ( , ) (1) max min fi f f (2) where: K : Number of row L : Number of column A : Offset B : Minimum random
fi : Simulated energy generated from random configuration
fmax : Monitored energy in the building fmin : Minimum acceptable simulated energy
The initialization phase was pre-set to run 1,000 loops or until 20 initial configurations “parents” satisfied the defined constrained.
b. Mutation and Evaluation Phase
“offspring” from the parent’s population. There are varieties of mutation operator for EP, however this study will use Gaussian mutation as in classic EP. The Gaussian formula is as in Equation (3). 0, ( )( ) max min max , ,
f
f
X
X
X
X
i j j j i j m i N (3) where: Xi+m,j : Offspring Xi,j : Parents β : Search step Xjmax : Maximum parentsXjmin : Minimum parents
fi : Fitness matrix
fmax : Maximum fitness
In this phase 20 mutated configuration will be generated.
c. Combination, Selection and New Generation Phase
When new mutated offspring generated, the parents and the offsprings are combined in series to form a group of 40 population. The population will then sort and rank according to their fitness value in descending order. The top 20 of the population, are then selected and carried forward to form new parents generation.
d. Convergence Test Phase
Convergence test is to determine the stopping criterion of the simulation. If the difference between the maximum fitness and minimum fitness is zero, the solution is said to be converged and the simulation will stop. The value of accuracy was set to 0.0001 as shown in the Equation (4):
0001 . 0 min max
f
f
(4) where:fmax : Maximum energy generated from new parents population
fmin : Minimum energy generated from the same population
If the convergence test fail, the new parents population will repeat the same process beginning at mutation phase until it’s converge.
B. Building Energy Simulator : EnergyPlus
There are few BES freely available such as DOE 2.2, EnergyPlus and others to perform BPS. EnergyPlus is an up-to-date computer program developed and funded by U.S Department of Energy (DOE) and has been widely employed to model both energy consumption and water use in a building. To perform BPS, users must prepare a modelled building file in IDF format with a region weather file. An IDF file consists of modelled building data such as building parameters, HVAC setup, electrical equipment and etc. IDF file also contains a setting for simulation period and timestep which is crucial for communication between simulators. There are two ways to generate IDF file, which is by manually create a new file or modified an older IDF file or by using a 3rd party GUI software. By using the 3rd party software such as OpenStudio EnergyPlus, users not only able to model the building in 3D but also can adjust the IDF file easily using
GUI. Meanwhile, weather data file for the region can be acquired through nearest weather data centre or by downloading from EnergyPlus website.
In this paper, EnergyPlus is used and acts as a hidden function to generate energy consumption “fitness” by feeding the generated configuration “population” into it. BES will run the simulation using a given energy configuration for a period set by users, in this case for two months. BES also are set for an hourly data acquisition by setting up timestep in IDF file. The ‘fitness’ data generated from building simulation will be stored in a database.
C. Simulation Based Optimization Approach
In order to implement simulation-based approach, an open source software framework BCVTB developed by the Lawrence Berkeley National Laboratory at the University of California [9] was selected as a coupling software. BCVTB allows users to couple different simulator and/or with physical hardware itself for co-simulation. BCVTB employs data exchange mechanism with fixed length of communication interval following it client/server structure. By using Berkeley Software Distribution (BSD) socket interface, inter-process communication allows the actual data exchange take place between simulator clients and BCVTB-server.
There are few advantage and dis-advantage of using co-simulation depending on point of views. Some obvious advantages are; firstly, co-simulation allows sub-model to be implemented in its own simulation environment. Each sub-model will run in parallel which will not only results in saving processing time but also leading to a more efficient models. Secondly, each simulation environment can employ different algorithm which expand the possibilities of more dynamic system and less processing power. Thirdly, individual domain expert can use their preferred simulation environment tools which satisfied the needs of their work. However, co-simulation also imperfect in term of communication between clients. Since both client’s simulator run in parallel, the periodic communication “loose coupling” may leads to additional numerical error.
In this paper, a co-simulation is built as a prototype framework by coupling two sub-models with each own simulation environment. To build this prototype framework, BES EnergyPlus and algorithmic optimization engine, Matlab are coupled together to perform optimization where algorithmic and production schedule will be integrated in Matlab environment, while, building model implemented in BES EnergyPlus. With this, each environment tailored to its individual needs and sub-models. This framework allows simulating various scenarios of energy baseline configuration and different sensitivity studies for deeper analysis and its impact on overall system. With a clear boundary between each environment interface, individual sub-models can be upgraded, replaced and combined with different model without affecting other parts and overall framework i.e. using the same building model but with different optimization algorithm. In term of co-simulation, both simulators will run in parallel and exchange their respective input/output data periodically with fixed communication points in hourly manner. Figure 2 shows the connection between Matlab, BCVTB and EnergyPlus as a prototype framework.
Figure 2: the proposed prototype framework between Matlab, BCVTB and EnergyPlus
The prototype framework process flow, follows the top-down process as in EP. EP algorithm are written and code in Matlab environment by sub-dividing into respective phases. The process begins in initialization as to collect 20 initial population “parents” and ends with convergence test as a function to minimized error. EP optimization algorithm is used to generate a vectors of random decision configuration and then through BCVTB, coupling framework will transfer the data to BES EnergyPlus. From then, EnergyPlus will simulate building models with given configuration and test it for a period of time and report the response energy consumption in hourly manner. The process will stop at the end of the loop or until its met termination criteria.
D. Direct Method
Direct methods in this paper refer to a manual calibration and search method to find the best solution to an energy consumption. OpenStudio EnergyPlus is used to setup the building model and perform building energy simulation. All parameters except the three variables; occupancy, lighting and electrical equipment will be fixed throughout the simulation. The combination of the three variables will then be varied iteratively until the simulated energy consumption matches the real time actual energy data.
E. Building Energy Evaluation
Two evaluations from IPMVP, Normalized Mean Biased Error (NMBE) and Coefficient of Variants of Root Mean Squared Error (CV(RMSE)) are used to evaluate the accuracy of the energy building model. Two different reporting criteria are taken into account which are Monthly energy consumption and Hourly energy consumption. The energy baseline is considered optimized when NMBE and CVRMSE are in acceptable range. Table 1 shows the acceptable MBE and CV(RMSE) tolerance. To calculate the Value of NMBE and CV(RMSE), equations are provided as in Equations (5) and (6) respectively.
Table 1
Acceptable NMBE and CV(RMSE) Tolerance
Reporting Type Index Acceptable Value
Monthly NMBE ±5% CV(RMSE) 15% Hourly NMBE ±10% CV(RMSE) 30% y p n NMBE n t
y
iy
i ˆ ) ( ) ( 1ˆ
(5) p n i i y RMSE CV n ty
y
1
2)
ˆ
(
ˆ 1 ) ( (6) where:ӯ
𝑖 : Simulated energy consumption𝑦
𝑖 : Measured energy consumption𝑛
: Numbers of data pointӯ
: Mean of measured data 𝑝 : Equal to 1F. Case Study
The optimization method discussed in the previous section is applied to a selected building model. The building model will be setup such that the energy consumption will represent the existing building. The optimized energy consumption with the right energy configuration is called energy baseline. Nowadays, with the available Computer Aided Design (CAD) software and Graphical User Interface (GUI), building model can easily be drawn in 3D and the thermal zone setting can easily manipulated to get desired results.
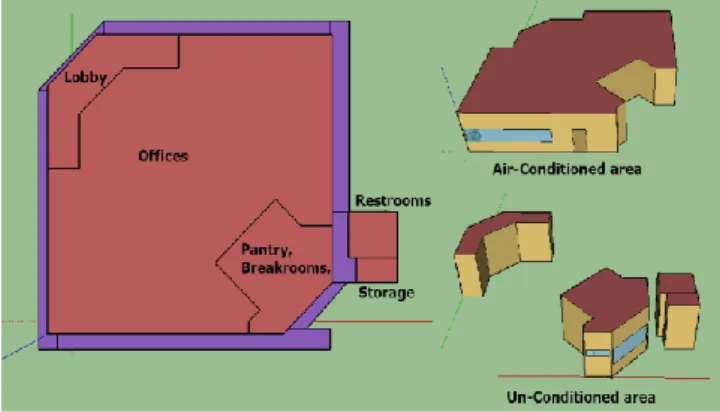
The building modelled in this paper is a single storey medium sized office, Green Energy Research Centre (GERC) located in UiTM Shah Alam with total area of 190.24 m2. GERC comprises of two offices; where the up-front office belong to lecturers, researchers (R&D) and post-grad students of GERC, while the back spaces belong to UiTM facility department (BKAF). Figure 3 shows an adaptation of building model in 3D using OpenStudio SketchUp. The model has a height of 3.4 m from ceiling to bottom, 51.2m2 clear glazing window with no curtain is taken into account for the windows. Internal load and occupancy will be set to float, meanwhile, lighting is set at 36W per fluorescent lamp. Table 2 lists the properties of the case study in response with ASHRAE 189.1-2009 for medium office standards.
Figure 3: The schematic views of the building model Prototype Framework
(BCVTB)
Table 2
Properties of Building Energy Model
Envelop Property Value
Exterior Wall Thickness (m) 0.2623
Specific Heat (J/kgK) 837.00
Density (kg/m3) 1676.0
U-Value (W/m2K) 0.9340
Interior Wall Thickness (m) 0.1016
Specific Heat (J/kgK) 1090.0 Density (kg/m3) 800.00 U-Value (W/m2K) 0.2375 Floor/Roof Thickness (m) 0.1803 Specific Heat (J/kgK) 905.07 Density (kg/m3) 800.00 U-Value (W/m2K) 0.5000
Windows Solar transmittance (-) 0.2374
(Clear glaze) Visible transmittance (-) 0.2512
U-Value (W/m2K) 1.3500
The office operation time has an uncertain schedule due to unpredictable activity in each room. This is due to GERC is used as a research center for the under graduate and post graduate students to pursue research in renewable energy. Since hourly report is used, simulated energy consumption and actual energy consumption must have a low discrepancy to achieve a good NMBE and CVRMSE. In this energy model, lighting and load is not an issue as it can be turned on-off at any given time. Occupancy however, must follows certain schedule as to present the number of people in the building at a time.
The building model is set with two thermal zone representing air-conditioned and un-airconditioned rooms. Both offices BKAF and GERC are set on thermal zone 1 with air-conditioned, meanwhile, all other rooms including pantries, restroom, storage room, break room and lobby are set with thermal zone 2 with un-airconditioned state. The HVAC are set at 24oC constant cooling set-point. Figure 3 shows a schematic view of the building model.
G. Objective Function, Decision Variables and
Constraints
In this paper, minimization of an error in hourly building energy is set as the objective function. Table 3 list the decision parameters as well as their initial value and range of variability. To optimize energy consumption, three independent variables are chosen to be randomized which are occupancy, lighting and electric equipment. The three variables are randomized in Matlab and the values are then sent through BCVTB framework to EnergyPlus for simulating energy consumption. With the right building configuration between lighting, occupancy and load, the generated energy consumption is acceptable if it falls within the pre-defined range between monitored value, Ymax and minimum value, Ymin.
Table 3
Specification of Decision Variables Decision
Variables Unit Types Minimum Maximum
Lighting No. of CFL
* 36W Continuous 1 120
Electric
Equipment kW continuous 1 30
Occupancy No. of People continuous 0 100
Cooling Set-points
oC Discrete - 24
Since an hourly reporting period is considered in this paper, the absence of operating schedule for the office as mentioned previously has decreased the odd of having accurate energy model. As such, certain constraint of limitation must be identified to configure the variables. Operating schedule in the building refers to the absence of people and light in the building. Thus, some constraints must be put on the occupancy at certain times. Through observation the fluctuation of measured energy consumption at the beginning of the days, it is found that the maximum energy consumption during closed office hour is at 5Wh. Thus the constraint is present in Equation (7).
5 ,... , 5 , 0 , f i Occ Light f i Occ Light (7) where:
fi : Measured energy consumption III. RESULT AND DISCUSSION
In this section, the results of the proposed simulation-based approach in the case study is presented. A single objective function which is to minimize error in hourly energy consumption is applied and optimized using EP algorithm. The main purposes of this study is to search for the best configuration of energy baseline that leads to acceptable NMBE and CVRSME endorsed by IPMVP. Two month periods of monitored energy consumption beginning July 1st, 2015 to August 31st, 2015 are tested using the proposed framework model in finding energy baseline configuration.
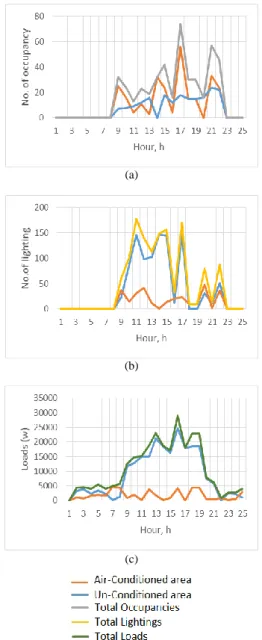
Figure 4 shows optimal configuration proposed by EP for (a) occupancies, (b) lightings and loads in one day. With no weighting factor, the proposed configuration was randomized and tested to find optimum energy baseline. The configuration was divided into two area which are Air-Conditioned area and Un-Air-Conditioned area. As seen in Lightings and occupancies, the constrained have resulted in operating hour beginning at 8.00 a.m and closed at 23.00 p.m. This may be due to the office use for research centre for post grad students.
To verify the accuracy of the building energy model, the value of NMBE and CV(RMSE) were calculated. Table 4 shows the comparison of NMBE and CV(RMSE) between simulation-based approach and direct methods. It is found that simulation-based approach has lower value of NMBE at 2.775% and CV(RMSE) at 10.949% compare to direct methods where NMBE at 79.964% while CV(RMSE) at 104.848%. This shows that the accuracy of the building energy model proposed in this paper is adequate as recommended by IPMVP guidelines.
(a)
(b)
(c)
Figure 4: The optimum configuration in one day for whole building comparing air-conditioned and un-conditioned area (a) Number of
occupancy, (b) Number of lighting, and (c) Loads power(w) Table 4
The Comparison of NMBE and CV(RMSE) between Simulation-based Approach and Direct Methods
Method NMBE CV(RMSE)
Simulation-based
Approach 0.02775 0.1094
Direct Method 0.7996 1.0408
IV. CONCLUSION
This study introduces an efficient simulation-based approach to find optimal energy baseline with minimal error. In this paper, an algorithmic optimization engine, Matlab was coupled with building energy simulator, EnergyPlus using BCVTB as a prototype framework. A classic Evolutionary Programming (EP) algorithm was chosen and integrated in Matlab to find the best configurations for optimum simulation of energy baseline. The generated configuration, was then sent to EP through BCVTB framework. The process runs automatically until the EP is converged. The proposed method is not only requiring less computation time but also effective in searching for the best configuration compared to
the direct method.
The presented optimization-based approach was tested in a medium sized office with an absence of operating schedule. Three variables were chosen to find the best configuration which are occupancies, lightings and loads. The building energy model was divided into two thermal zone which represent an air-conditioned area and un-airconditioned area. EP was subjected to randomize the variables with the constrained input.
In the analysis, a single objective which is to minimize error was carried out. To evaluate the accuracy of the model, NMBE and CV(RMSE) which endorsed by IPMVP were calculated based on the hourly reporting criteria. It is found that the simulation-based approach gives a better result compared to direct methods in term of its accuracy and simulation time.
The energy baseline can be further used for retrofitting savings analysis following the IPMVP guidelines. Given the chances, this method is also capable of handling high dimensional inputs and large quantity of simulation samples. Undoubtedly, further improvement in EP can be done to get a faster data processing such as different mutation operator.
ACKNOWLEDGMENT
Our utmost gratitude goes to Malaysia Ministry of Education and Universiti Teknologi MARA (UiTM) who have sponsored this paper under Research Acculturation Grant Scheme (RAGS), 600- RMI/RAGS 5/3 (194/2014).
REFERENCES
[1] ASHRAE, Measurement of energy and demand savings. Atlanta, GA 2002.
[2] IPMVP Renewables Subcommitte, Concept and practices for determining energy savings in renewable technologies applications: IPMVP option D: calibrated simulation. ipmvp.org, pp. 13-17. 2003 vol. III.
[3] (2017) EnergyPlus website. [Online]. Available: https://energyplus.net/
[4] IBPSA-USA (2014) Building energy software tools. [Online]. Available: http://www.buildingenergysoftwaretools.com/software-listing
[5] Anh-Tuan Nguyen, Sigrid Reiter and Philippe Rigo “A review on simulation-based optimization methods applied to building performance analysis”, Applied Energy., vol. 113, pp. 1043-1058, 2014.
[6] Willy Bernal, Madhur Behl, Truong X. Nghiem, and Rahul Mangharam, “MLE+: a tool for integrated design and deployment of energy efficient building controls,” Toronto, Canada 2012.
[7] Navid Delgarm, Behrang Sajadi and Saeed Delgarm, “Multi-objective optimization of building energy performance and indoor thermal comfort a new method using Artificial Bee Colony (ABC),” Energy and Buildings, Issue 131, pp. 42-53, 2016
[8] Valentina Monetti, Elisabeth Davin, Enrico Fabrizio, PhilippeAndre and Marco Filippi, “Calibration of building energy simulation models based on optimization - a case study,” Energy Procedia, Issue 78, pp. 2971-2976. 2015.
[9] Wetter, M, “Co-simulation of building energy and control systems with the building controls virtual test bed,” Journal of Building Performance Simulation, 4(3), pp. 185-203. 2011.
[10] Haghighat, Laurent Magnier and Fariborz, “Multiobjective optimization of building design using TRNSYS simulations, genetic algorithm, and artificial neural network,” Building and Environment, vol. 45, pp. 739-746, Nov. 2010.
[11] (2017) Radiance website. [Online]. Available: https://www.radiance-online.org/
[12] (2017) ESP-r website. [Online]. Available:
http://www.esru.strath.ac.uk/Programs/ESP-r.htm
[13] V. Siddhartha, P.V. Ramakrishnaa, T. Geethaa and Anand Sivasubramaniam, “Automatic generation of energy conservation
measures in buildings using genetic algorithms,” Energy and Buildings. vol. 43, pp. 2718-2726, Nov. 2011.
[14] Jonathan A. Wright, Heather A. Loosemore and Raziyeh Farmani, “Optimization of building thermal design and control by multi-criterion genetic algorithm,” Energy and Buildings, vol. 34, pp. 959-972. 2002.
[15] Fabrizio Ascione, Nicola Bianco, Rosa Francesca De Masi, Gerardo Maria Mauro and Giuseppe Peter Vanoli, “Design of the building envelope- a novel multi-objective approach for the optimization of energy performance and thermal comfort,” Sustainability, vol. 7, 2015. [16] A. C. Koenig, “A study of mutation methods for evolutionry