Bi-factor Multidimensional Item Response Theory Modeling
for Subscores Estimation, Reliability, and Classification
By
Zairul Nor Deana Md Desa
Submitted to the Department of Psychology and Research in Education and the Faculty of the Graduate School of the University of Kansas
in partial fulfillment of the requirements for the degree of Doctor of Philosophy Committee members William P. Skorupski, Ph.D., Chairperson Neal Kingston, Ph.D. Bruce B. Frey, Ph.D. Vicki Peyton, Ph.D. Carol M. Woods, Ph.D. Date defended:
The Dissertation Committee for Zairul Nor Deana Md Desa certifies that this is the approved version of the following dissertation :
Bi-factor Multidimensional Item Response Theory Modeling for Subscores Estimation, Reliability, and Classification
William P. Skorupski, Ph.D., Chairperson
Abstract
In recent years, there has been increasing interest in estimating and improving sub-score reliability. In this study, the multidimensional item response theory (MIRT) and the bi-factor model were combined to estimate subscores, to obtain subscores reliabil-ity, and subscores classification. Both the compensatory and partially compensatory MIRT models are defined with bi-factor structure. A Monte Carlo study with 1,500 examinees was carried out for each model to examine two different test lengths (30 and 60 items) and five levels of item discrimination between primary and specific abil-ities (.50, .75, 1.0, 1.25, 1.50). The Markov Chain Monte Carlo (MCMC) with the Gibbs sampling method was applied to simultaneously estimate the expected a pos-teriori (EAP) subscores for primary and specific ability dimensions. Results were evaluated in light of estimation accuracy and fit, subscore reliability based on the Bayesian marginal reliability, and subscore classification based on subscore separation index. Despite a very minimum computing intensity for the MCMC simulation, both bi-factor compensatory and bi-factor partially compensatory models produced higher subscores reliability resulted from lower bias and reduction in the error variance of EAP subscores in all ability dimensions. These improved subscores reliability that also arrived at a higher discrimination level and for a longer test. This study found the bi-factor compensatory model to show better potential in classifying the magnitude of distinction between specific abilities and primary ability. Whereas, the bi-factor partially compensatory minimized the classification of subscores between the specific and primary abilities.
Acknowledgements
I would never have been able to complete my dissertation without the cred-ible guidance from all of the committee members, supports from friends, and family members. I feel indebted to many people who have greatly in-spired and supported me during my several years of my Ph.D. study at the University of Kansas. I would like to express my deep gratitude to my ad-visor, Dr. William P. Skorupski, for his excellent guidance, patience and providing me with motivational thoughts for doing this research. I would like to thank Dr. Neal Kingston, Dr. Bruce B. Frey, Dr. Vicki Peyton, and Dr. Carol M. Woods for their heartful encouragement, academic stimulus, and generous help throughout my study in the program. I also want to thank Dr. Kristopher J. Preacher who served on my Comprehensive Exam Com-mittee, and Dr. Paul E. Johnson for devoted so much time and effort into my study and his patience with my questions. I will not forget enjoyable discussions and thoughts in academia with these people. My gratitude also goes to friends and colleagues for their ideas, comments, support and many cherished moments. Also, I am indeed obliged to the Universiti Teknologi Malaysia and the Ministry of Higher Education Malaysia for giving me the opportunity and financial support to study and carry out research abroad from 2008 to 2012. I owe permanent love from my amazing and precious parents, dear husband and daughter for their understanding and fascinating support. My infinite loop of deepest gratitude and love especially goes to them.
Contents
1 Introduction 1
1.1 Background of the Study . . . 1
1.1.1 IRT Scale Score . . . 3
1.1.2 Bi-factor Score . . . 4
1.2 Scoring Subscores Based on Item Response Theory . . . 5
1.2.1 Improving Reliability of Subscore Estimates . . . 7
1.3 Statement of the Problem . . . 8
1.4 Purpose of the Study . . . 11
1.5 Hypotheses . . . 12
1.6 Definitions of Variables . . . 13
1.7 Summary and Significance of the Study . . . 14
2 Literature Review 16 2.1 Regression Approach of Subscore Estimates . . . 16
2.2 Subscore Augmentation from IRT Scale Score . . . 20
2.3 Mutidimensional IRT Subscore Estimation . . . 24
2.4 Bi-factor Model as a Confirmatory MIRT Model . . . 27
3 Methodology 30 3.1 Models for Subscores Estimation . . . 30
3.1.1 Confirmatory 3PL MIRT Model . . . 30
3.2 Scoring Procedure . . . 37
3.2.1 Bayesian Estimation Method . . . 38
3.2.2 Markov Chain Monte Carlo with Gibbs Sampling . . . 40
3.3 Simulation Study Design . . . 42
3.3.1 Independent Variables . . . 42
3.3.1.1 Type of Item and Test Lengths . . . 42
3.3.1.2 Item and Examinee Characteristics . . . 43
3.3.1.3 Item Responses . . . 45
3.4 Estimation Procedures . . . 46
3.4.1 Prior Distributions . . . 46
3.4.2 MCMC with Gibbs Sampling . . . 48
3.4.3 Checking Model Convergence . . . 48
3.5 Evaluation Criteria . . . 49
3.5.1 Simulation Evaluation . . . 50
3.5.1.1 Parameter Recoveries . . . 50
3.5.1.2 Bayesian Complexity and Fit . . . 51
3.5.2 Subscores Evaluation . . . 52
3.5.2.1 Subscore Correlation . . . 52
3.5.2.2 Subscore Separation Index . . . 53
4 Results 56 4.1 Parallel Computing Design for the Simulation Studies . . . 57
4.2 Results for Study 1 . . . 59
4.2.1 MCMC Simulation Diagnostics for Study 1 . . . 59
4.2.2 Parameter Recovery for Study 1 . . . 64
4.2.2.1 Recovery of a-parameter . . . 64
4.2.2.2 Recovery of b-parameter . . . 69
4.2.2.4 Recovery and Reliability of Thetas . . . 73
4.2.3 Bayesian Criteria Comparison for Study 1 . . . 78
4.2.4 Subscore Reliability and Classification . . . 78
4.2.4.1 Subscore Reliability . . . 78
4.2.4.2 Subscore Separation Index . . . 83
4.3 Results For Study 2 . . . 86
4.3.1 MCMC Simulation Diagnostics for Study 2 . . . 86
4.3.2 Parameter Recovery for Study 2 . . . 86
4.3.2.1 Recovery of a-parameter . . . 91
4.3.2.2 Recovery of b-parameter . . . 95
4.3.2.3 Recovery of c-parameter . . . 98
4.3.2.4 Recovery and Reliability of Thetas . . . 99
4.3.3 Bayesian Criteria Comparison for Study 2 . . . 103
4.3.4 Subscore Reliability and Classification . . . 106
4.3.4.1 Subscore Reliability . . . 106
4.3.4.2 Subscore Separation Index . . . 108
5 Discussion and Conclusion 111 5.1 Models for Improving Subscores Estimation . . . 112
5.2 Summary of Simulation Studies . . . 113
5.2.1 Item and Person Parameters Recoveries . . . 113
5.2.2 Bayesian Model Complexity and Fit . . . 115
5.3 Subscores Reliability and Classification . . . 116
5.4 Limitations of the Study and Future Research . . . 118
5.5 Practical Importance of the Study . . . 121
A Appendices for Study 1 134
List of Figures
3.1 Plots of the Bi-factor Compensatory Model . . . 33
3.2 Plots of the Bi-factor Partially Compensatory Model . . . 35
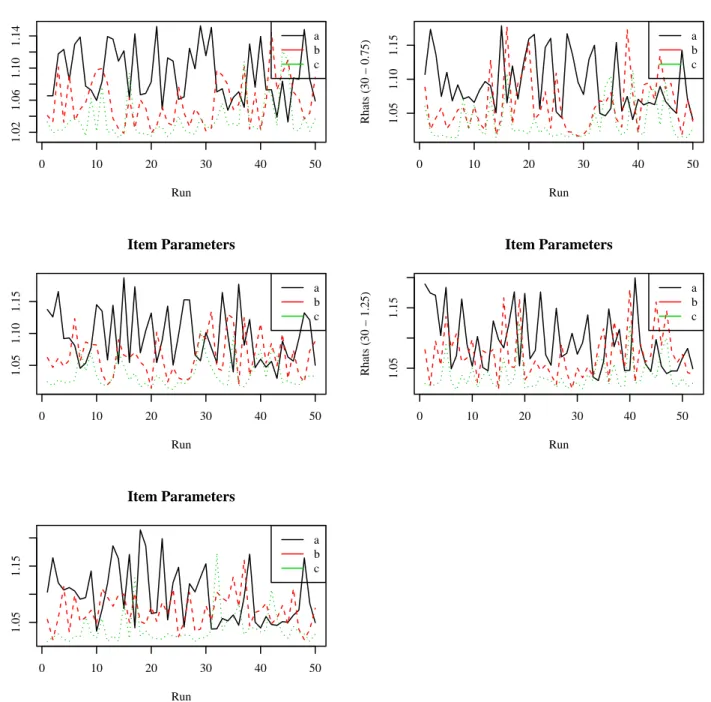
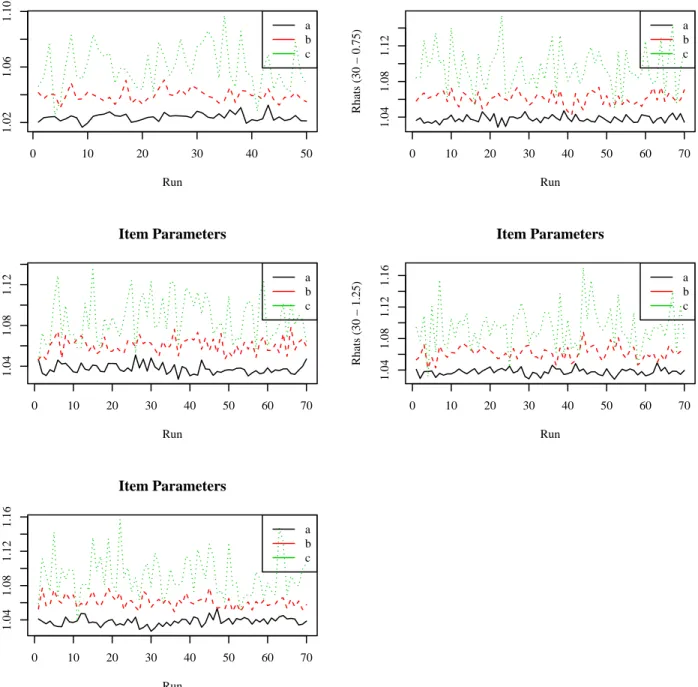
4.1 Rhats for Item Parameters in BF-C Model for 30-item Test . . . 60
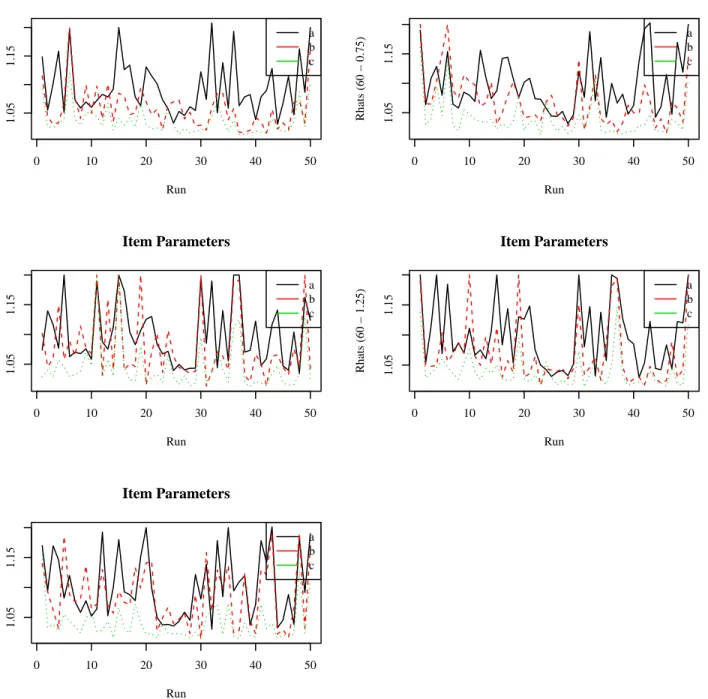
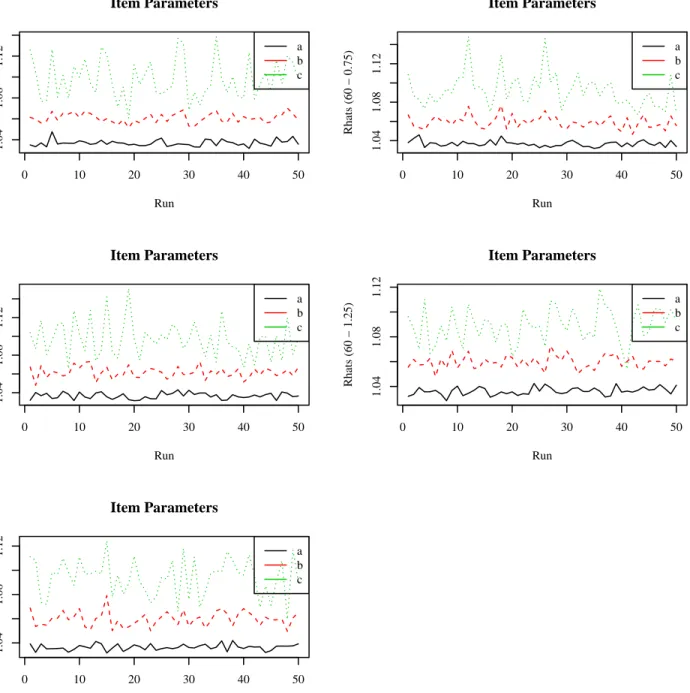
4.2 Rhats for Item Parameters in BF-C Model for 60-item Test . . . 61
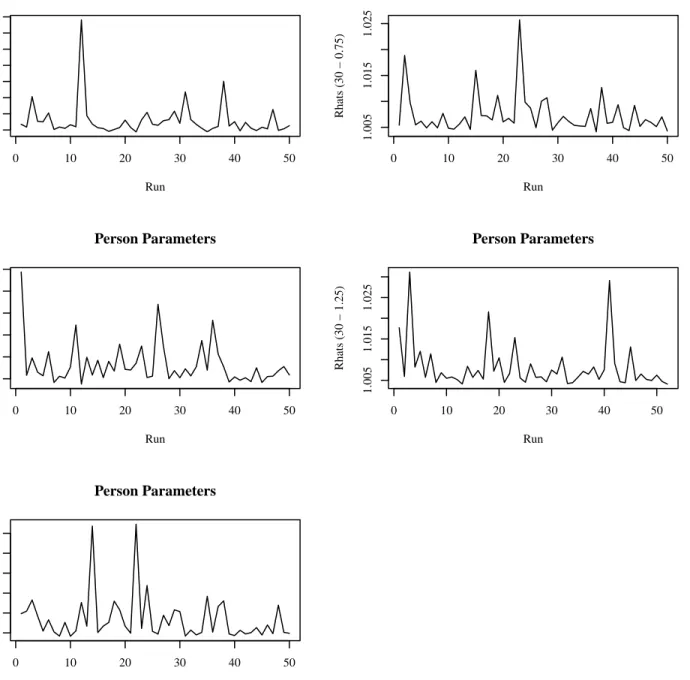
4.3 Rhats for Examinee (or Person) Parameters in BF-C Model for 30-item Test . . . . 62
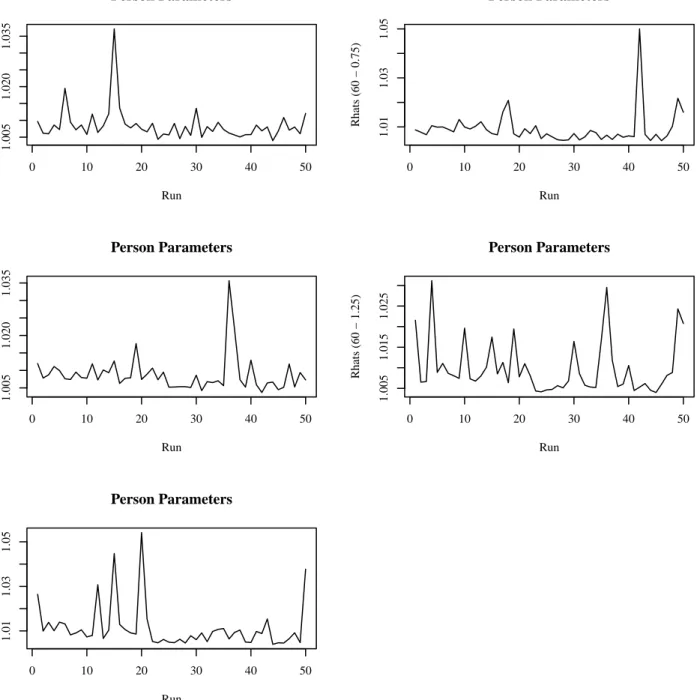
4.4 Rhats for Examinee (or Person) Parameters in BF-C Model for 60-item Test . . . . 63
4.5 Bias and RMSE for a-parameters in the BF-C Model . . . 68
4.6 Bias and RMSE for b-parameter in the BF-C Model . . . 70
4.7 Bias and RMSE of c-parameter in BF-C Model . . . 72
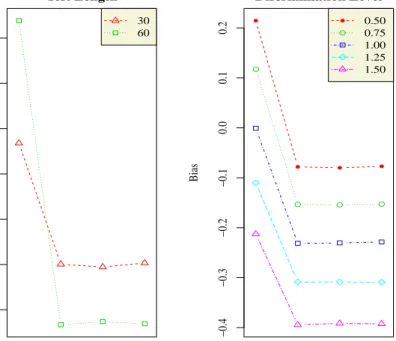
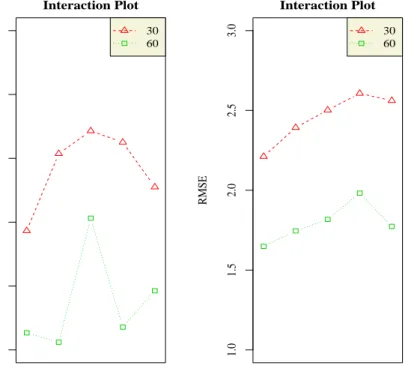
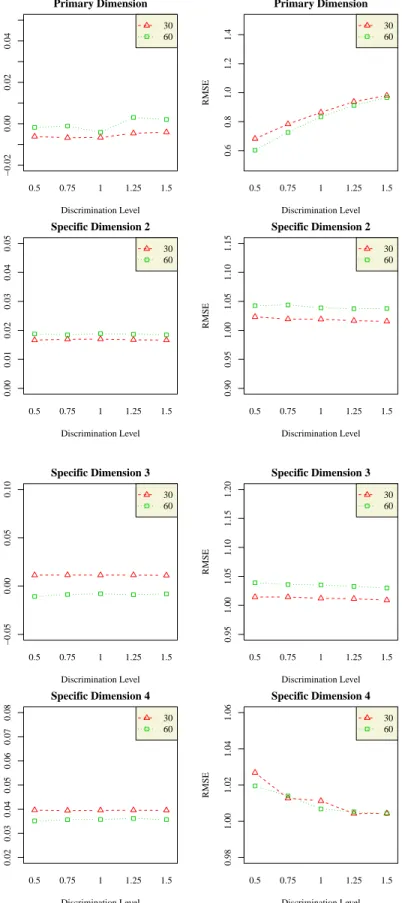
4.8 Interaction Plots between Test Length and Discrimination Level on Bias and RMSE for Each Theta in the BF-C Model . . . 76
4.9 Reliability for the Estimated Subscores and Generated Abilities (Thetas) . . . 77
4.10 Bayesian Indices for BF-C Model Complexity and Fit . . . 81
4.11 Subscore Reliability for BF-C Model . . . 82
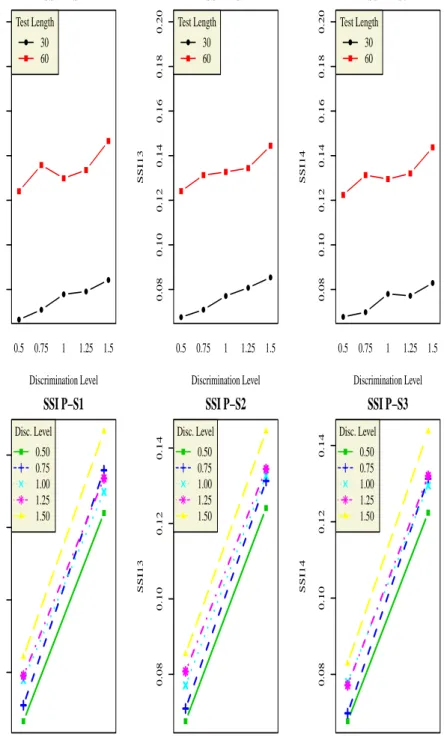
4.12 Plot of SSI and Hit Rate for BF-C Model . . . 85
4.13 Rhats for Item Parameters in the BF-PC Model for 30-item Test . . . 87
4.14 Rhats for Item Parameters in the BF-PC Model for 60-item Test . . . 88
4.15 Rhats for Examinee (or Person) Parameters in the BF-PC Model for 30-item Test . 89 4.16 Rhats for Examinee (or Person) Parameters in the BF-PC Model for 60-item Test . 90 4.17 Interaction Plots of Test Length, Discrimination Level and Dimension on Bias and RMSE for a-parameter in BF-PC Model . . . 94
4.18 Interaction Plots of Test Length, Discrimination Level and Dimension on Bias and
RMSE for b-parameter in BF-PC Model . . . 97
4.19 Interaction Plots of Test Length and Discrimination Level on Bias and RMSE for c-parameter in BF-PC Model . . . 99
4.20 Interaction Plots Test Length and Discrimination Level on Bias and RMSE for Each Theta in BF-PC Model . . . 102
4.21 Reliability for Estimated Subscores and Generated Abilities (Thetas) . . . 103
4.22 Bayesian Indices for BF-PC Model Complexity and Fit . . . 105
4.23 Subscore Reliability for BF-PC Model . . . 107
4.24 Plot of SSI and Hit Rate for BF-PC Model . . . 110
A.1 Example Trace and Kernel Density Plots for a-parameter . . . 135
A.2 Example Trace and Kernel Density Plots for b- and c-parameter . . . 136
A.3 Example Trace and Kernel Density Plots for Thetas . . . 137
B.1 Example Trace and Kernel Density Plots for a-parameter . . . 142
B.2 Example Trace and Kernel Density Plots for b-parameters . . . 143
B.3 Example Trace and Kernel Density Plots for c-parameter . . . 144
List of Tables
3.1 Simulation Condition for the Bi-factor Compensatory and Partially Compensatory
3PL MIRT Models . . . 44
4.1 Multivariate Within-runs Effects for a-parameters in the BF-C Model. . . 67
4.2 Between-runs Effects for a-parameters in the BF-PC Model . . . 67
4.3 Bias and RMSE of b-parameter in the BF-C Model . . . 70
4.4 Bias and RMSE for c-parameter in the BF-C Model . . . 72
4.5 Multivariate Within-runs Effects for Thetas in the BF-C Model . . . 74
4.6 Between-runs Effects for Thetas in the BF-C Model . . . 74
4.7 BF-C Model Bayesian Complexity and Fit . . . 79
4.8 Subscore Bayesian Marginal Reliability from BF-C Model . . . 79
4.9 Subscores Separation Index Means, Standard Error and Hit Rate for BF-C Model . 84 4.10 Multivariate Within-runs Effects for a-parameter in the BF-PC Model . . . 93
4.11 Between-runs Effects for a-parameter in the BF-PC Model . . . 93
4.12 Multivariate Within-runs Effects for b-parameter in the BF-PC Model . . . 96
4.13 Between-runs Effects for b-parameter in the BF-PC Model . . . 96
4.14 ANOVA for Bias and RMSE of c-parameter in BF-PC Model . . . 98
4.15 ANOVA for Bias and RMSE of Theta in Each Dimension from the BF-PC Model . . 101
4.16 BF-PC Model Bayesian Complexity and Fit . . . 104
4.17 Subscore Reliability from BF-PC Model . . . 106
4.18 Subscore Separation Index Means, Standard Error and Hit Rate for BF-PC Model . 109 A.1 Means and Standard Errors for Bias and RMSE of a-parameter . . . 138
A.2 Means and Standard Errors for Bias and RMSE of b-parameter . . . 139 A.3 Means and Standard Errors for Bias and RMSE of c-parameter . . . 139 A.4 Means and Standard Errors for Bias, RMSE, and Pearson’s Correlation for Thetas 140
B.1 Means and Standard Errors for Bias and RMSE of a-parameter . . . 146 B.2 Means and Standard Errors for Bias and RMSE of b-parameter . . . 147 B.3 Means and Standard Errors for Bias and RMSE of c-parameter . . . 148 B.4 Means and Standard Errors for Bias, RMSE, and Pearson’s Correlation for Thetas 149
List of Equations
2.1.1 Kelly’s Regression . . . 16
2.1.2 Multivariate Kelly’s Regression . . . 17
2.1.3 (Cronbach’s) coefficient alpha . . . 18
2.1.4 Emprical Bayes estimate of subscores . . . 19
2.1.5 Subscale Reliability . . . 19
2.2.1 EAP of Kelly’s Regression . . . 21
2.2.2 Approximate EAP of Kelley’s Regression . . . 21
2.2.3 Marginal reliability from Kelly’s regression . . . 21
2.2.4 EAP of the IRT scale scores . . . 22
2.3.1 Corrected EAP of the IRT scale scores . . . 26
3.1.1 Logit function for the compensatory M3PL model . . . 31
3.1.2 Probit function for the compensatory M3PL model . . . 31
3.1.3 Logit function for the partially compensatory M3PL model . . . 32
3.1.4 Probit function for the partially compensatory M3PL model . . . 34
3.2.1 Likelihood Function . . . 39
3.2.2 Bayes’ theorem of the compensatory MIRT model . . . 40
3.2.3 Bayes’ theorem of the partially compensatory MIRT model . . . 40
3.2.4 Fully Bayesian posterior for the compensatory MIRT model . . . 40
3.2.5 Fully Bayesian posterior for the partially compensatory MIRT model . . . 40
3.2.6 Item charateristic curve for the compensatory MIRT model . . . 41
3.2.8 EAP estimates for the bi-factor compensatory MIRT model . . . 41
3.2.9 EAP estimates for the bi-factor partially compensatory MIRT model . . . 41
3.5.1 Subscore Bayesian marginal reliability . . . 53
Chapter 1
Introduction
Test scores can provide an informative inference about examinees performance on an assessment. Reliable test scores are reported for the acquisition of a broad range of content materials that is fair enough for the examinees to be compared with the respective norm groups. This is important for test validation, which requires broad content coverage. Standard 5.12 in the 1999 Standards for Educational and Psychological Testing AERA et al. (1999) emphasizes that scores should not be reported for individuals unless the validity, comparability, and reliability of such scores have been established. However, reporting subscores of test subscales is permissible for reliable scores over the total scores, indicating significant consequences for the examinees and the stakeholders.
1.1
Background of the Study
Judicious reviews of psychometric properties provide for an important mechanism to the test theory as well as reduce any unintended social consequences (Messick, 1995) associated with the use of subscores, especially the subscores that are tied to explicit or implicit objectives of instruction or to specific content domains. The implications of reporting subscores are also addressed under the No Child Left Behind Act of 2001 NCLB (2001) that every state is required to develop an accountability assessment system to measure statewide progress and evaluate school performance. The NCLB Act of 2001 affirming that:
Such assessments shall produce individual student interpretive, descriptive, and diag-nostic reports . . . that allow parents, teachers, and principals to understand and address the specific academic needs of students, and include information regarding achieve-ment on academic assessachieve-ments aligned with State academic achieveachieve-ment standards, and that are provided to parents, teachers, and principals as soon as is practicably pos-sible after the assessment is given, in an understandable and uniform format, and to the extent practicable, in a language that parents can understand. (NCLB, Part A, Subpart 1, Sec. 2221[b]3[C][xii], 2001)
Concentration on the precise scoring methods for the specific content domains in which the exam-inees may be having difficulties is needed for informed feedback. Therefore, sophisticated scoring procedures for estimating the subscores can lead to more reliable and valid scoring reports about examinee’s strengths and weaknesses in content-related subjects. Thus, reliable and valid scores are very important for accountability assessments that might be aided to optimal design for diag-nostic purposes.
It is very common for test scores from large-scale assessments to be calibrated from unidi-mensional space and reported as item response theory (IRT) scale scores. Traditional IRT scale scores or IRT subscales scores might have made use of the summed scores or as a measure the true proficiency (Hambleton & Jones, 1993; Hambleton & Swaminathan, 1985; Lord, 1980, 1952). Summed scores or number-correct scores were judged unacceptable and unattractive features for some of the stakeholders where the scores were reported to intense public scrutiny in large-scale testing.
The property of summed scores based on classical test theory does not allow that examinees with the same number of correct items received the same scale scores on a test. Thus, subscores from item-patterns are used instead to stabilize the subscale scores (Wainer et al., 2001). Subscores may be used to infer an examinee’s strengths and weaknesses on the subscales of specific abilities (e.g. algebra, geometry, and number sense in mathematics), and are important for projective per-formance. Subscores may be computed from the examinee’s response pattern from each subscale
item, and the probability of success from each item within the subscale is predicted to give the total score, in turn, that infers the overall examinee’s ability based on the rest of the test (Yen, 1987).
1.1.1
IRT Scale Score
Both unidimensional IRT (UIRT) models and multidimensional IRT (MIRT) models developed from probabilistic IRT models and are straightforward to understand. UIRT and MIRT models are capable of predicting examinee proficiency or cognitive abilities, and resolve the classical test theory (CTT) limitations or incapabilities, given the examinees responses on test items. Items in Large-scale assessments (e.g. SAT, ACT, GRE, TOEFL, TIMSS, PISA, NAEP and PIRLS) are designed to measure proficiency in multiple or more specific content domains within a larger sub-ject such as algebra and geometry within mathematics, and physical and life sciences within sci-ence. Test items from large-scale assessments are typically calibrated based on unidimensional IRT models due to their time consuming nature and demands from testing companies and stakeholders. Moreover, with unidimensonal IRT, there is very limited information on examinee performance on the specific content domains because the reported score is based on a single dimension which covers only the broad macroskills. Thus, student achievement on the specific content domains are barely interpreted or evaluated.
IRT scale scores from UIRT or MIRT models provide rich information about item character-istics and distribution of examinees’ performance on each item continuum of their ability metric scale that typically on Normal distribution with zero mean and standard deviation 1.0 (Hambleton & Swaminathan, 1985; Thissen, 1982). IRT scale scores have many applications as items and ex-aminees can be placed on a common scale, for example, test linking, equating and scaling (Kolen & Brennan, 2004), item banking, computer-based testing and computerized adaptive testing (Dras-gow & Olson-Buchanan, 1999; Mills et al., 2002; Parshall et al., 2001; van der Linden & Glas, 2000; Wainer & Dorans, 2000). Thus, the examinee’s reported proficiency is more conducive for further psychometric analysis and enhances test score interpretations for multiple groups of exam-inees or multiple test forms. Also, for a test that is defined to have multidimensional structure, IRT
scaled scores for all abilities as well as specific test objectives or skills can be estimated simulta-neously and, therefore, be reported for many educational purposes such as student profiling and diagnostic feedback to teachers on student’s strengths and weaknesses.
1.1.2
Bi-factor Score
Due to the strong relationship between the development of factor analysis and IRT, there has been recent attention to these sophisticated approaches to estimate scale scores for tests that have been defined as having more than one content domain or construct. The confirmatory-based IRT on the two-dimensional test called the bi-factor model has been in development since the 1990’s based on a unidimensional IRT framework (Gibbons et al., 1990; Gibbons & Hedeker, 1992; Gibbons et al., 2007).
The bi-factor model was originally introduced as an extension of the Spearman’s two factors, when a test measures a general factor as well as secondary factors that the secondary are sometimes treated as group factors (Holzinger & Swineford, 1937). This model is also known as the Thurstone simple-structure second order of the general factor, and more than one factor is included in the secondary factor (Swineford, 1941; Thurstone, 1947; Schmid Jr, 1957; Schmid & Leiman, 1957). Therefore, it is certainly permissible for IRT scaled subscores to be estimated from item-patterns of two measures of ability or proficiency in both general (or primary) and secondary specific content domain. Pairing the bi-factor model and the IRT model allows a primary (or general) factor to be estimated from item responses, and that test items measure two or more mutu-ally exclusive secondary factors. It is relevant that test items with specific content domain share a common targeted domain or process skill. As the variance accounted for by the specific content do-mains increases to explain examinee’s unique abilities, the association between items within each specific content domain is expected to be greater than test items assessing the examinee’s primary ability or process skill from the primary domain. Consequently, the bi-factor model may yield more accurate test score estimates than other psychometric models when a primary and specific content domain are considered.
1.2
Scoring Subscores Based on Item Response Theory
Subscores can be estimated in several ways. The basis behind the IRT estimation is to convey in-formation provided by the characteristics of the IRT models when an examinee correctly responds to test items. In cases when the score pattern is zeros (incorrect) and ones (correct), the proba-bility of combining the score pattern on the examinee’s entire pattern of item responses portrays the joint probability between lows and highs that an examinee would respond negatively or posi-tively. Highest probability of correct is obtained to describe the IRT scale score. This method is known as likelihood estimation method and is called the Maximum Likelihood Estimate (MLE) or joint Maximum Likelihood Estimate (JMLE) of examinee proficiency (Baker, 1985; Yen, 1984; Thissen, 1982).
However, these methods are tedious and involve a lot of computing when there are a large number of examinees and/or a large number of items in a test. Also, JMLE cannot be used when responses to test items in the primary and/or in the specific content domains are all correct (i.e. a perfect score) or responses to test items in the primary and/or in the specific content domains are all incorrect. The product of the likelihood will yield positive infiniteability for an all correct pattern, and tends towards negative infiniteability for an all incorrect pattern (Baker, 1985; Baker & Kim, 2004; Hambleton & Swaminathan, 1985; Thissen & Orlando, 2001). The same problems are observed with multidimensional estimation (Reckase, 1997, 2009). JMLE and MLE estimation methods have disadvantages when the calculation involves multidimensional integration over the ability parameter, and the number of calculations involved increases exponentially with the number of dimensions.
A better estimation approach for both the UIRT and the MIRT is the Marginal Maximum Like-lihood Estimation (MMLE) sometimes referred to as the full-information maximum likeLike-lihood estimation method (Bock & Aitkin, 1981; Bock et al., 1988). This method is used to overcome inconsistent and insufficient estimation problems in MLE and JMLE. MMLE does not estimate ability parameter from the likelihood but is applied within a Bayesian framework after item pa-rameters have been estimated. MMLE is available in the IRT software, for example BILOG-MG
(Binary Logistic Model for Multiple Group) and MMLE is explained in details in TESTFACT (Croudace et al., 2005).
Another estimation method based on the Bayesian approach is the Markov Chain Monte Carlo (MCMC). The MCMC is known as a fully Bayesian approach. MCMC includes Monte Carlo in-tegration in the likelihood from the conditional probability of the IRT model using Markov chain procedures (Gilks et al., 1996). Monte Carlo integration draws samples from a target distribution for an item or examinee’s parameter, then taking the averages to approximate their expectations. Markov Chain ensures that the chosen draws are independent between chains, and the target distri-bution is at its stationary distridistri-bution. Thus, the estimated values of the item and ability parameters are both stable and invariant measures.
To reach a stationary distribution, a sequence of random events happens att+1depends only on the state at timetand not at any prior state. That is, the probability of moving to a new state is con-ditional on the current state. Stationary solution (i.e. stable or optimal parameter estimates) will behave approximately like samples from the target distribution of interest. The general MCMC estimator is called the Metropolis–Hastings Algorithm (MH algorithm) (Metropolis, 1987; Hast-ings, 1970) and the most straightforward method is the Gibbs sampling (Geman & Geman, 1984). These two MCMC methods give marginal posterior distributions of the parameters of interest.
MMLE and MCMC methods are fairly slow but this is not an issue. Computer speeds are in-creasing very rapidly. One problem with the used of MMLE in estimating item parameters from the MIRT models is that an issue needs to deal with indeterminacies for unique solution in the mul-tiple dimensions of ability parameter. A solution to the indeterminacies problem of item parameter estimations can be achieved by fixing the the ability parameter to be estimated from multivari-ate normal distribution with mean vector zero elements and an identity matrix for the variance-covariance matrix (Reckase, 2009). Whereas, common issues in MCMC are the specification of the prior distribution and convergence diagnostic. Examples for prior selection are choosing con-jugate prior and highly proper noninformative prior that would ensure the posterior distribution is returned from the same distribution, and these types of priors are more computationally efficient.
Results from the MCMC algorithm should be carefully evaluated so that the estimated item and ability values are truly representative the underlying stationary solutions.
1.2.1
Improving Reliability of Subscore Estimates
Many studies have been proposed since the late 1980’s to ensure high subscore reliability for clustered test items on specific content domains. Yen (1987) proposed the objective performance index (OPI) that is accomplished through a Bayesian IRT procedure. The OPI is utilized to produce a more stable score which is use to report scores that are separated by their test objectives. The OPI score that is based on the posterior distribution is observed to be sufficiently accurate so as to be useful for score reporting. Teachers have used the score to infer their students’ strengths and weaknesses in a particular test objective.
Subscores on specific content knowledge can also be predicted based on regression technique on subscores or Kelly’s regression for true score estimate (Kelly, 1927, 1947). Wainer et al. (2001) proposed a method called subscores augmentation which is achieved by regressing any particular subscores (e.g. algebra) on any other subscores (e.g. geometric and trigonometry). The study also implemented a multivariate empirical Bayes estimate (EB) based on the correlation among the subcales that posit associations between the subscores being observed. The performance of the EB subscores augmentation method has been further studied in a simulation study by Edwards (2002) Edwards & Vevea (2006) and studied empirically in Skorupski & Carvajal (2009) on statewide testing data. All those studies came to the same conclusions, for the test that is unidimensional in nature the proposed subscores stabilization is substantially improves the precision of the scores and produces a reduction in error of estimates as well as outperform traditional subscores (i.e. number-correct scores).
Other studies on improving reliability of the subscore estimates have been carried out by incor-porating ancillary or collateral information of other subtests information in a test into the estimation of the ability as well as item parameters. Ancillary or collateral information is a method of taking the information of the correlations between multiple abilities being measured in a test and to infer
about examinee proficiency only in the overall performance or only in the specific domain abili-ties. Similar to OPI and empirical Bayes subscores stabilization techniques, collateral information is accomplished in a sense of using items in other test objectives into a calibration of the particular item in one objective (Ackerman & Davey, 1991; Bock et al., 1997; Pommerich et al., 1999; Shin, 2007; Tao, 2009). Thus, all other test subscales are contributing to measuring one subscale, and the estimated subcsores showed greater accuracy.
Subscores are equally important for reliable scores that are associated with multiple dimensions of test batteries. As specific content area are highly correlated with each other, then reporting sub-scores is important for instructional and remedial decisions at student and school-level decisions (Sinharay et al., 2007; Haberman, 2008; Haberman et al., 2009; Puhan et al., 2010).
The application of Bayesian approach has shown improved reliability of the overall score or subscores estimates (Kolen & Tong, 2010; Wainer et al., 2001; Yen, 1987; Skorupski & Carvajal, 2009; Tao, 2009; Haberman, 2008; Sinharay et al., 2007; Ackerman & Davey, 1991; Mislevy, 1987). For example, Skorupski & Carvajal (2009) and Wainer et al. (2001) observed substantial improvement in reliability of the subscore estimates when the Bayesian approach was used to stabilized scores from one subtest by borrowing information from other subscores. This method is called the subscrores augmentation method.
1.3
Statement of the Problem
Successful studies in improving subscore reliability based on the CTT and the UIRT using infor-mation from other subtests or subdomains have raised interest in the field of psychometrics and educational measurement so as to improve subscore estimation using the MIRT models. Empirical and simulation studies have observed that the MIRT models demonstrate better improvement of subscore reliability over the CTT and UIRT approaches, and the estimated subscores provide added value in addition to the total score (DeMars, 2005; Kahraman & Thompson, 2011; Haberman & Sinharay, 2010; Sheng & Wikle, 2009; Yao, 2010; Thissen & Edwards, 2005).
Since its development that started almost two decades ago, improving subscore estimation for the multidimensional IRT is still in its infancy stage compared to unidimensional IRT approaches. Also, only the compensatory MIRT model, in which one ability can be offset by an increase in other abilities, has been considered to explain examinees’ process skills on tests with multidimensional structures. Tate (2004) studied the implication of multidimensional test structure on subscore estimates. The simulation study was to compare MLE and expected a posteriori (EAP) approaches to estimate subscores. Many of the aforementioned researchers have applied MCMC to estimate subscores. In summary, despite the issue of inefficient computing time, the studies found that Bayesian estimation techniques such as the MCMC method tends to produce subscore estimates that is feasible for test scoring and reporting. Most of the studies found that the estimated subscores based on the MIRT models are slightly better than other estimation methods from the classical test theory and the unidimensional IRT techniques.
Scoring subscores from tests with a truly multidimensional structure are emergent, but are in early development , and improving reliability of subscores from perspective of the unidimensional IRT is promisingly extended. The idea of using the empirical Bayes estimate from the unidimen-sional IRT in Wainer et al. (2001) is observed to have improved reliability on the estimation of subscores. This is performed by augmenting each subscore from all other subscores in a test with informed priors and the precision of an estimated subscore can be improved by shrinking the es-timate towards the average value so that the empirical Bayes eses-timates would be very close to the reliable true observed score.
For the bi-factor model in context of the MIRT application, the empirical Bayes estimate based on the Bayesian expected a posteriori (EAP) can be used to estimate the IRT scale subscores. As the purposes of the test entails measuring primary ability as well as specific content domain abil-ities, subscores from EAP technique can also be estimated. Unlike MLE or JLMLE methods, for the cases of all-correct and/or all-incorrect answers from a test, the EAP subscores for an exam-inee will not go to infinite values. Essentially, this method incorporates likelihood function of the item score and prior distributions from examinee parameters to estimate posterior distributions
of all elements of subscores. Empirical Bayes estimates can be applied for each subscore when it is estimated from the EAP estimation method. The EAP estimation method shrinks the sub-scores linearly toward the mean for the population and the estimated subsub-scores are proportional to their standard errors,SD[θ]. Thus, inferences about examinees proficiencies for both primary and
specific content domains can be made based on the posterior distributions.
In addition, existing literature shows effective application of the bi-factor model to clinical psychology and health related outcomes (see Gibbons et al., 2007; Reise et al., 2011, 2007). Very limited number of studies, however, have used the bi-factor model with the application from the MIRT model estimation specifically from the compensatory and partially compensatory models and almost none provide supporting evidence for subscore estimation via the partially compen-satory model. In the compencompen-satory MIRT model, deficiency in one ability can be offset by an increase in other abilities. On the other hand, in the partially compensatory MIRT model, defi-ciency in one ability cannot be offset by an increase in other abilities but sufficient levels of each measured ability are required (Ackerman et al., 2003; Bolt & Lall, 2003; Reckase, 1997, 2009).
The bi-factor models are not well established in the field of educational measurement. The studied bi-factor models in educational outcome are more prevalent as a testlet-based MIRT model (Bradlow et al., 1999; DeMars, 2006; Li et al., 2006; Rijmen, 2009, 2010) or as a hierarchical second-order IRT model (Immekus & Imbrie, 2008; Reise et al., 2007; Rijmen et al., 2008; Yung et al., 1999).
Few studies exist that provide limited information on the subscore estimation from educational assessment based on the MIRT framework (DeMars, 2006; Edwards & Vevea, 2006). Both stud-ies are simulation studstud-ies, and closely related to testlet-based approach as the true model for tests were designed to have items within reading passages, thus measurement of the primary and specific proficiency on content domains of other subject areas was not emphasized. Also, only the com-pensatory multidimensional IRT has been considered in the parameter estimation, but there are also mental tests that require partially compensatory activities to respond to test items (e.g. read-ing comprehension that requires both readread-ing comprehension and decodread-ing skills). Unpublished
empirical paper by DeMars (2005) observed the bi-factor model within the MIRT framework but the proposed model was not clearly specified. The implication of the application of the bi-factor model with the existing multidimensional IRT models in subscore estimation is not fully developed or studied. Therefore, further studies in this direction can be promising for improving reliability of subscores estimation. Moreover, solutions about the accuracy of the parameter estimations from the bi-factor MIRT models can be examined.
Not many studies have focused on the Bayesian approach to improving subscore estimations for a test with multidimensional structure as well as to infer about examinees primary and spe-cific abilities. Recent studies (e.g. de la Torre et al. 2011; Edwards & Vevea 2006; Rijmen 2010; Tao 2009; Yao 2010; Babcock 2011) have revealed very limited amount of information on the bi-factor model with the confirmatory compensatory and the confirmatory partially compensatory multidimensional IRT. Consequently, none of the studies have provided sound methods for simul-taneous estimation of the primary and specific domain abilities using the bi-factor confirmatory compensatory and the bi-factor confirmatory partially compensatory MIRT models to improve the precisions of the subscore estimates.
1.4
Purpose of the Study
Given the need for improving reliable subscores, and a paucity of attention to estimating subscores based on the Bayesian estimation from the confirmatory compensatory and the confirmatory par-tially compensatory multidimensional IRT models that are paired with the bi-factor model, this study proposes two models to improve the reliability of subscore estimates from the bi-factor con-firmatory compensatory and the bi-factor concon-firmatory partially compensatory multidimensional IRT. In addition, these models are proposed in such as way they can be promisingly extended from the unidimensional IRT and the bi-factor model. The Bayesian estimation approach is soundly suggested to be the most dependable estimation procedure available to produce reliable subscores. There are four objectives for this study – 1.) to propose the bi-factor confirmatory
compen-satory and the bi-factor confirmatory partially compencompen-satory MIRT models for improving the re-liability of subscore estimates; 2.) to evaluate how well the proposed bi-factor confirmatory com-pensatory and the partially comcom-pensatory MIRT models perform in terms of Bayesian parameter estimation accuracies under various parameter conditions; 3.) to compare model-data fit within each of the bi-factor confirmatory MIRT model in terms of Bayesian complexity and fit under various parameter conditions of the hypothesized true model; and 4.) to quantify the estimated subscores from the bi-factor confirmatory compensatory MIRT model and the estimated subscores of the bi-factor confirmatory partially compensatory MIRT model.
In general, how would a bi-factor model be specified in confirmatory compensatory and confir-matory partially compensatory MIRT models and how would the subscores from both models be interpreted were inquired. The primary research questions for a simulation in this study were:
1. How well do the proposed models perform in recovering item and examinee parameters under various simulation conditions?
2. How would the parameters estimated from the bi-factor confirmatory compensatory MIRT model and the parameters estimated from the bi-factor confirmatory partially compensatory MIRT model be different in terms of mode-data fit under various conditions of the hypothe-sized true model to achieve reliable subscore estimates?
3. How well can the reliability and classification (validity) of the Bayesian subscores be esti-mated from both models?
1.5
Hypotheses
The bi-factor confirmatory compensatory and partially compensatory MIRT models are straight-forwardly specified from the definitions of the multidimensional IRT framework and the bi-factor model. Procedures for subscore estimation using Bayesian approach are described in Chapter 3. Hypotheses to align research questions (1) through (4) are as follow:
1. Each of the proposed models performed well in recovering item and examinee parameters under various simulated conditions from the true models.
2. Subscores estimated from the proposed models can be mutually described based on the model-data fits of the parameters from the bi-factor confirmatory compensatory or from the bi-factor confirmatory partially compensatory MIRT modesl when reliability of the sub-scores is improved.
3. Subscores estimated from the bi-factor confirmatory compensatory MIRT model with Bayesian estimation approach and/or subscores estimated in the bi-factor confirmatory partially com-pensatory MIRT model with Bayesian approach have increased reliability when subscales of the specific content domains are uniquely separated from the primary domain.
1.6
Definitions of Variables
The definitions of terms that are used in this study are summarized as following:
Subscores
• Scores that are derived from subtests and make-up part of an overall test score.
Confirmatory Multidimensional Item Response Theory Model
• A model of Item Response Theory (IRT) signifies multiple dimension items and person parameters that have a clear hypothesis for the structure of the item response dataa.
Compensatory Multidimensional Item Response Theory Model
• A model of Item Response Theory (IRT) which signifies a linear combination of multiple dimensions of item and ability parameters. The linear combination is an additive in nature. Thus, an examinee with low ability in one of the dimensions being measured compensates by having higher ability on the other dimensionsa.
Partially Compensatory Multidimensional Item Response Theory Model
• A model of Item Response Theory (IRT) which signifies a nonlinear combination of multiple dimensions of item and ability parameters. The nonlinear combination is a multiplicative in nature. Thus, scoring high on one dimension of ability cannot compensate for scoring low on an other abilitya.
Bi-factor Model
• A model signifies one primary factor or general targeted skill, and allows for one or more orthogonal secondary factors or specific content domains.
Bi-factor Multidimensional Item Response Theory Model
• A model of compensatory or partially compensatory multidimensional IRT which signifies a linear or nonlinear combination of primary and orthogonal specific dimensions of item and ability parameters.
Note. aDefinition adopted from Reckase (2009).
1.7
Summary and Significance of the Study
The motivation for investigating the efficacy of the studied models in estimating subscores are that the estimated subscores could provide diagnostic or quality information for test users and stake-holders, and thus could be useful for practical purposes. As the subscores estimated from the
studied models established reliability and validity for comparability, subscores may be reported cautiously as for diagnostic purposes, teacher accountability evaluations, and curriculum effective-ness evaluations.
Simultaneous consideration of the multiple dimensions of the examinee’s abilities and item characteristics should be considered as one of the major concerns when reporting subscores. Thus, the uses of the appropriate sophisticated approaches that used in this study are important to gather as much information as possible in reporting reliable and valid subscores. The sophistication of the models are applied to obtain the most accurate measurement possible of the mental abilities of the examinees, which requires accurate measures of precisions for informed judgment and future remedial actions.
Chapter 2 reviews various existing studies on subscore estimation methods and reliability of the estimated subscores. The item response theory framework and the bi-factor approach for subscore estimations are discussed. Also, challenges from the perspectives of the model construction and application are briefly presented. Considerable works of research and studies that have been done in the multidimensional item response theory and the bi-factor models are highlighted.
Chapter 3 defines the studied models specifications from the bi-factor compensatory and par-tially compensatory multidimensional IRT. Then, simulation study designations from the studied models are explained. Evaluation criteria that are for the simulation study and evaluation criteria for the scoring procedures based on the studied models are addressed. Chapter 4 demonstrates results from the simulation study and Chapter 5 is devoted for discussion and conclusion.
Chapter 2
Literature Review
This chapter begins with a prevalent technique on improving the precision of subscore estimates based on a regression approach that is known as Kelly’s regression for true score estimate (Kelly, 1927, 1947). An extension of Kelly’s regression technique is followed by a discussion of the idea of an augmented subscore - that is, it is introduced as a multivariate version of Kelly’s regres-sion (Wainer et al., 2000, 2001). Other approaches for subscore estimations to improve reliability and validity are briefly summarized. Then, studies on multidimensional techniques for subscore augmentation and studies on the bi-factor model for general and specific subscore estimations are discussed. Research findings on comparisons of existing subscore estimation techniques are also presented throughout the chapter. Finally, arguments about the multidimensional item response theory (MIRT) with the bi-factor model as another promising approach to estimating reliable sub-scores are discussed as well as adaption of issues related to subscore estimations that are presented in the literature .
2.1
Regression Approach of Subscore Estimates
Kelly’s univariate regression (Kelly, 1927, 1947) can be written as
b
in which an estimated true score,τb, is improved by shrinking the observed score,x, toward the group mean, µ, by an equal amount of reliability, ρ. The first part of the Kelly’s regressed score
in Equation 2.1.1,ρx, tells that the estimated true score retains a reliable score and the second part,
(1−ρ)µ is to remove the unreliable score by regressing it toward the group mean. Thus, this
approach improves the reliability of the true score by using the group mean. As the estimated observed score becomes increasingly reliable, the estimates of true score would be very close to the observed score. In contrast, as the estimated observed score becomes less reliable, the estimates of the true score would shrink toward the group mean.
Using the information from the rest of the test to improve the precision of the estimates is anal-ogous to the empirical Bayes estimation (EB) (Wainer et al., 2001; Yen, 1987) based on ancillary information to increase the precision of subscore estimates. When a sample mean estimate,x, and a sample reliability estimate,r, are substitute into Equation 2.1.1 above and rearrange the equation, that is
b
τ=rx+ (1−r)x.=x.+r(x−x.),
thus, this Kelly’s univariate regression of true score on observed score can be generalized for multivariate cases such that
b
τ=x.+B(x−x.), (2.1.2)
wherex.is a vector of subscale means, xis a vector of subscale scores andBis the matrix of the reliability based weights. Thus, τbis an improved estimate of the subscale true scores based on the examinee’s performance for each subscale and performance on the other subscales. Recall that the index of reliability,ρ, can be defined as the proportion of true score variance relative to
the observed score variance and is directly estimable from the data, for example by using the Split Half method and Cronbach’s coefficient alpha. Thus,Bcan be estimated from the product of the true score covariance matrix to the inverse of the observed score covariance matrix, that is
B= ∑ t ∑ −1 x where ∑ t
is the true score covariance matrix and ∑−x1is the inverse of the observed score
covariance matrix. As shown by Wainer et al. (2001), this is the conventional notation for matrix of regression coefficients, that the weights for a linear combination of the deviance scores are used to best estimate the subscale scores,τb. The multivariate reliability-based weights, B, can also be
defined as the multivariate index of reliability and thus can be directly estimated from data: ∑
t
can be estimated by the covariance matrix of the true score,St, and∑−x1can be directly estimated
by the covariance matrix of the observed score,Sx. ForSt, it can be computed from the estimated
observed scores covariance matrix, element-wise using
Sddt 0 =Sddx 0ford6=d0
and
Sddt 0 =ρdSddx 0ford=d0
where St
dd0is thedd
0element in the covariance matrixS
t andSddx 0 is the dd0element of the co-variance matrixSxandρdis the reliability of the subscore d. In addition, it is known that the lower
bound of reliability is a customary from the Cronbach’s coefficient alpha,α, and is shown as
ρ ≥αb= n n−1 " 1−∑ n j=1σy2j σx2 # ≡ σ 2 t σx2, (2.1.3)
where nis the number of items on the subscale. Cronbach’s alpha is calculated from the ob-served item variances,σy2j, and total test score variance,σx2, and thus it is computational equivalent
to the ratio of true score variance to the total score variance (Crocker & Algina, 1986).
Suppose there are two variables, y1andy2 that are multivariately-normally distributed, that is notationally:
y1 y2 ∼MV N µ1 µ2 , ∑11 ∑12 ∑21 ∑22
Then, using this standard analogy, assuming that the true score, τ, and the observed score x,
follow a multivariate normal distribution with a common mean,µ, that is notationally:
τ x ∼MV N µ µ , ∑t ∑t ∑t ∑x .
Following Equation 2.1.2and substitutesB=∑t∑−x1into the equation, the empirical Bayes
es-timate of the vector of true subscale scores for examineei,τiis
E(τi|xi) =µ+ ∑t
∑x
−1
(xi−µ) . (2.1.4)
For perfectly a reliable test, that is whenρ =1, the empirical Bayes estimate of the true score
is equal to the observed score. Consequently, for a perfectly reliable test containing subscales, that is whenB=I, whereIis the identity matrix, the empirical Bayes estimate of the vector of the true subscale scores is equal to the observed subscale scores. When the error of measurement increases, the second term in Equation 2.1.2 shrinks toward zero and thus the best estimate of the true score is the mean over all examinees. By adapting the reliability index in Equation 2.1.3, the estimate of the subscale reliability can be computed as the ratio of the true score variance of thedthsubscale to the estimated true score variance of thedthsubscale and can be written as
ρd2= add
cdd (2.1.5)
whereadd is the true score variance of thedthsubscale, which is the diagonal element of the
matrix,
andcddis the estimated score variance of thedthsubscale, which is the diagonal element of the matrix,
C=StS−x1St.
The estimate of the reliability in Equation 2.1.5 has shown to be positively biased (Edwards, 2002). Instead, Edwards (2002) and Edwards & Vevea (2006) recommended reliability for the augmented subscore to be computed from the diagonal element for the numerator of
A?=St−St(Sx)−1St,
and the diagonal element for the denominator is taken from the true score matrix, thus,
b
ρd2=1−
a?dd
stdd. (2.1.6)
2.2
Subscore Augmentation from IRT Scale Score
Many large-scale testing programs used the IRT scale score for viable scoring and score reporting, as the IRT scale scores can be computed from items that have more than one category and the scores are comparable across test forms. As the IRT models provide useful properties for subscore augmentation, Wainer et al. (2001) proposed that the same technology of the empirical Bayes estimate be applied to the IRT scale score estimate of latent ability,θ, like the maximum a posteriori
estimate(MAP[θ])or expected a posterior estimate(EAP[θ]).
The value of MAP[θ] and EAP[θ]can be computed for each examinee for each subscale.
MAP[θ]and EAP[θ]are two estimates that are analogous to the Kelly’s regressed estimates. As
the Kelly’s regressed estimate shrinks linearly or proportionally toward the group mean, MAP[θ]
and EAP[θ]estimates shrink toward the mean proportional to their variance. Therefore, MAP[θ]
informa-tive and MAP[θ]and EAP[θ]estimates shrink less when there is more information in the response
patterns.
Refer EAP[θd](orMAP[θd]) to the IRT scale score of response-pattern or summed-score for
subscaled. Assuming that the mean subscore for each subscale is zero. For a well-constructed test, the variability in the precisions of the linear combination of EAP[θ]s (or MAP[θ]s) is relatively
very small and thus can be ignored (Wainer et al., 2001). Therefore, for subscore augmentation from these IRT scale score estimates, an EAP[θ](or MAP[θ]) can be treated as observed scores.
Then, by the analogy with Kelly’s regression
EAP[θd]≈ρdEAP?[θd] (2.2.1)
where ρd is an estimate of reliability of subscale d, EAP?[θd] is the hypothetical IRT scale
estimate from the EAP estimate of the latent variable on subscaleθd. Note that, EAP?[θd]is not
regressed toward the mean but the value of EAP?[θd] is identical to the observed summed score
for subscaled. Solving Equation 2.2.1
EAP?[θd]≈
EAP[θd]
ρd
(2.2.2)
The denominator of Equation 2.2.2) is the marginal reliability, and as proposed by Green et al. (1984). This marginal reliability can be estimated from
b
ρd =1−σ¯e2. (2.2.3)
¯
σe2in the above equation can be computed from
¯
σe2= ˆ
E σe2φ(θ)dθ,
whereE σe2=∑all xσe2L(x|θ)and xis the summed score, and L(x|θ) is the joint likelihood
subscaled is then computed by substitutingρbd into Equation 2.2.2 above.
Similar to the observed score variance-covariance matrix,Sx, of the Kelly’s regression
tech-nique, the element in the variance-covariance matrix of that observed EAP?[θd], that is notated as
SEAP, among the original IRT scale scores is corrected and can be computed from
Sxdd0= SEAPdd0 ρdρd0 ford6=d0 and Sxdd= S EAP dd0 ρd2 for d=d0
Thus, for examinee i, the empirical Bayes estimates of the IRT scale scores can be computed from Equation 2.2.4 below. This is analogous to Equation 2.1.4 presented above.
ˆ
EAP[θ] =EAP[θ].+B?(EAP?[θ]i−EAP[θ].) (2.2.4)
where for examineei, EAP?[θ]iis the vector of IRT scale scores for the subscale, EAP[θ].is
the average vector of the IRT subscale scores, EAPˆ [θ]is the vector of empirical Bayes estimate
of the IRT scale scores and B?=St(Sx)−1. To simplify, the diagonal elements in the vector of reliability-based weights can be computed as
bdd0= b
?
ρd0
,
that the weightsbdd0 for subscaledis regressed on subscaled0inB?. The augmented estimates from the original values ofEAP[θ]can be computed from the weightsB.
Another approach to subscore augmentation is similar to the Wainer et al. (2001) by means of using an empirical Bayes procedure that is proposed by Yen (1987). The procedure is to pool per-formance on particular items representing some specific test objective from the overall examinee’s performance. This procedure is a basis of the objective performance index (OPI) and is used for
some tests published by CTB/McGraw-Hill. The OPI approach is closely related to Wainer et al. (2001) discussed previously. Wainer et al.’s and Yen’s methods for the subscore augmentation are different that Yen’s procedure which is based on the binomial distribution of the scores whereas Wainer et al.’s is based on the normal distribution that forms the basis of the Kelly’s regressed true score estimates (Kelly, 1927, 1947).
Unlike Yen’s OPI procedure, the Wainer et al.’s subscore augmentation can be extended for multivariate cases and, thus, it is well suited for a test that is truly multidimensional. In other contexts, such as to improve subscore estimations, is by means of using the collateral or auxiliary information in the IRT about the examinee. Collateral information is adaptively measured in a test. The information is an item provided to explain secondary ability of separate content areas (Acker-man & Davey, 1991). According to Stout et al. (2003), collateral information refers to additional estimation information derived from variables that are distinct from, but correlated with, the stud-ied relevant variable of interest. Collateral information describes a dominant activity or process and is useful for item calibration that could provide practical important gains in item calibration accuracy.
Auxiliary information sometimes referred to as ancillary information, can be any related fac-tors on the test that are correlated with the latent proficiency such as age, courses taken, years of schooling, grade obtained and even family background (Mislevy, 1987; Wainer et al., 2000; Wang et al., 2004). Collateral information has not been adopted sensibly from the contexts presented by Ackerman & Davey (1991) and Stout et al., (2003). However, augmentation with auxiliary infor-mation is treated as “collateral inforinfor-mation” in many recent studies to improve subscore estimates (e.g. Tao (2009)). As there have been so many broad perspectives of collateral (or auxiliary) in-formation adopted, subscore augmentation can be a special case of using collateral (or auxiliary) information to improve score precision. Therefore, collateral or auxiliary information can be any of the factors that are correlated with the objectives of a test.
For a firm definition, de la Torre & Hong (2010) described these two terms as out-of-test collateral information and in-test collateral information. The out-of-test collateral information
is similarly defined from the context of Mislevy (1987) and Wang et al. (2004) as any demographic educational variable. For example, NAEP uses the out-of-test collateral information from student and school characteristics to obtain scores that are more accurate for various subpopulations of students. The In-test collateral information is analogous to the context of ability estimation in the IRT framework by Ackerman & Davey (1991) and Stout et al. (2003) which is inherent information that can be found in the examinees’ item responses, specifically, responses to other test domains. Studies have shown that, for the IRT ability estimation, incorporating in-test collateral information in the scoring process has improved the precision of ability estimates (Wainer et al., 2001; Yen, 1984; de la Torre & Patz, 2005; de la Torre & Song, 2009; Wang & Gao, 2010).
2.3
Mutidimensional IRT Subscore Estimation
Much attention has been given to MIRT models to their abilities to improve subscore estimates, and the consequences for scoring and score reporting. Due to several variants of multidimensional item response theory (MIRT) models, this is a lack of solid operational research on these variants and there are limited options for IRT software for carrying out item calibration and parameter estimations. MIRT models allow high ability in one dimension to compensate for low ability on other dimensions, which is much more common, and such a model is called the compensatory MIRT model. For the noncompensatory model (no such compensation), high probability means high ability for all dimensions (Reckase, 1997, 2009).
Application of MIRT models is also being considered in a great deal for exploratory and con-firmatory types of analysis. According to Reckase (2009), the MIRT is still in its developmental infancy, and making important advances in the procedures could lead to a better understanding of test functions in multidimensional space of ability and cognitive proficiencies. Thissen & Edwards (2005) introduced a simultaneous estimation procedure with a potential solution using the Markov Chain Monte Carlo methods (MCMC) for the constrained MIRT model. MCMC estimation for IRT (2PL and 3PL) was proposed by Patz & Junker (1999a) and Patz & Junker (1999b) without
using data augmentation as the studies used Metropolis-Hasting with Gibbs sampling. Thissen & Edwards (2005) and Edwards (2010)applied a data augmentation strategy that relied upon the Gibbs sampling (Geman & Geman, 1984) approach for the three-parameter normal ogive model and Samejima (1969) graded response model. The MCMC method produced efficient estimates of subscores for sets of items that are or are not mutually exclusive. Although the studies observed the MCMC simulation for more complex model is a bit longer than accustomed waiting time for most researchers, the MCMC simulation provides the entire posterior distribution of every parameter, and not just a point estimate and standard error, which can then be used for further evaluation of the parameter estimates.
A study by de la Torre & Patz (2005) which was based on the 3PL-MIRT model of Reckase (1997) and Reckase (2009) and estimated within a Metropolis-Hastings of the MCMC algorithm (Chib & Greenberg, 1995; Gilks et al., 1996) which is closely related to empirical Bayes approach Wainer et al. (2001). The study focused on correlated ability, and multidimensional scores could be used to inform finer-grained reporting such as skills profiles and objective level scores. The study defined a multidimensional approach to simultaneous ability estimation that can be viewed as a more general framework and straightforward for obtaining expected a posteriori estimates of ability. Note that the study applied the 3PL-MIRT model from Reckase (1997) and Reckase (2009) and assumed hierarchical ability estimates. Thus, there is no assumption about the compensatory or noncompensatory approach.
From the same study, ability from the hierarchical model can be estimated from the multidi-mensional expected a posteriori (EAP-M), and all together can be computed by adding up EAPs across the number of dimensions of ability over thousands of the MCMC iterations. Pearson cor-relation and mean squared error (MSE) were used to evaluate the correspondence between the estimated and the generated abilities. Unlike Wainer et al. (2001), de la Torre & Patz (2005) did not use the marginal reliability in Equation 2.2.3 above. Instead, reliability of subscaledis defined to analogous Wainer’s et al. (2001) “MAP[θ]” approach of response pattern estimates of subscore,
ˆ
ρd=
var(EAP[θd])
var(EAP[θd]) +Pvar(EAP[θd])
wherePvar(EAP[θd])is the average posterior variance of ability estimates in subscaled. The
study defined the corrected covariance matrix for reliability as
Sc=Su−D
where Su is the covariance matrix of the unregressed ability estimate EAP?[θd] (as in the
Equation 2.2.2 above) and is analogous to Sx (i.e. the observed score variance-covariance ma-trix of Kelly’s regression technique), and D is the diagonal matrix whose dth nonzero entry is (1−ρˆd)Sudd. Thus, the empirical Bayes estimate for examineeiis given by
EAPhθ(1)
i
i=EAP[θ].+S
c(Su)−1
(EAP?[θ]i−EAP[θ].). (2.3.1)
The study compared the empirical Bayes estimates,θ(1), in Equation 2.3.1 above with the
abil-ity estimates obtained using simultaneous estimation,θ(0), from the EAP-M method explained in
the paper. The correlation between EAP-M of the simultaneous estimation via MCMC is almost perfect, even with the worst simulation conditions, with the estimate from EAP the Equation 2.3.1 above. The difference in the MSE between the two methods is very small up to three decimal places. They observed thatθ(0) is slightly better thanθ(1)as the simultaneous estimation of
sub-scores via MCMC produced smaller error and standard error than the approach taken by Wainer et al. (2001).
Estimating subscores from the multidimensional IRT is not always straightforward. Subscores can be estimated from the three-parameter logistic MIRT model with oblique simple-structure (Thurstone, 1947) for a common factor model and the bi-factor model (Gibbons & Hedeker, 1992). This study also demonstrated important features of graphical representations of the subscore to provide multivariate profile plots and competency areas from the estimated subscores that may be useful for examinee’s diagnostics feedback.
2.4
Bi-factor Model as a Confirmatory MIRT Model
The idealization of the MIRT model to fitting in multiple dimensions of examinee proficiencies and items responses is related to testing conditions in which the test is not strictly unidimensional due to various item contents, complex underlying constructs, and different item types. The MIRT model is an extension model of factor analysis that occupies two major schools of thoughts – the Spearman’s two-factor theory and the Thurstone’s simple structure of multiple factors of primary abilities. Modernized MIRT models in psychometric and psychology framework designed a plausible model to exhibit a general factor and multiple specific factors. The bi-factor factor analysis(Holzinger & Swineford, 1937) which is the special case of hierarchical and higher order factor analysis is merely an extension of Spearman’s two-factor model. The bi-factor model for mental tests and psychological measures conceived item loadings on the general factor plus additional specific domain factors.
The term “bi-factor” largely appears in confirmatory factor analysis (Jöreskog, 1969), but it is straightforward to conceive at the item-level pattern (Muthén, 1989). McLeod et al. (2001) and Reckase (2009) translated the associated factor analysis parameters into their multidimensional IRT analogs. Pairing the bi-factor model with the IRT model was first illustrated in 1990 for selected items from an ACT natural science test in Gibbons et al. (1990). The technical report then appeared in the 1992 Psychometrika journal extending the bi-factor IRT model to the psychiatric symptom rating scale (Gibbons & Hedeker, 1992). The focus of the research was on binary items in the unidimensional ability continuum. For constructed response items, Gibbons and colleagues actively developed the bi-factor unidimensional IRT model a decade and a half later for Samejima’s graded response model (e.g. see Wainer et al., 2001).
The bi-factor model represents all underlying items to have positive loadings, which are similar to the positive regression coefficient on a general trait. Typically the general trait will be concep-tually broader and is used in scaling individual proficiency, process, or target skill. In addition, an item can load on zero, one, or more within a cluster of items that measure specific content domains or “group” or “method” related factors. These factors are assumed to be orthogonal to each other
(Gibbons & Hedeker, 1992; Gibbons et al., 1990; Reise et al., 2007, 2010; Cai, 2010).
A series of studies in Reise et al. (2007), Reise et al. (2010) and Reise et al. (2011) applied the bi-factor model to the Consumer Assessment of Healthcare Providers and Systems (CAHPS©2.0) survey instrument and personality assessments. The studies focused on the examination of the distortion of the item discrimination parameter due to local dependencies caused by the secondary influences. The study also suggested the bi-factor model as evidence in forming subscales as each item set was an adequate indicator of its respective construct, albeit the correlation between di-mensions was moderate to large (r=.60 ) in the exploratory factor analysis, and r=.74 in the confirmatory analysis). The studies concluded from the bi-factor analysis that the results showed clearly that each dimension was, in fact, confounded by both general and specific sources of vari-ance that might not be detected in the MIRT solutions.
The MIRT bi-factor model has received less attention in the literature. One study demonstrated a simulation study on 2,000 examinees as well as an empirical example on 5,000 examinees for math and reading tests from the Programme for International Student Assessment 2000 (PISA 2000) by DeMars (2006). The study compared the multidimensional bi-factor IRT model with testlet-based models, where the application of testlet-based models can be found in Li et al. (2006) and Bradlow et al. (1999) and testlets-as-polytomous-item model in Lee et al. (2001) and Sireci et al. (1991). Those studies focused on the investigation of the effects of number of items for each dimension, number of dimensions, and correlations between dimensions on ability estimates.
Gibbons & Hedeker (1992), Gibbons et al. (2007) and Gibbons et al. (2009) examined instru-ments in the Psychiatric Diagnostic Screening Questionnaire (PDSQ) and Post-Traumatic Growth Inventory (PTGI). The studies investigated that the multidimensional bi-factor IRT model provides more homogenous results and more reliable estimates of the underlying dimensions than the uni-dimensional Samejima’s graded response model. Also, Immekus & Imbrie (2008) observed that modeling the bi-factor model within an IRT framework is feasible for a confirmatory-based method to collect construct validity evidence of obtained scores.
Torre & Song (2009), Edwards (2010), Shin (2007), Stone et al. (2010), Tao (2009), Tate (2004), Yao (2010), and Sheng & Wikle (2009) showed improvement in parameter estimations as well as subscore estimates. Edwards (2010) revealed that posterior distributions of ability estimates from the multidimensional bi-factor model provide the flexibility to add additional features and com-plexities of the multidimensional test structure for study. In the study, the author suggests more research is needed to determine the effect of the strength of prior distributions for items and ability parameters besides the models that are problematic with the current “gold standard” estimators. Unlike MCMC, a non-Bayes estimator such as full-information maximum likelihood with EM al-gorithm estimator (FIML-EM), for example in Gibbons & Hedeker (1992), Gibbons et al. (2007), Immekus & Imbrie (2008) and Rijmen (2010), is problematic in that the method performed in-adequately when confronted with problems requiring high dimensional numerical integration and multiplication of the probability matrices in the bi-factor model. Thus, the Bayesian approach is a promising estimation alternative method for the bi-factor model within a multidimensional item response theory framework.