Measurement of the Higgs boson mass with the ATLAS detector
F. M. Garay Walls, on behalf of the ATLAS Collaboration1,a
1The University of Edinburgh
Abstract.A summary of the latest results on the combined measurement of the Higgs boson mass in theH → ZZ∗ → 4land theH →γγdecay channels with the ATLAS detector is presented. The analysis uses 25 fb−1 of pp collision data recorded by the ATLAS detector at the CERN Large Hadron Collider at centre-of-mass energies of 7 TeV and 8 TeV during 2011 and 2012. The combined measured value of the Higgs boson mass ismH=125.36±0.37 (stat)±0.18 (syst) GeV.
1 Introduction
Since the discovery of the Higgs boson by the CMS and ATLAS collaborations in July 2012 [1, 2], many efforts have been made to measure the Higgs boson properties. The measurement of the mass is important, since it is required for the calculation of electroweak observables and to test the SM coupling structure.
The ATLAS detector previously measured the Higgs boson mass, with the same data quoted here, at mH=125.5±0.2(stat)+−00..56(syst) GeV with a signal strength, defined as the number of observed events normalized to the SM prediction, ofμ=1.33+0.21
−0.18[3].
An updated and improved mass measurement was done in theH → ZZ∗ →4land theH →γγ decay channels. The new result is based on an improved calibration for photons and electrons, new corrections to the muon momentum uncertainty and improved analysis techniques. A summary of the updated mass measurement using these channels is presented this proceedings. For more details see reference [7].
The outline of this proceedings is the following. Section 3 summarises the improvements to the photon and electron calibration. Section 4 summarises the improvements to the muon momentum uncertainties. Sections 5 and 6 discuss the results of the Higgs mass measurements fromH → γγ andH → ZZ∗ → 4l decay channels separately. Finally, section 7 presents the combined mass measurement result.
2 The ATLAS detector
The ATLAS detector is one of the four detectors at the Large Hadron Collider (LHC) at CERN in Geneva, Switzerland. It is a multipurpose detector [4] with a cylindrical shape. It is composed, from inside to outside, of the beam pipe, the inner detector (ID), the calorimeter system and the muon spectrometer.
ae-mail: francisca.garay.walls@cern.ch C
The ID is immersed in a 2T magnetic field and is composed of the pixel detector, the semiconduc-tor tracker (SCT) and the transition radiation tracker (TRT), providing tracking up to|η|<2. Its main purpose is to measure the tracks of charged particles and to provide electron identification.
The calorimeter system is composed of the electromagnetic (EM) and the hadronic calorimeter and its purpose is to measure the energy of the incoming particles. The electromagnetic calorimeter is a lead/liquid-argon sampling calorimeter with an accordion geometry. It is divided into the barrel section which covers the pseudorapidity range of|η| < 1.475 and two end-cap sections covering 1.375 < |η| < 3.2. There is also a thin pre-sampler layer, covering |η| < 1.8, used to correct for fluctuations in upstream energy losses. The hadronic calorimeter is a large array of steel absorbers and scintillator tiles covering the range of|η|<1.7. The hadronic end-cap calorimeters uses copper and liquid argon absorbers which covers a region of 1.5 < |η| < 3.2. A forward calorimeter using copper and tungsten absorbers with liquid argon completes the calorimeter coverage up to|η|<4.9.
Finally, the muon spectrometer (MS) measures the deflection of muon tracks using precision drift tubes and cathode strip chambers with a coverage of|η| <2.7. It is immersed in toroidal magnetic fields in the central and end-cap regions having an integral of approximately 3 Tm to 6 Tm respec-tively.
3 Improvements in photon and electron calibration
Photon and electron candidates are reconstructed from clusters of energy deposited in the EM calorimeter. A candidate is identified as an electron if the energy clusters match with a track from the ID that is consistent with an electron that was produced at the interaction point. A candidate is identified as an unconverted photon if the energy clusters are not matched with a track in the ID. If the energy clusters of the photon are matched to a track in the ID originated from photon conversion it is identified as a converted photon.
An improved calibration scheme based on a multivariate regression algorithm was developed for precision measurements of electron and photon energy from data and simulation, as described in reference [6]. In addition, other studies were made: an intercalibration of the longitudinal layers of the calorimeter was performed from data, a measurement of the detector material achieving an improved simulation, a simulation-based calibration and a measurement of the energy scale from Z boson decays. Independent checks were performed using J/Ψ → e+e− andZ → l+l−γ samples (l=e, μ). These studies were based on the √s=7 and √s=8 TeV data.
The multivariate regression algorithm gave a 10% improvement for the expected mass resolution in theH → γγchannel compared with previous measurement [5]. The calorimeter response was found to be stable with respect to time and pile-up to 0.05%. The uncertainty on the intercalibration of the calorimeter layers varies from 1% to 2% and the relative calibration of the presampler gave an uncertainty of better than 5%. The uncertainty on the material in front of the EM calorimeter was found to be between 0.03 to 0.05 radiation lengths and the material is well described by simulation.
The final uncertainty on the electron energy scale depending onETvaries from 0.03% to 0.2%, as shown in Figure 1, giving a 6% to15% improvement with respect to previous results. The final energy uncertainty of a converted (unconverted) photon varies from 0.18(0.19)% to 1(1.35)%. Figure 1 also summarises the cross-checks of the electron energy scales fromJ/Ψ→e+e−andZZ→e+e−samples after the full calibration procedure was applied.
4 Muon momentum improvements
The muon momentum scale was measured using data [8]. The uncertainties were improved with respect to the previous measurement by use of 6 MJ/Ψ→ μ+μ−events and 9 MZ → μ+μ−events
Figure 1. Difference,ΔScale, between the measured electron energy scale and the nominal energy scale as a function ofETfor the region 0.60<|η|<1.37 [6]. The points in black (red) show theZZ→e+e−(J/Ψ→e+e−)
events used. The uncertainty on the nominal energy scale for electrons is show in the shaded area.
in the simulation correction procedure. Cross-checks were done using aΥ → μ+μ−sample. After applying corrections, the momentum scale uncertainty varies from 0.04% to 0.2% depending onη. Figure 2 shows the ratio of the reconstructed dimuon invariant mass for data to the corrected mass in simulation forJ/Ψ,Υand Z events as a function ofηof the higherpT muon. These studies show the validity of the corrections and of the associated systematics in the range 6<pT <100 GeV.
Figure 2. Ratio of the reconstructed dimuon invariant mass for data to the corrected mass in simulation for J/Ψ, Υand Z events as a function ofηof the higher pT muon [8]. The error bars on the data points show
5 The
H
→
γγ
mass measurement
TheH → γγdecay channel provides a good sensitivity to the Higgs boson mass due to an excel-lent mass resolution (1.7 GeV on average) in the diphoton final state. The main background is the continuumγγproduction with smaller contributions (20%) fromγ+jetand dijet processes.
Each event is required to have two isolated high energy photons. The diphoton invariant mass is calculated using the measured photon energies, primary vertex (using calorimeter pointing informa-tion) and impact points in the calorimeter. The signal is modelled by a sum of a Crystal Ball function for the bulk of the events and a wide Gaussian distribution for the far outliers in the mass distribution.
5.1 Improvements on the mass measurement
A new event categorisation was implemented to improve the mass measurement uncertainty [7]. Se-lected events were separated into 10 mutually exclusive categories having different signal to back-ground ratios, diphoton invariant mass resolutions and systematic uncertainties. The categorisation was optimised to minimise the expected uncertainty on the mass measurement assuming a SM Higgs boson signal, also taking into account systematic uncertainties. This categorisation provided a 20% reduction in the expected statistical uncertainty compared to the inclusive measurement.
The background was obtained directly from a fit to the diphoton mass distribution in the data over the range 105-160 GeV after final selection. The functional form selected was optimised [7] and it was chosen from different analytical functions to have the smallest number of free parameters. For the highpTt categories an exponential function was used in mass and for the rest (6 other categories) an exponential of a second order polynomial in mass was used.
Finally, the improved electron and photon energy calibration was used. A 20% reduction of the expected statistical uncertainty was achieved compared with the previous measurement.
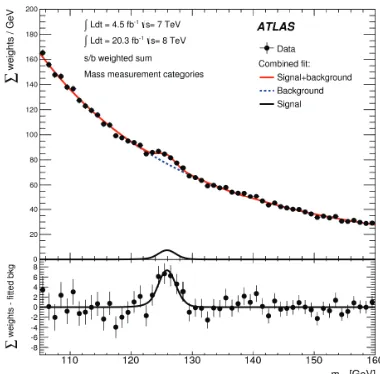
The mass measurement method used is the simultaneous fit of the mass spectra from the ten categories using an unbinned maximum likelihood fit. The parameters of interest are the Higgs mass and the signal strength (the yield normalized to the SM prediction). Figure 3 shows the result of the simultaneous fit to the data over all categories.
5.2 H→γγresults
The measured Higgs boson mass in the H → γγ decay channel ismH = 125.98±0.42 (stat)± 0.28 (syst) GeV. The first error represents the statistical uncertainty and the second the systematic uncertainty. The signal strength obtained isμ=1.29±0.30 which is consistent with the SM prediction within uncertainties.
From the previousH → γγmass measurement,mH =126.8±0.2 (stat)±0.7 (syst) GeV [3], a change in the central value is seen. However is consistent with the expected change (−0.45±0.35 GeV) and it is due to the improved electron and photon energy calibration. The statistical uncertainty increased with respect to the previous result. This is due to the decrease of the signal strength from the previous result (μ=1.55), to the change in the categorisation (there is a 4% increase in the statistical error) and due to statistical fluctuations (the expected error for a signal strengthμ = 1.3 is 0.35 GeV, but 16% of the pseudo experiments had a statistical error larger than this) [7]. The systematic uncertainty is dominated by the photon energy scale uncertainty and it was reduced by a factor of 2.5 compared to previous results. Cross-checks were done by dividing the data into subsamples and no inconsistency larger that 1.5σwas found with respect to the measured mass.
Figure 3. Invariant mass distribution in theH → γγchannel for 7 and 8 TeV data, showing weighted data points with errors and the result of the simultaneous fit to all categories. The fitted signal plus background is shown along with the background only component of this fit. The different categories are summed together with a weight given by theS/Bratio in each category. The bottom plot shows the difference between the summed weights and the background component of the fit.
6 The
H
→
ZZ
∗→
4
l
mass measurement
TheH→ZZ∗→4ldecay channel has a very good sensitivity due to its high signal over background ratio (S/B≈2) in the mass range 120 GeV<m4l<130 GeV and an excellent mass resolution in each of its final states (from 1.6 GeV to 2.2 GeV), allowing the measurement of the Higgs boson properties. There are four final states considered: μ+μ−μ+μ− (4μ), e+e−e+e− (4e), μ+μ−e+e− (2μ2e) and
e+e−μ+μ− (2e2μ). The last two final states differ in which dilepton pair comes from the on-shell
Z boson.
The main background in this channel is the irreducible pp→ ZZ∗ → 4lproduction. A smaller contribution is also considered from Z+jets andtt¯processes, referred to as the reducible background. TheZZ∗ background was estimated from simulation and normalised to NLO calculations. The re-ducible Z+jets andtt¯were estimated using data driven methods separately for the two final states with subleading muons (ll+μμ) and subleading electrons (ll+ee).
For each event selected, two opposite sign and same flavour dilepton pairs are required. Photons con-sistent with hard or collinear FSR from one of the leptons are added to the four-lepton mass, which helps recover events that would otherwise be lost. A kinematic fit is used to constrain the mass of the leading dilepton pair to the Z pole mass as well which leads to a better mass resolution.
6.1 Improvements on the mass measurement
This discriminant is based on a boosted decision tree (BDT) [9]. The BDT classifier (BDTZZ∗) is trained using simulatedZZ∗ background events and simulated signal events (formH = 125 GeV) that pass the event selection. The variables that were used in the training are the transverse momen-tum (pT) and the pseudorapidity (η) of the four-lepton system and a matrix-element-based kinematic discriminant [7].
Three methods are used for the measurement of the Higgs boson mass in this channel. A 1D template-based fit to them4lspectra, a fit to them4lspectra using analytical signal models incorpo-rating the per-event lepton resolution, and a 2D fit to them4land BDTZZ∗ output (OBDTZZ∗). The first
two methods were used as cross-check, with the 1D being also used by the previous analysis [3]. The third approach, the 2D fit, was used as baseline.
For the 1D and 2D fits, the signal was modelled using simulated distributions that are smoothed us-ing a kernel density estimation method [10]. These distributions form templates that are parametrised as a function ofmH using B-spline interpolation [11]. For all the methods the m4l range used for the fit is 110 GeV to 140 GeV. The background model is described using a 2D PDF derived from a data-driven method for the reducible background and from simulation for the irreducible background. The mass is measured using a simultaneous unbinned maximum-likelihood fit to them4land BDT distributions for the 7 and 8 TeV data. The use of the BDT discriminant improves the statistical uncertainty by approximately 8% compared to the 1D model.
6.2 H→ ZZ∗ →4lresults
The measured Higgs boson mass in theH→ZZ∗→4ldecay channel obtained with the 2D approach ismH = 124.51±0.52 (stat)±0.06 (syst) GeV. The systematic uncertainty is almost negligible, reduced by a factor of approximately 8 relative to the previous measurement, due to the improvements in the electron and muon energy uncertainty. The measured signal strength for this selection isμ = 1.66+0.45
−0.38, consistent with the SM expectation.
The cross-checks with the 1D model and with the per event error are consistent with the 2D results within 250 MeV and 60 MeV respectively.
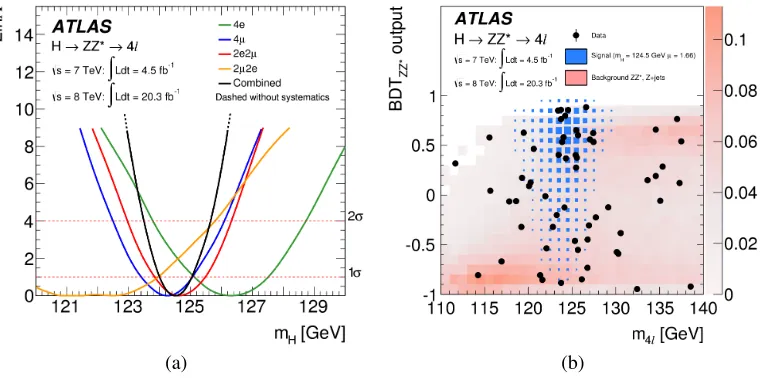
Figure 4-(a) shows the scan of the profile likelihood as a function ofmHfor all four final states and the combination. All nuisance parameters and the signal strength were allowed to float in the scan. The combined result is shown with and without systematics which are shown to be almost the same. All the mass measurements for each of the four final states are compatible by approximately 20% using aχ2test. Figure 4-(b) shows the BDTZZ∗output versusm4lfor the selected candidates within them4lrange 110-140 GeV.
7 Combined mass measurement results of
H
→
ZZ
∗→
4
l
and
H
→
γγ
channels.
The measured masses in theH→ZZ∗→4landH→γγdecay channels, which are given in Sections 6.2 and 5.2, were combined by a simultaneous fit. The combined mass measurement is [7]:
mH=125.36±0.37 (stat)±0.18 (syst) GeV
=125.36±0.41 GeV (1)
The statistical uncertainty increased, with respect to the previous measurement [3], due to the increase in the statistical uncertainty on the H → γγchannel, as described in Section 5.2. The systematic uncertainty was improved by a factor of 3 with respect to previous results (see Section 1).
(a) (b)
Figure 4.(a) The profile likelihood as a function ofmHfor the combination of allH→ZZ∗→4ldecay channels
and for the individual channels for the 7 TeV and 8 TeV data samples. The combined result is shown both with (solid line) and without (dashed line) systematic uncertainties. (b) Distribution of the BDTZZ∗output versusm4l
for the selected candidates in the 110-140 GeVm4lrange for the combined 7 TeV and 8 TeV data samples. The
expected distribution for a SM Higgs withmH =124.5 GeV is indicated by the size of the blue boxes, and the
total background is indicated by the intensity of the red shading.
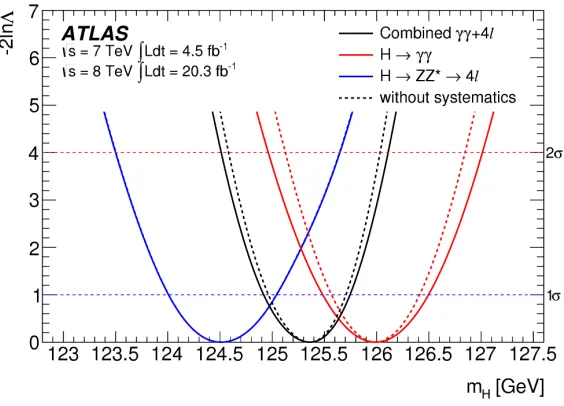
The profile-likelihood curves as a function ofmH for the individualH → ZZ∗ → 4landH → γγ channels, and their combination, are shown in figure 5.
The compatibility of the measured mass in the two channels was seen to improve with respect to the previous results [3], from 2.5σto 2σ.
8 Conclusion
An improved Higgs mass measurement has been achieved by the combined fit to the invariant mass spectra of the decay channelsH → ZZ∗ → 4landH → γγ. The measurement was based on the
√
s=7 TeV and √s=8 TeV data samples collected at the CERN Large Hadron Collider during 2011 and 2012 with an integrated luminosity of 25 fb−1.
The combined measured value of the Higgs boson mass is,
mH=125.36±0.37 (stat)±0.18 (syst) GeV (2)
Figure 5. Value of the−2 lnΛas a function ofmH for the individualH → γγand H → ZZ∗ → 4ldecay
channels and their combination. The dashed lines show the same results without systematic uncertainties. For theH→ZZ∗→4lchannel, this is indistinguishable from the solid line that includes the systematic uncertainties.
References
[1] ATLAS Collaboration, Phys. Lett.B7161 (2012), arXiv:1207.7214 [hep-ex]. [2] CMS Collaboration, Phys. Lett.B71630 (2012), arXiv:1207.7235 [hep-ex]. [3] ATLAS Collaboration, Phys. Lett.B72688 (2013), arXiv:1307.1427 [hep-ex]. [4] ATLAS Collaboration, JINST3S08003 (2008).
[5] ATLAS Collaboration, Eur. Phys. J.C72(2012) no. 1909, arXiv:1110.3174 [hep-ex].
[6] ATLAS Collaboration, "Electron and photon energy calibration with the ATLAS detector using LHC Run I data", submitted to Eur. Phys. J.C(2014), arXiv:1407.5063 [hep-ex].
[7] ATLAS Collaboration, Phys. Rev.D90052004 (2014), arXiv:1406.3827 [hep-ex].
[8] ATLAS Collaboration, "Measurement of the muon reconstruction performance of the ATLAS detector using 2011 and 2012 LHC proton–proton collision data", submitted to Eur. Phys. J. C (2014), arXiv:1407.3935 [hep-ex].
[9] A. Hocker et al., PoSACAT040 (2007), arXiv:physics/0703039 [physics.data-an].
[10] K. S. Cranmer, Comput. Phys. Commun.136198 (2001), arXiv:hep-ex/0011057 [hep-ex]. [11] L. A. Piegl and W. Tiller,The NURBS book: Monographs in visual communication, ch. B-Spline
Basis Function. Springer, 2nd ed., 1997.
![Figure 1. Difunction offference, ΔScale, between the measured electron energy scale and the nominal energy scale as a ET for the region 0.60 < |η| < 1.37 [6]](https://thumb-us.123doks.com/thumbv2/123dok_us/8174083.1365052/3.482.129.354.69.229/figure-difunction-oference-dscale-measured-electron-energy-nominal.webp)


