1
What are the patterns of compliance with Early Warning Track and Trigger Tools: A narrative review
Credland, Nicola; Dyson, Judith; Johnson, Miriam
© 2018. This manuscript version is made available under the CC-BY-NC-ND 4.0 license http://creativecommons.org/licenses/by-nc-nd/4.0/
Background: Early Warning Scores were introduced into acute hospitals in 2000. 99% of
acute hospitals employ a EWS to monitor deteriorating patients with 97.9% of these linked to a referral protocol. Despite this high level of adoption, there has been little improvement in the recognition and response to deteriorating patients over the last decade.
Objective: To explore the patterns of compliance with Early Warning Track and Trigger
Tools
Design: A narrative review
Data sources: Electronic databases (Medline, CIHAHL, EmBase, the Cochrane library, the
Centre for Reviews and Dissemination (CRD) and PROSPERO) were searched from 1 January 2000 to 5 July 2018. Titles, abstracts and full text papers were screened (two independent reviewers) against inclusion criteria and seven papers were included in the review. Data were extracted by one reviewer and checked by a second reviewer using a bespoke data collection sheet.
Review methods: All papers were quantitative in design but demonstrated clinical and methodological heterogeneity therefore a meta-analysis was not possible. A qualitative approach was undertaken to synthesise findings using a framework analysis and narrative synthesis. Themes were identified, named, defined and reported according to outcome measure.
Results: 7/27 papers representing over 3000 patients and 963,000 data points were
included in the analysis. Reported studies were conducted in the United Kingdom (n=4), Denmark (n=2) and Amsterdam (n=1). Three key themes were identified, early warning score calculation accuracy, monitoring frequency and clinical response. This review identifies poor compliance with the Early Warning Score (EWS) protocol in all three themes. There is significant scoring inaccuracy with omitted EWS, missing elements of the EWS and incorrectly calculated EWS. Adherence to monitoring frequency is poor with a higher EWS being associated with reduced compliance with the escalation protocol. There is inadequate compliance with the escalation element of the EWS protocol with concerning extended
2 delays to clinical review. There is evidence of worsening clinical response with increasing EWS. Although significant improvement is demonstrated in clinical response with the use of electronic EWS protocols, non-compliance still occurs at all EWS stages.
Conclusion: Compliance with EWS is poor but the cause is unidentified. Outcomes can only
improve if staff complete the EWS fully, calculate the score accurately, monitor according to protocol and escalate according to clinical response. Social, environmental and professional behaviours that affect effective use of track and trigger tools should be explored to improve our understanding of suboptimal management of the deteriorating patient.
What is already known about this topic?
Early warning track and trigger tools have been implemented nationally and to a lesser degree internationally
What this paper adds
Compliance with EWS is poor and current research fails to identify why this may be the case.
Outcomes can only be positively affected if staff complete the EWS in its entirety, calculate the score accurately, monitor in line with the protocol frequency and escalate according to clinical response.
Failure to manage the deteriorating patient could be better understood by exploring the social, environmental and professional behaviours that impact on the effective use of track and trigger tools
1. Introduction and background
A review of 1000 medical records of adults who died in 10 acute hospitals across England found that one in twenty patients die as a result of medical error with one death in 20 having a greater than 50% chance of being preventable and 31% of preventable deaths being due to poor clinical monitoring (Hogan et al. 2012). There is evidence to suggest that a lack of knowledge and skills, inadequate appreciation of clinical urgency and failure to seek expert
3 advice in a timely fashion contributes to inadequate recognition of and response to the deteriorating patient (McQuillan et al. 1998).
Approximately 80% of hospital in-patients who suffer cardiac arrest show signs and symptoms of deterioration in the hours leading up to the event (Resuscitation Council (UK), 2010; NCEPOD 2012). Failure to recognise physiological deterioration in acutely ill adults, combined with a failure to seek appropriate help promptly and intervene in a timely manner, results in increased rates of cardiac arrest and unanticipated intensive care admissions (Hogan et al. 2012, Franklin and Matthew, 1994; McQuillan et al. 1998; Smith et al. 2006). In such patients’ mortality is high, with only 7% of non-shockable cardiac arrests surviving to discharge (Intensive Care National Audit Research Centre, 2012).
Historically, several key reports highlighted sub-optimal management of patients both discharged from Intensive Care Unit’s (ICU) and at risk of deterioration on general wards, with evidence of deficits in their care and management (Goldhill et al. 1999; Mc Gloin et al. 1999; Garrard et al. 1998; Mc Quillan et al. 1998). The reasons for the failure to detect patients at risk of acute deterioration include poor critical care knowledge of ward based medical teams (Franklin and Matthew, 1994; Welsh, 2000; Goldhill, 2000). It is also recognised that lack of resources, increasing volume and acuity of patients can compromise acute care provision compounding failure to detect deterioration (McGloin et al. 1999). Only 2% of acute hospital beds are designated for critical care (Audit Commission 1999) so the optimisation of ward based patient management requires timely identification and intervention to support deteriorating patients (Welsh, 2000; McGloin et al. 1999). Hogan et al. (2012) suggests that, despite implementation of track and trigger systems, there has been little improvement over the last decade with sub-optimal care still evident on general wards impacting directly on patient outcome.
Early Warning Scores (EWS) with an associated escalation strategy (often referred to as track and trigger systems) were first introduced into acute hospitals in 2000 (Department of Health (DoH) 2000a). Ninety nine percent of acute hospitals employ a EWS to monitor deteriorating patients with 97.9% of these linked to a referral protocol (NCEPOD, 2015). Despite this high level of adoption, there has been little improvement in the recognition and response to deteriorating patients over the last decade. Sub-optimal care is still evident on general wards despite the comprehensive introduction of EWS and escalation strategies (Hogan et al. 2012).
This review aimed to examine international research relating to the relationship between early warning track and trigger tools and compliance. The research question guiding the review was:
4 What are the patterns of compliance with Early Warning Track and Trigger Tools?
2. Methods
The review protocol was registered on Prospero (CRD42017074401) (PROSPERO, 2014). The search methods employed for this review are adapted from the Cochrane Handbook of Systematic Reviews (Higgins and Green, 2011) and reported according to the Preferred Reporting Items for Systematic Reviews and Meta-Analyses (PRISMA) Statement (Moher et al., 2015).
2.1 Selection Criteria
2.1.1 Inclusion and Exclusion Criteria
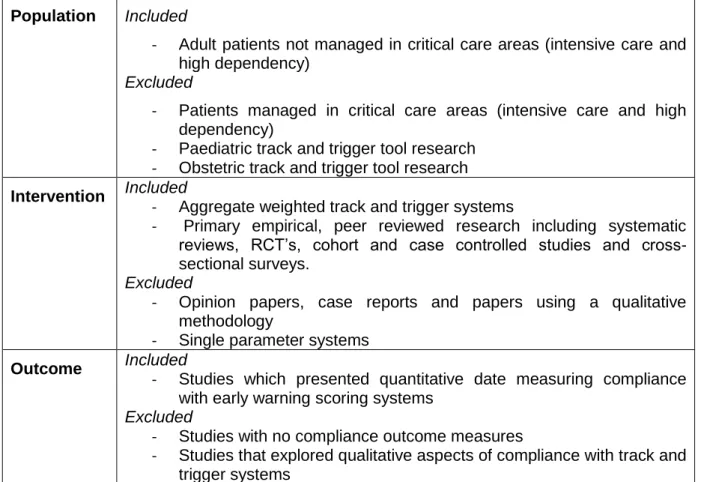
The Population, Intervention, Comparison, Outcome (PICO) acronym (O’Conner et al. 2008) was used to develop inclusion and exclusion criteria (table 1). An inclusive approach was used as there is a dearth of evidence and it was important to capture all the relevant research available that answered the research question.
Table 1. Eligibility criteria
Population Included
- Adult patients not managed in critical care areas (intensive care and high dependency)
Excluded
- Patients managed in critical care areas (intensive care and high dependency)
- Paediatric track and trigger tool research - Obstetric track and trigger tool research
Intervention Included
- Aggregate weighted track and trigger systems
- Primary empirical, peer reviewed research including systematic reviews, RCT’s, cohort and case controlled studies and cross- sectional surveys.
Excluded
- Opinion papers, case reports and papers using a qualitative methodology
- Single parameter systems
Outcome Included
- Studies which presented quantitative date measuring compliance with early warning scoring systems
Excluded
- Studies with no compliance outcome measures
- Studies that explored qualitative aspects of compliance with track and trigger systems
5 2.2 Search strategy
Data bases searched were Medline, CIHAHL and the Cochrane library. Population (i.e. adult patients only) was not used as a search term but non-adult studies filtered during the screening process. As Early Warning Scores were only introduced in 2000 this date was used to limit the search. Citation searching, searches of reference lists for missed studies and ‘find similar’ options in other databases such as ‘Scopus’ and ‘Web of Science’ along with a search of Google Scholar were also conducted to identify missed, non-indexed and unpublished material. Studies known to the researcher prior to the search were used for cross-checking to ensure that the search strategy had not missed these studies. A search of the grey literature (government reports, non-published literature) was also undertaken. Relevant Government and clinical reports have been discussed previously and no further studies were identified. A preliminary scoping review was used to identify the full spectrum of search terms. These were “track and trigger*” OR “early warning scor*” and “complian*”. A librarian checked the strategy to ensure a robust search.
2.3 Study selection
After removal of duplicates, titles and abstracts were independently screened by NC and JD against the inclusion and exclusion criteria. Full texts were similarly reviewed. MJ was available to support resolution of any disagreements in whether papers were appropriate for inclusion however, in all cases agreement was achieved.
2.4 Quality assessment
Critical Appraisal Skills Programme (CASP) Critical Appraisal tools were used to assess the quality of the included papers (CASP, 2014). Numerical scores were derived by attributing 1 mark for a yes answer and 0 marks for a no / don’t know answer.
2.5 Data extraction
The data extracted included publication details, study designs, participants, interventions, outcomes and results. Data were extracted by NC and independently reviewed by JD. MJ was available to support resolution of any disagreements however, in all cases agreement was achieved.
6 Due to heterogeneity with regard to population and design it was not possible to carry out a meta-analysis. This review identified clinical heterogeneity (the patients are not the same) and methodological heterogeneity (all the studies were not conducted in the same manner). A qualitative approach was undertaken to synthesise findings using a framework analysis (Miles and Huberman, 1994) and narrative synthesis (Ferrari, 2015) with results analysed based on outcome. A framework analysis facilitates the generation of a set of codes organised into categories to manage and organise data. These codes are grouped into clusters around similar and interrelated ideas and concepts. The author explored the familiarisation of included papers and their findings. The papers were re-read several times to ensure understanding. Each paper was marked with highlighters allocated to different emerging patterns/codes. The results of each paper were considered in relation to the research question. The patterns identified led the formation of themes using a white board. Themes were arranged into logical groups which directly addressed the research question. This process was repeated to ensure no relevant data had been missed and that the themes chosen were coherent and answered the research question. The themes were identified, named, defined and reported according to outcome measure and analysed in relation to the research question. A narrative synthesis refers to an approach to the systematic review and synthesis of findings from multiple studies that relies primarily on the use of words and text to summarise and explain the findings of the synthesis. The practical–configurational mode of reasoning in narrative synthesis focuses on making sense of the reading of the evidence – ‘what is going on here?’ or ‘what picture emerges?’ (Melendez- Torres et al. 2016).
3.0 Results
3.1 Study selection
Of the 27 titles found by the search, seven papers representing over 3000 patients and 963,000 data points were included in the analysis. Reviews and Meta-Analysis diagram (PRISMA) (Moher et al. 2015) detailing the process of inclusion and exclusion is provided in Figure 1.
7 Figure 1: PRISMA diagram
Records identified through database searching
(n = 27)
Additional records identified through other sources
(n =0)
Records after duplicates removed (n = 19)
Records after titles screen (based on inclusion/exclusion)
(n = 19)
Records excluded (n = 0)
Records after abstract screen (based on inclusion/exclusion) (n = 11) Records excluded (n =8) Paediatric Qualitative implementation/ compliance research Does not answer research question
Records after full text screen (based on inclusion/exclusion)
(n=7)
Studies included in synthesis
8 3.2 Study characteristics
3.2.1 Study designs
All included papers were of quantitative design and were published between 2013 and 2016 in English. Data were collected using either a case note review / notes audit, prospective observational design, a point prevalence design or a quasi-experimental approach. Settings were all in acute hospital general wards. The seven papers reported studies conducted in 3 European countries; the United Kingdom (n=4), Denmark (n=2) and Amsterdam (n=1) emphasising the increasing international interest in the subject. A summary of included papers can be found in Figure 2.
9 Figure 2: Summary of Studies included in the review
S tud y Desi gn S am pl e I nterven ti on Outcom e m easur es Ke y fi ndi ngs Ap p rai sal rati ng J ones et
al. (201 1) UK
His t oric ally c ont rolle d s t udy.
Univ ers it y t eac hi ng hos pit al
Med ic al adm is s ions unit and on e ge ner al m edic al war d
1481 c ons ec ut i ve ad ult pat ient s gen erat i ng 13, 6 68 dat a s et s
I m plem ent at ion of pat ient t rac k bas ed on EW S prot oc ol in p lac e s inc e 2000
P O- Lengt h of s t ay S O- Com plianc e wit h EW S
Car diac ar res t inc idenc e I n hos pit al m ort alit y Us e of c rit ic al c are beds
EW S c alc ulat ed c orrec t ly in 81% of c as es .
Non -c om plianc e of 9 -10% wi t h t im elines s of obs ervat i on re-c hec k
Com plet e c om plianc e wit h t h e EW S prot oc ol inc ludi ng t im elines s of c linic a l res pon s e c ould not be ac c urat e ly det erm ined du e t o poo r doc u m ent at ion of at t endanc e t im es in m edic al rec ords
CA S P 12/ 13 Hands et al. (201 3) UK
Ret ros p ec t ive dat a s et audit
NHS Dis t ric t Gener al Hos pit al
A ll adult in -p at ient a reas 9500 43 vit al s ign dat a s et s
EW S us ing V it alP ac elec t ronic vit al s ign
rec ord ing
Hou rly a nd dail y p at t erns of vit al s igns
V iEW S value doc um ent at ion No of vit al s igns
rec ord ed b et wee n 08: 0 0 -11: 59 wit h t im e t o ne xt obs er vat ion and f oll o w up vit al s igns in 6h r s
A t bes t part ial adh ere nc e t o EW S prot oc ol S ic k er pat ient s m ore lik ely t o hav e ov ern ight
obs er vat ions but t im ely re as s es sm ent of t hes e pat ient s rem ains poor.
Lac k of c om plianc e unif orm it y ov er t he 2 4hr peri od
CA S P 13/ 13 Niegs c h et al. (201 3) Denm ark
7 day p ros pec t iv e, obs er vat ion al, rand om is ed, c ros s -s ec t ional, point pre vale nc e s t udy
I n-hos pit al p at ient s on 1 2 m edic al and s urgic al wa rds n=132
Calc ulat io n of EW S by inves t igat o r bet wee n 16: 0 0 and 21: 00 e ac h day. S t ruc t ured ques t ionn air e t o int er vie w war d nurs e if abn orm al EW S ident if ied Com paris on wit h inves t igat o r an d s t af f EW S
Num ber of in -h os pit al pat ient s obs er ve d and m anaged ac c ordi ng t o t he W ard Obs ervat ion al Cha rt (EW S ) guidanc e
Lo w c om plianc e wit h t he W ard Obs er vat io nal C hart 58% m anaged c o rr ec t ly ac c ordin g t o t he EW S prot oc ol. No s ignif ic ant dif f er enc e bet ween d epa rt m ent or da y of t he week . 12 pat i ent s had m is s ing phys iolo gic al param et ers des pit e a EW S calc ulat ion. 50 pat ient s had abno rm al EW S rec orded b ut of t hes e only 3 8% wer e c orrec t ly e s c alat e d.
73 pat ie nt s had abn orm al E W S ident if ied by t he inves t igat o r but o nly k no wn by s t af f in 60% of c as es .
CA S P 11/ 13 Ludik hui ze et al. (201 4) A ms t erd am
Quas i -e xpe rim ent al s t udy
Univ ers it y h os pit al 18 adult g ene ral wards n=80 4
P rot oc olis ed gr oup (10 wards ) = vit al s igns x3 t im es per day Cont r ol gr oup ( 8 war ds ) = vit al s igns wh en c linic ally indic at e d
Com plianc e wit h s et m onit oring s t anda rds inc luding EW S Dela y in es c alat ion t o phys ic ian
Rapid res po ns e t eam ac t ivat ion
EW S in 70% of pat ient s on t he p r ot oc olis ed wa rs v 2% in t he c ont rol g rou p. Com plian c e wit h t he prot oc ol pres e nt in 68% of c as es v 4% in t he c ont rol gr oup. I nc re as ed es c alat ion pr es ent in t he p ro t oc olis ed gro up
CA S P 11/ 13
Odell M (201 5)
Ret ros p ec t ive c as e not e re vie w
I n hos pit al adu lt pat ient s on 26 g ene ral wards
Ret ros p ec t ive c as e not e re vie w
Com plianc e wit h EW S prot oc ol
20. 3% of c as es sc ored t he m axim um f or adhe renc e t o EW S prot oc ol. 50. 4% f ailed t o reac h t he m inim um
CA S P 12/ 13
10
UK n=120 us ing pr edes ign ed
dat a c ollec t ion p ro f orm a
Rec ordi ng of vit al s igns s t andard of prac t ic e. 24. 3% of EW S c alc ulat ed we re s c ored inc or rec t ly
P et ers en et al. (201 4) Denm ark
P ros pec t ive obs er vat ion al s t udy
I n hos pit al adu lt pat ient s on gen er al wa rds n=14 4
Cas e not e r evi e w of all inc ident s of une xpec t ed d eat h, c ardiac ar res t and unpla nne d I CU adm is s ion
Com plianc e wit h EW S prot oc ol f o r t he 24 h rs prec edi ng c ar diac ar res t , une xpec t ed d eat h a nd unpla nne d I CU adm is s ion
P oor c om plianc e wit h EW S
Cor rec t m onit oring f re que nc y und ert ak en i n 27% of c as es
I nadeq uat e c linic al r es pons e t o EW S 2 (58% ) EW S 3 (55% ) EW S 6 (29% ) and EW S 9 (36% ) CA S P 12/ 13 K olic et al. (201 5) UK
P ros pec t ive obs er vat ion al s t udy
Dis t ric t General Hos pit al A dult pat ient s adm it t ed t o A c ut e Medic al U nit n= 370 Revi e w of c linic al res pons e d at a c ollec t ed f or f irs t 24hrs of adm is s ion EW S s c oring ac c urac y A dequac y of c linic al res pons e t o EW S
EW S c alc ulat ed inc orrec t ly i n 18. 9% of pat ient s 25. 9% pat ient s had a n ina de quat e c linic al r es pons e t o t heir EW S
8 pat ient s (6% ) who h ad an a dequ a t e res p ons e die d c om pared t o 6 pat ient s wh o had an i nad equ at e res po ns e
CA S P 12/ 13
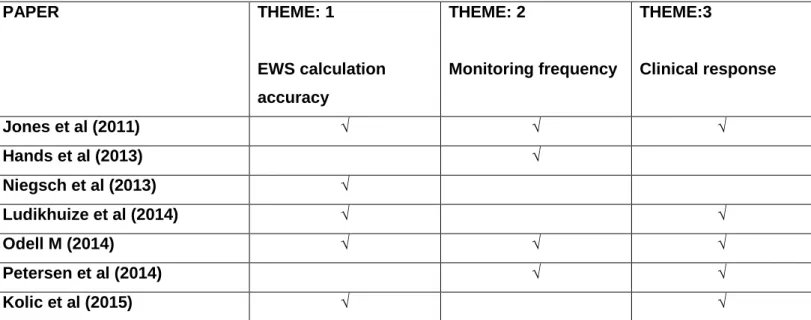
11 3.2.2 Identification of themes
The development of themes can be found in Table 2.
PAPER THEME: 1 EWS calculation accuracy THEME: 2 Monitoring frequency THEME:3 Clinical response Jones et al (2011) √ √ √ Hands et al (2013) √ Niegsch et al (2013) √ Ludikhuize et al (2014) √ √ Odell M (2014) √ √ √ Petersen et al (2014) √ √ Kolic et al (2015) √ √
Table 2: Development of themes
Three themes were identified which were reported according to outcome measure. These are Early Warning Score calculation accuracy, monitoring frequency and clinical response (Figure 3).
Figure 3: Identified themes
What are the patterns of compliance with Early Warning Track and
Trigger tools?
Clinical Response
Monitoring frequency
EWS calculation
accuracy
12 3.3 Theme: Early warning score calculation accuracy
Four papers report EWS calculation accuracy. There is evidence of inadequate calculation leading to ineffective response to increased scores. The issues of concern with calculation accuracy appear three-fold. Firstly, complete lack of EWS recording. Secondly, incorrect addition of each individual physiological parameter that make up the score. Finally, omission of one or more physiological parameters required to make up the EWS resulting in an incorrect overall calculation.
Odell (2015) identified that an EWS was only recorded in 83.7% (n=103) of total cardio-pulmonary arrest cases (n=123). Of these 24.3% (n=25) were inaccurate due to incomplete observations, under and over calculation. 15 of these EWS, if calculated correctly, should have generated a clinical response suggesting that calculation inaccuracy leads to suboptimal referral decisions. In total 36.5% of cases had an ineffective EWS recording leading to poor adherence to the EWS protocol. Niegsch et al. (2013) identified patients with a calculated EWS despite incomplete vital parameters for calculation. In 132 patients only 77% had a EWS calculated again suggesting poor adherence to the EWS protocol. 12 patients were identified that had a EWS calculated despite one of more missing elements required for calculation. A further 12 patients had all the necessary parameters completed but no EWS calculated. Kolic at al. (2015) also identified EWS scoring errors in 18.9% of patients (n=70). Interestingly, the study identified a direct correlation between high EWS scores (EWS >7) and a significant increase in scoring error (p<0.008). Patients with high EWS scores are the most critically ill and in need of urgent clinical response. Incorrect EWS scores in this group of patients can lead to cardiac arrest and unexpected death again suggesting that scoring accuracy plays a vital part in patient outcome. Ludikhuize et al. (2014) identified calculation errors in both a EWS protocolised group (measurement of EWS at least three times a day) and a control group (measurement of EWS when clinically appropriate). Missing parameters and errors in calculation accuracy were found to be statistically significant across both groups (p<0.001). Interestingly, in the categories 3 or more errors and 3 or more missing parameters the errors were higher in the control group suggesting that implementing a protocol rather than relying on clinical decision making improves management of the deteriorating patient. However, only 14% (483/3585) of protocol measurements versus 0.3% (8/3013) of control group measurements were entirely without error which, whilst improvement is noted still demonstrated suboptimal compliance with EWS protocol. Jones et al. (2011) explored whether automated clinical alerts increase compliance with EWS protocol. Scoring accuracy improved from 81% to 100% suggesting that human error significantly impacts on EWS compliance. The errors in calculation were overestimates (false positives) and underestimates (false negatives). There were 12
13 instances where the underestimated score should have triggered a clinical response if calculated correctly. This highlights the importance of EWS scoring accuracy in compliance with the EWS protocol.
3.4 Theme: Monitoring frequency
Four papers explore monitoring frequency. Adherence to EWS monitoring frequency is poor with higher EWS being associated with reduced compliance with the protocol. Compliance with EWS may be reduced at a weekend and during night time hours.
Petersen et al. (2014) explored monitoring frequency in unexpected death, cardiac arrest and unanticipated ICU admission (n=144). Monitoring frequency was completely adhered to in only 13% and 27% of unintended ICU admission and cardiac arrest respectively. They identified that a higher EWS was significantly associated with a reduced likelihood of being monitored according to the EWS protocol. The incidence fell from 83% in patients with EWS <1 to 6% in patients with EWS >9 (p=0.0002 for unplanned ICU admission and p=0.0058 for cardiac arrest). These patients represent the highest risk group in terms of increased unexpected death and cardiac arrest so this failure to monitor according to protocol suggests suboptimal care which impacts on patient outcome. Hands at el. (2013) conclude that adherence to the hospitals protocol for the frequency of EWS monitoring is only partial at best. There is a striking pattern with the presence of increased peaks in monitoring between 06:00-06:59 and 21:00-21:59. The authors suggest that this is likely to coincide with nursing handover and pre-determined hours when observation rounds will be undertaken. Inpatients with the highest EWS score (>9) time to next observations was 4.22hrs during the daytime and 5.17hrs overnight. Whilst the time to next observations did decrease with increasing EWS this was not in line with the hospitals monitoring protocol suggesting inadequate compliance leading to sub-optimal care. They also identify variability in vital sign monitoring over the 24hr period. Vital signs were measured infrequently between 23:00hrs to 05:59hrs with only 12.81% of observations being carried out within this period. The proportion of vital signs undertaken in EWS>9 was greater during this period than for any other EWS score suggesting that the sickest patients are more likely to have their vital signs measured overnight. However, there is a marked contrast in compliance with observation recording when comparing day and night time. Between the hours of 08:00-11:59 73.10% have subsequent vital sign recording compared to only 25.32% during 20:00-23:59. Adherence to EWS protocol was always greater during the day time regardless of EWS score suggesting suboptimal care of patients during night time hours. Odell (2015) found that in patients who had a cardiac arrest at the weekend or bank holiday there was more likely to be poor compliance with the EWS protocol in the hours leading up to their arrest (p=0.0006). Jones et al. (2011) explored whether automated EWS would improve observation frequency. There
14 was no difference in recheck time interval in EWS of 3,4 and 5 within one hour. This occurred in 27% and 22% of instances for the non-automated and automated groups respectively. There remained a non-compliance rate of 9% non-automated versus 10% for the automated EWS group after four hours. This suggests that the use of automated EWS systems alone do not improve observation frequency when compared to a manual EWS protocol.
3.5 Theme: Clinical response
Five papers explore clinical response to EWS. There is evidence of inadequate compliance with the escalation element of the EWS protocol and worsening clinical response with increasing EWS. Delay in, or indeed omission of, life-saving treatment can increase mortality, unplanned ICU admission, Cardio-pulmonary arrest, length of stay and serious adverse incidents. Timely intervention in this group of patients is vital to improve patient outcomes.
Odell (2015) identified that 50.4% of 123 cardiac arrest cases failed to meet minimum standards of practice for EWS compliance. The protocol for referring patients for expert help when the EWS threshold was reached failed to be activated in 39% of cases. Only 1/5 of patients received the optimum standard outlined by the EWS protocol. In 62 cases, the referral decision was flawed which is of serious concern as these patients are amongst the sickest in the hospital. Kolic et al. (2015) identified an appropriate clinical response to EWS in only 74.1% (n=274) of patients, leaving 25.9% (n=96) receiving an inadequate response. Of even greater concern there was a significantly worsening response in the sickest patients with EWS 5-6 (100%) and EWS >7 (75%) (p=0.0001). Day of the week was also identified to impact on clinical response. Patients admitted at the weekend were more likely to receive an inadequate response than those admitted on a week day (p=<0.0001). A small decrease in clinical response at night was also noted but not statistically significant (p=0.404). This appears to mirror the findings relating to monitoring frequency discussed above. As EWS monitoring is essential for clinical response, weekend compliance is suboptimal in both the afferent and efferent arm. This has significant implications for patient safety out of hours. Ludikhuize et al. (2014) found a delay in clinical response in both the protocolised group (49%) and the control group (50%). Although not statistically significant the delay was clinically concerning at 20hrs and 44hrs respectively (p=0.79). Petersen et al. (2014) identified compliance in the EWS protocol in patients with a score <2 (62%) and appropriate clinical response to a score >3 (58%). Of concern, in patients with a high EWS clinical response was worse. 106 events (58%) where patients with a EWS >6 were not treated by a physician and there was no documentation to support the nursing staff has instigated the correct clinical response. In EWS >9 only 48% of patients were managed by a specialist
15 team. Again, this mirrors the findings for scoring accuracy and monitoring frequency suggesting the sickest patients are beings managed sub optimally with failures in both the afferent and efferent arm of the EWS protocol. Overall, non-compliance in the EWS protocol was identified in 92% of cases. Jones et al. (2011) suggests that with the use of electronic EWS clinical response increased from 29% to 78% in patients with a EWS of 3,4 or 5 (p=<0.001). This still suggests a failure rate of 22% which remains suboptimal. Clinical response to a EWS >5 was also statistically significant at 96% (p=<0.001). Although significant improvement is demonstrated with the use of electronic EWS protocols, non-compliance still occurs at all EWS stages.
4. Discussion of Findings
In summary, this review demonstrates poor compliance with the EWS protocol. There is significant scoring inaccuracy with omitted EWS, missing elements of the EWS and incorrectly calculated EWS (Odell 2015; Niegsch et al. 2013; Ludikhuize et al. 2014). These errors are compounded in the higher EWS ranges (Kolic et al. 2015). The use of automated EWS can improve scoring accuracy but errors remain (Jones et al. 2011). Adherence to monitoring frequency is poor with a with higher EWS being associated with reduced compliance with the protocol (Petersen et al. 2014). Compliance with EWS may be reduced at a weekend and during night time hours (Hands at el. 2013; Odell 2015). The use of automated systems alone do not improve observation frequency when compared to a manual protocol (Jones et al. 2011). There is also evidence of inadequate compliance with the efferent limb of the EWS (Odell, 2015) with concerning extended delays to clinical review (Ludikhuize et al. 2014). There is evidence of worsening clinical response with increasing EWS (Kolic et al. 2015; Petersen et al. 2014). Although significant improvement is demonstrated in clinical response with the use of electronic EWS protocols, non-compliance still occurs at all EWS stages (Jones et al. 2011).
When considering the findings of this review within the context of the wider literature it is reasonable to suggest that the success of EWS relies on the effectiveness of its implementation. It is unfair to make a judgement on the clinical effectiveness of EWS given the poor implementation. When goals are not achieved there is a tendency to blame the individual rather than looking at the wider context. This study suggests that compliance is poor and we must explore the reasons why. This needs to include issues surrounding culture, professional norms and values, hierarchies and clinical autonomy.
16 An improvement in documentation is still required as research suggests that documentation is incomplete is most cases (Ludikhuize et al. 2012). This is particularly important when considering respiratory rate and conscious level both important indicators of critical illness (Alam et al. 2014). With the introduction of an EWS both observation frequency and documentation can be improved (De Meester et al. 2013) but there is still much work to do. Inadequate nursing surveillance has been associated with failure to recognise and respond (Kelly and Vincent 2011). Inadequate staffing and skill mix, poor multi-disciplinary teamwork, poor communication, overuse of technology and lack of family input have all been identified as barriers to effective nursing surveillance (Henneman et al. 2012; Kutney-Lee et al. 2009). The weekend effect has been well documented in other studies with increased mortality prevalent at a weekend (Aylin et al. 2010; Freemantle et al. 2012). Experience and expertise of both nursing and medical staff may be diluted during this time which may influence compliance with EWS. More research into the weekend effect would be useful.
Education is essential to understand the potential benefits of EWS and their relationship to improved clinical outcomes (Alam et al. 2015; Paterson et al. 2006; Subbe et al. 2003; Bokhari et al. 2010). Acute clinical changes are often recognised and acted upon in a timely fashion using automated skills based behaviour or rule based behaviour using pattern recognition. However, deterioration can often be subtle and for a prolonged period. This demands knowledge based behaviour using observation, experience, consultation and cognitive processing. Subjectively the patient’s condition may be deteriorating however the objective measurements are not yet severe enough to activate the EWS. In these situations, response to deterioration is often delayed as staff wait for more objective data to become available (Braaten 2015).
Cultural barriers can affect the decision to act on an EWS. Braaten (2015) identifies informal hierarchical norms in the hospital culture as a constraint to recognition and response. The need to justify escalating the management of a deteriorating patient demands confidence in assessing the patient especially in instances of subtle change. Not wanting to instigate a false alarm or to appear incompetent and unable to handle the situation have been identified as barriers to recognition and response (Astroth et al. 2013). This may be accompanied by a fear of reprisal or criticism of the escalation if it is deemed to be unnecessary. This need for justification leads to delays in treatment and worse clinical outcomes. Shearer et al. (2012) identified the most common reason for failure to respond was that the staff involved felt that they had the clinical situation under control despite an elevated EWS. This suggests that a shift in both education and culture is needed to ensure staff fully engage with, accept and value the EWS system.
17 4.1 Methodological limitations of the studies
All papers included noted that the single centre nature of their studies may limit external validity. Petersen et al. (2014) and Kolic et al. (2015) acknowledged small sample sizes as a limitation which may constrain the generalisability of their results. Several studies acknowledged limitations in their data collection. Niegsch et a.l (2013) reports that during data collection, several wards were closed due to planned ward reallocation and holidays. This led to smaller than expected data set. Odell (2015) reports a considerable number of missing records which resulted in an incompleteness of data for analysis. Ludikhuize et al. (2014) notes that exclusions of measurements when the patients is absent from the ward may have resulted in an underestimation of findings as it is possible that patients may have been receiving an intervention for clinical deterioration during this time. They also acknowledge that, as vital signs were recorded three times daily in the protocolised group may also lead to increased awareness of clinical deterioration. Finally, Jones et al. (2011) argues that it was impossible to control for external factors which may have influenced length of stay. As their study took place at various times of the year, seasonal illness may have contributed to the increased length of stay in the baseline phase.
4.2 Limitations of the review
There are limited studies exploring compliance with the EWS protocol which makes it difficult to generalise findings. Whilst the authors cannot guarantee that all papers were identified, the robust search strategy and citation searching should have addressed this issue.
4.3 Recommendations and implications for practice
For EWS to be effective, compliance with all aspects of the efferent and afferent limb must take place. There is evidence to suggest that EWS improve patient outcome but compliance with the EWS protocol is poor. Outcomes can only be positively affected if staff complete the EWS in its entirety, calculate the score accurately, monitor in line with the protocol frequency and escalate according to clinical response.
4.4 Implications for future research
Despite evidence that EWS is effective in improving patient outcomes, compliance with the EWS protocol is poor. Despite clear EWS protocols staff often fail to follow them and consequently, sub-optimal care of deteriorating ward patients continues (Hogan et al. 2012; NCEPOD, 2012). There remain opportunities to investigate why staff fail to adhere to the EWS protocol including the social, cultural and inter-professional issues that prevent staff for recording vital signs and acting on the results. Few papers exist which explore the reasons for non- compliance using a mixed methods approach (Shearer et al. 2012). This approach
18 may allow greater understanding of the barriers to effective use of EWS enabling the development of evidence based implementation strategies.
5. Conclusion
Compliance with EWS is poor but the cause is unidentified. Outcomes can only improve if staff complete the EWS fully, calculate the score accurately, monitor according to protocol and escalate according to clinical response. Social, environmental and professional behaviours that affect effective use of track and trigger tools should be explored to improve our understanding of suboptimal management of the deteriorating patient.
References
ALAM, N., HOBBELINK, E., VAN TIENHOVEN, A., VAN DE VEN, P., JANSMA, E. and NANAYAKKARA, P., 2014. The impact of the use of the early warning score (EWS) on patient outcomes: A systematic review. Resuscitation, 85, pp. 587-594.
ALAM, N., VEGTING, I., HOUBEN, E., VAN BERKEL, B., VAUGHAN, L. and KRAMER, M., 2015. Exploring the performance of the National Early Warning Score (NEWS) in a European emergency department. Resuscitation, 90, pp. 111-115.
ASTROTH, K., 2013. Qualitative exploration of nurses' decisions to activate rapid response teams. Journal of Clinical Nursing, 22(19-20), pp. 2876-1882.
AUDIT COMMISSION, 1999. Critical to Success. London: Audit Commission.
AYLIN, P., YUNUS, A., BOTTLE, A., MAJEED, A. and BELL, D., 2010. Weekend mortality for emergency admissions. A large, multicentre study. Quality & safety in health care, 19(3), pp. 213-217.
BOKHARI, S., MUNIR, Y., MEMON, S., BYRNE, J., RUSSEL, N. and BEED, M., 2010. Impact of critical care reconfiguration and track and trigger outreach team intervention on outcomes of haemotology patients requiring intensive care admission. Annals of Haemotology, 89, pp. 505-512.
BRAATEN, J., 2015. Hospital Systems Barriers to Rapid Response Team Activation: A Cognitive Work Analysis. American Journal of Nursing, 115(2), pp. 22-32.
CRITICAL APPRAISAL SKILLS PROGRAMME (CASP), 2014-last update, CASP Checklists [Homepage of Oxford. CASP], [Online]. Available: http://www.casp-uk.net/ [02/07/2018, 2015].
DE MEESTER, K., HAEGDORENS, F., MONSIEURS, K., VERPOOTEN, G., HOLVOET, A. and VAN BOGAERT, P., 2013. Sis day postoperative impact of a standardised nurse
19 observation and escalation protocol: A preintervention and postintervention study. Journal of Critical Care, 28, pp. 1068-1074.
DEPARTMENT OF HEALTH, 2000a. Comprehensive Critical Care: A Review of Adult Critical Care Services. London: The Stationary Office.
FERRARI, R., 2015. Writing narrative style literature reviews. Medical Writing, 24(4), pp. 230-235.
FRANKLIN, C. and MATHEW, J., 1994. Developing strategies to prevent in-hospital cardiac arrest: analysing responses of physicians and nurses in the hours before the event Critical Care Medicine, 22, pp. 244-247.
FREEMANTLE, N., RICHARDSON, M., WOOD, J., RAY, D., KHOSLA, S., SHAHIAN, D., ROCHE, W., STEPHENS, I., KEOGH, B. and PAGANO, D., 2012. Weekend hospitalization and additional risk of death: an analysis of inpatient data. Journal of the Royal Society of Medicine, 105(2), pp. 74-84.
GARRARD C, Y.J., 1998. Sub-optimal care of patients before admission to intensive care British Medical Journal, 316, pp. 1841-1842.
GOLDHILL, D., WORTHINGTON, L., MULCAHY, A., TAHLING, M. and SUMNER, A., 1999. The patient at risk team: identifying and managing seriously ill patients. Anaesthesia, 54, pp. 853-860.
HANDS, C., REID, E., MEREDITH, P., SMITH, G.B., PRYTHERCH, D.R., SCHMIDT, P.E. and FEATHERSTONE, P.I., 2013. Patterns in the recording of vital signs and early warning scores: compliance with a clinical escalation protocol. BMJ quality & safety, 22(9), pp. 719-726.
HENNEMAN, E., 2012. Surveillance: a strategy for improving patient safety in acute and critical care units. Critical Care Nursing, 32(2), pp. e9-e18.
HIGGINS, J.P.T. and GREEN, S., 2011. Cochrane Handbook of Systematic Reviews ,Version 5.1.0. Cochrane Collaboration. http://www.cochrane.org/handbook edn. HOGAN, H., HEALEY, F., NEALE, G., THOMSON, R., VINCENT, C. and BLACK, N., 2012. Preventable deaths due to problems in care in English acute hospitals: a retrospective case record review study http://qualitysafety.bmj.com edn.
INTENSIVE CARE NATIONAL AUDIT RESEARCH CENTRE CASE MIX PROGRAMME DATASET SPECIFICATION, 2012-last update, National Cardiac Arrest Audit (NCAA) . Available: https://www.icnarc.org/Default.aspx.
JONES, S., MULLALLY, M., INGLEBY, S., BUIST, M., BAILEY, M. and EDDLESTON, J.M., 2011. Bedside electronic capture of clinical observations and automated clinical alerts to improve compliance with an Early Warning Score protocol. Critical Care and Resuscitation,
13(2), pp. 83.
KOLIC, I., CRANE, S., MCCARTNEY, S., PERKINS, Z. and TAYLOR, A., 2015. Factors affecting response to national early warning score (NEWS). Resuscitation, 90, pp. 85-90.
20 KUTNEY-LEE, A., 2009. Development of the hospital surveillance capacity profile. Research Nurse Health, 32(2), pp. 217-228.
LUDIKHUIZE, J., BORGERT, M., BINNEKADE, J., SUBBE, C., DONGELMANS, D. and GOOSSENS, A., 2014. Standardised measurement of a modified early warning score results in enhanced implementation of a rapid response system: A quasi-experimental study. Resuscitation, 85, pp. 676-682.
LUDIKHUIZE, J., SMORENBURG, S. and DE ROOIJ, S., 2012. Identification of deteriorating patients on general wards: measurement of vital parameters and potential effectiveness of the Modified Early Warning Score. Journal of Critical Care, 27, pp. 424-513.
MCGLOIN, H., ADAMS, S. and SINGER, M., 1999. Unexpected deaths and referrals to critical care of patients on general wards. Are some cases potentially avoidable? Journal of the Royal College of Physicians, 33, pp. 255-259.
MCQUILLAN, P., PILKINGTON, F., ALLAN, A., TAYLOR, B., SHORT, A., MORGAN, G., NEILSON, M. and SMITH, G., 1998. Confidential enquiry into quality of care before admission to intensive care British Medical Journal, 316, pp. 1853-1858.
MENDELEZ-TORRES, GJ., O’MARA-EVES J., BRUNTON G., CAIRD G., PETTICREW M., 2016. Interpretive analysis of 85 systematic reviews suggests that narrative syntheses and meta‐analyses are incommensurate in argumentation Research Synthesis Methods 8(1) pp. 109-118
MILES, M. and HUBERMAN, A., 1994. Qualitative Data Analysis. 2 edn. Thousand Oaks, California: Sage Publications.
MOHER, D., SHAMSEER, L., CLARKE, M., GHERSI, D., LIBERATI, A., PETTICREW, M., SHEKELLE, P. and STEWART, L.A.P.G., 2015. Preferred reporting items for systematic review and meta-analysis protocols (PRISMA-P) 2015 statement. Systematic Reviews, 4(1),. NATIONAL CONFIDENTIAL ENQUIRY INTO PATIENT OUTCOME AND DEATH. 2015. Just Say Sepsis! A review of the process of care recieved by patients with sepsis. London: NCEPOD.
NATIONAL CONFIDENTIAL ENQUIRY INTO PATIENT OUTCOME AND DEATH. 2012. Cardiac Arrest Procedures: Time to Intervene? London: NCEPOD
NIEGSCH, M., FABRITIUS, M.L. and ANHØJ, J., 2013. Imperfect implementation of an early warning scoring system in a Danish teaching hospital: a cross-sectional study. PloS one,
8(7), pp. e70068.
O'CONNOR, D., GREEN, S. and HIGGINS, J., 2008. Defining the review question and developing criterial for including studies. In: J. HIGGINS and S. GREEN, eds, Cochrane Handbook for Systematic Reviews and Interventions. Chichester: Wiley, .
ODELL, M., 2015. Detection and management of the deteriorating ward patient: an evaluation of nursing practice. Journal of Clinical Nursing, 24(1-2), pp. 173-182.
21 PATERSON, R., MACLEOD, D., THETFORD, D. and ET AL., 2006. Prediction of in-hospital mortality and length of stay using an early warning scoring system: clinical audit. Clinical Medicine, 6, pp. 281-284.
PETERSEN, J.A., MACKEL, R., ANTONSEN, K. and RASMUSSEN, L.S., 2014. Serious adverse events in a hospital using early warning score–What went wrong? Resuscitation,
85(12), pp. 1699-1703.
RESUSCITATION COUNCIL (UK)., 2010. Advanced Life Support. 6 edn. London: Resuscitation Council (UK).
SHEARER, B., MARSHALL, S., BUIST, M., FINNIGAN, F., KITTO, S., HORE, T., STURGESS, T., WILSON, S. and RAMSEY, W., 2012. What stops hospital clinical staff from following protocols? An analysis of the incidence and factors behind the failure of bedside clinical staff to activate the rapid response system in a multi-campus Australian metropolitan healthcare system. BMJ Quality and Safety, 21, pp. 569-575.
SMITH, G., 2006. Hospital-wide physiological surveillance – A new approach to the early identification and management of the sick patient. Resuscitation, 17, pp. 19-28.
SUBBE, C., DAVIES, R., WILLIAMS, E., RUTHERFORD, P. and GEMMELL, L., 2003. Effect of introducing the modified early warning score on clinical outcomes, cardio-pulmonary arrests and intensive care utilisation in acute medical admissions. Anaesthesia, 58, pp. 775-803.
THE CENTRE FOR REVIEWS AND DISSEMINATION., 2014, 2014-last update, PROSPERO. [Homepage of The Centre for Reviews and Dissemination.], [Online]. Available: http://www.crd.york.ac.uk/PROSPERO/ [02/15/2016, 2016].
WELSH, J., 2000. Using assessment to identify and prevent critical illness Nursing Times,