Adsorption of Single-Wall Carbon nanotubes at Liquid/Liquid
Interface
A thesis Submitted to the University of Manchester for the degree of
Doctor of Philosophy
In the Faculty of Science and Engineering
2017
Aminu Rabiu Koko
2 Table of Contents Abstract ... 11 Declaration ... 12 Copyright ... 12 Acknowledgment ... 13 Publications ... 14 Abbreviations ... 15 Chapter 1 Introduction 1.1 Carbon Nanotubes ... 17 1.1.2 Structure of a SWCNT ... 19 1.1.2 Methods of SWCNT Synthesis ... 21
1.1.3 Dispersion of SWCNTs in Liquid Phase ... 22
1.2 Molybdenum disulphide ... 26
1.2.1 Liquid-Phase Exfoliation of MoS2 ... 28
1.3 Particle Adsorption at Liquid/Liquid Interface ... 32
1.4 Liquid/Liquid Electrochemistry ... 37
1.4.1 Galvani Potential Difference and Nernst Equation for ITIES ... 38
1.4.2 Polarisable and Non-polarisable ITIES ... 41
1.4.3 The potential Window ... 42
1.4.4 Simple Ion Transfer across Polarised ITIES... 44
1.4.5 Facilitated Ion Transfer across Polarised ITIES ... 46
1.4.6 Electron Transfer across Polarised ITIES ... 48
1.4.7 Activity of Ionic Solutions ... 50
1.5 Aim and Objectives ... 51
1.7 Thesis Overview ... 52
Chapter 2Material and Methods 2.1 Materials ... 55
2.1.1 Chemicals... 55
2.1.2 Single Wall Carbon Nanotubes... 56
2.1.3 Other materials ... 56
2.1.4 Equipment ... 57
2.2 Methods ... 57
2.2.1 Preparation of SWCNT and MoS2 Dispersions ... 57
3
2.2.3 Stability of SWCNT Dispersion in Electrolyte Solution ... 59
2.2.4 Aggregation Kinetics of MoS2 ... 60
2.2.5 Adsorption of SWCNT at Liquid/Liquid interface ... 61
2.2.6 UV-Vis Absorption Spectroscopy ... 61
2.2.7 In-situ Optical Microscopy of Interfacial SWCNT layers ... 63
2.2.8 Contact Angle Measurement ... 64
2.2.9 Raman spectroscopy ... 66
2.2.10 Scanning Electron Microscopy ... 67
2.2.11 Atomic Force Microscopy ... 69
2.2.12 X-Ray Photoelectron Spectroscopy ... 72
2.2.13 Zeta Potential ... 73
2.3 Electrochemical Experiments ... 77
2.3.1 Liquid/Liquid Electrochemistry ... 77
2.3.2 Three-Electrode Configuration ... 80
2.3.3 Supporting Electrolytes... 81
2.3.4 Preparation of Silver/Silver Chloride Reference Electrodes ... 81
Chapter ThreeElectrostatic Stabilisation of Single Wall Carbon nanotubes Dispersed in DCE 3. Introduction ... 83
3.1 SWCNT Dispersion in DCE ... 86
3.2 Characterisation of SWCNT Dispersions ... 87
3.2.1 UV-Vis Absorbance and Extinction Coefficient Measurements ... 87
3.2.2 Atomic Force Microscopy of Dispersed SWCNTs ... 91
3.2.3 Raman Spectroscopy ... 93
The RBM Region ... 95
G and D Bands ... 99
3.2.4 X-ray Photoelectron Spectroscopy (XPS) ... 101
3.3 SWCNT Dispersion Stability ... 102
3.4 Conclusions ... 108
Chapter 4Electrochemical Characterisation of Single Wall Carbon Nanotubes Adsorption at Liquid/Liquid Interface 4.1 Introduction ... 110
4.2 SWCNT Adsorption at Water/DCE Interface ... 113
4
4.4 Microscopic Characterisation of SWCNT Interfacial Layer ... 119
4.4.1 In-situ Optical Microscopy ... 119
4.4.2 Scanning Electron Microscopy ... 122
4.5 Electrochemical Characterisation ... 123
4.5.1 Stability of SWCNT-Stabilised Interfacial Emulsions under Potential Control ... 124
4.5.2 Ion Transfer across SWCNT Interfacial Films ... 127
Background Electrolyte Response ... 127
TMA+ and PF6– Ion Transfer ... 129
4.5.3 Kinetics of Ion Transfer across the SWCNT Interfacial Films ... 141
Facilitated K+ Ion Transfer ... 144
4.6 Conclusion ... 146
Chapter 5Controlled Preparation of Carbon nanotubes/Conducting Polymer Composites at Polarisable Water/Organic Interface 5. Introduction ... 148
5.1 Mechanism of Electropolymerisation of Pyrrole ... 151
5.2 Electropolymerisation of Pyrrole in DCB at a Metallic Electrode ... 153
5.3 Voltammetry at the water/DCB interface ... 155
5.4 Electropolymerization of Py at Bare ITIES... 157
5.4.1 SEM and Raman Characterisation of PPy Prepared at the Water/DCB Interface ... 160
5.5 Preparation of SWCNT/PPy Composite at Water/DCB Interface ... 163
5.5.1 SEM and AFM Analysis of the SWCNT/PPy Composite ... 165
5.5.2 Raman Analysis of the SWCNT/PPy Composite ... 166
5.6 Conclusions ... 168
Chapter 6Aggregation Kinetics of MoS2 Dispersed in 1,2-dichlorobenzene 6. Introduction ... 170
6.1 MoS2 Exfoliation in 1,2-dichlorobenzene ... 172
6.2 MoS2 Dispersion Characterisation ... 173
6.2.1 UV-Vis Absorbance and Extinction Coefficient Measurements ... 173
6.2.2 AFM and SEM Characterisation ... 175
6.2.3 Ultra-sonication Induced Sonopolymer Formation ... 177
6.2.4 Raman Spectroscopy... 181
5
6.3 Aggregation Studies ... 183
6.3.1 Dissociation of BTPPATPBCl in DCB ... 183
6.3.2 Aggregation of Dispersed MoS2 in Electrolyte Solution ... 185
6.4 Conclusions ... 190
Chapter 7General Conclusions and Remarks for Further work References ... 196
6
List of Tables
3. 1 Diameter distribution calculated from the RBM of AD SWCNT ... 97 3. 2 Diameter distribution calculated from the of RBM CVD SWCNT ... 98 3. 3 Values obtained from fitting the data shown in Figure 3.3, together with
the relative values of [SWCNT]/[SWCNT]o in the absence of electrolyte. ... 106 4. 1 Values of interfacial tension for the water/DCE systems containing various
combinations of electrolytes. ... 118 4. 2 Values of ΔE calculated for the water/DCE systems containing various
combinations of electrolytes. ... 119
List of Figures
1. 1 Schematic representation of a graphene sheet, SWCNT and a MWCNT. ... 17 1. 2 Schematic illustration of the rolling up of a graphene sheet to form a
variety of SWCNTs. ... 20 1. 3 Crystal structure of layered MoS2... 27 1. 4 Trigonal prismatic and octahedral structures of monolayer MoS2. ... 28 1. 5 Schematic illustration of the various positions of a spherical particle at
liquid/liquid interface as a function of its contact angle. ... 35 1. 6 Schematic representation of a SWCNT oriented parallel to the liquid/liquid
interface. ... 36 1. 7 Cyclic voltammogram of an ITIES system (10 mM LiCl(aq)/10 mM
BTPPATPBCl(DCE)) illustrating the potential window for the supporting
electrolyte. ... 43 1. 8 Cyclic voltammetric response of supporting electrolytes ions and reversible
TMA+ transfer across 10 mM LiCl(aq)/10 mM BTPPATPBCl(DCE) interface. .. 46 1. 9 Schematic of mechanisms of facilitated ion transfer across polarised ITIES. . 48 1. 10 Schematic illustration of heterogeneous electron transfer at ITIES. ... 49
2. 1 Structures of the ions of the organic electrolytes, BTPPATPBCl and
BTPPATPFB. ... 59 2. 2 UV-Vis absorption spectra of SWCNT and MoS2 dispersions before and
after filtration through a 0.1 µm PDVF membrane. ... 63 2. 3 Schematic illustration of the arrangement used for in situ optical
microscopy of interfacial SWCNT layer. ... 64 2. 4 Schematic illustration of SWCNT film transfer protocol from the water/DCE
7
2. 5 Schematic representation of configuration used for the determination of three phase contact angle between a solid substrate (SWCNT) and two
immiscible liquids. ... 66 2. 6 Schematic representation of the main components of an SEM.. ... 69 2. 7 Schematic illustrations of the working principle of an Atomic force
microscope. ... 70 2. 8 Schematic illustration of the electrical double layer around a particle in a
suspension and the location of the slipping plane, where zeta potential is
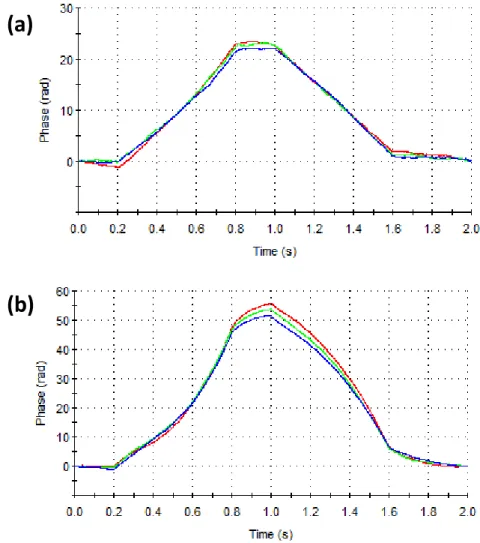
measured. ... 74 2. 9 Phase plots obtained with an applied voltage of 10 V and 20 V for MoS2
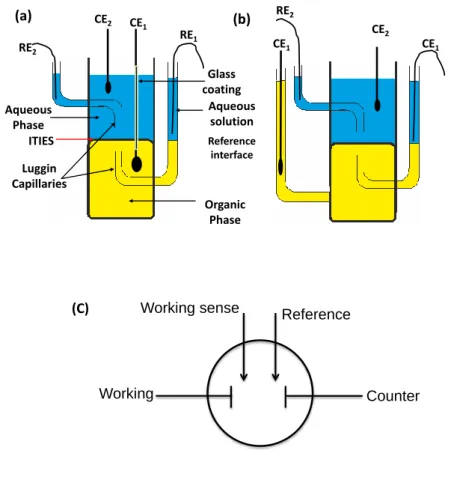
dispersion. ... 77 2. 10 Schematic of four-electrode cells used for ITIES investigations ... 79
3. 1 SWCNT in DCE dispersion immediately after sonication and centrifugation. 87 3. 2 Schematic of the electronic density of states (DOS) of metallic and
semiconducting SWCNTs.. ... 88 3. 3 UV-Vis absorption spectra of pristine CVD SWCNT and AD SWCNT
dispersions. ... 89 3. 4 Plots of absorbance vs concentration of CVD and AD SWCNT dispersions. . 90 3. 5 Representative AFM images of AD and CVD SWCNT in DCE dispersions. . 92 3. 6 AFM derived diameter and length distributions for AD and CVD SWCNT
in DCE dispersions. ... 93 3. 7 Raman spectra of AD and CVD SWCNTs obtained using a 633 nm
excitation wavelength. ... 95 3. 8 RBM spectra of AD and CVD SWCNTs excited at 633 nm and 532 nm. ... 97 3. 9 Kataura plot showing the excitation energies of two lasers. ... 99 3. 10 G and D band spectra of AD and CVD SWCNTs excited at 633 nm and
532 nm. ... 101 3. 11 XPS survey spectra of AD and CVD SWCNTs. ... 102 3. 12 SWCNTs in DCE dispersion 48 h after addition of different concentrations
of BTPPATPBCl (0–10 µ M).. ... 103 3. 13 Normalised concentration of AD SWCNT and CVD SWCNT remaining
dispersed in DCE after 48 h of sedimentation as a function of
BTPPATPBCl concentration. ... 105
4. 1 Assembly of SWCNTs at 0.1 M LiCl/DCE, 0.1 M LiCl (aq)/10 mM BTPPATPBCl (DCE), Water/10 mM BTPPATPBCl (DCE), Water/DCE and Water/DCE interfaces. ... 115 4. 2 Images showing sessile droplets of (a) DCE on Si/SiO2 wafer covered with
water (b) DCE on SWCNT film covered with water (c) DCE on SWCNT film covered with 0.1 M LiCl(aq) (c) 10 mM BTPPATPBCl(DCE) on SWCNT
8
film covered with water (d) 10 mM BTPPATPBCl (DCE) SWCNT film
covered with 0.1 M LiCl(aq).. ... 117 4. 3 In-situ optical micrographs of SWCNT adsorbed at water/DCE interface
prepared using SWCNTs concentrations of 3 and 6 mg L-1. ... 120 4. 4 Schematic illustration of processes involved in interfacial emulsion
formation... 121 4. 5 SEM images showing the morphologies of dried SWCNTs films formed at
water/DCE interface using a CSWCNT of 1 mg L-1, 6 mg L-1, 12 mg L-1 and 18 mg L-1... 123 4. 6 Schematics of the electrochemical cells used in ion transfer studies. ... 124 4. 7 In-situ optical micrograph of SWCNT interfacial film taken at applied
interfacial potential of –0.09 V, +0.01 V, +0.46 V, +0.31 V (reverse scan), +0.19 V (reverse scan) and –0.24 V (reverse scan).. ... 126 4. 8 In-situ optical micrograph of SWCNT interfacial film taken before the
application of interfacial potential and after completing one CV at a scan rate of 0.05 V s-1. ... 127 4. 9 Cyclic voltammograms of the supporting electrolytes obtained in the
absence and presence of SWCNTs films prepared at different bulk CNTs concentrations. ... 129 4. 10 Cyclic voltammogram obtained for TMA+ ion transfer across unmodified
water/DCE interface. ... 130 4. 11 Randles-Sevčik plot showing a linear relationship between the forward
peak current for TMA+ ion transfer across the unmodified water/DCE
interface and square root of the scan rate. ... 131 4. 12 Cyclic voltammograms of TMA+ transfer across water/DCE interface
modified with SWCNT films... 132 4. 13 Randles-Sevčik plot showing a linear trend between the forward peak
current for TMA+ ion transfer across SWCNT modified water/DCE
interface and square root of the scan rate. ... 133 4. 14 Cyclic voltammograms recorded for the transfer of TMA+ ion across
water/DCE interface in the absence and presence of SWCNTs films. ... 133 4. 15 Cyclic voltammogram obtained for PF6– ion transfer across unmodified
water/DCE interface. ... 134 4. 16 Cyclic voltammograms of PF6– transfer across water/DCE interface
modified with SWCNT films... 136 4. 17 (a) Plot of forward transfer peak current for TMA+ and PF6
–
ions as a function of Ѵ1/2 in the absence and in the presence of SWCNTs film prepared using CSWCNTs of 6 mg L-1. (b) Change in EP as a function of scan rate for each probe ion.. ... 137 4. 18 (a) XPS survey spectra obtained for SWCNTs layer extracted from
water/DCE interface after the transfer of TMA+ and PF6– probe ions from water to DCE phase. (b) Atomic concentrations of B, N, Cl and P
9
4. 19 Plot of the apparent rate constant versus SWCNTs concentration used in film preparation. ... 143 4. 20 (a) Cyclic voltammogram recorded for the K+ transfer facilitated by
DB18C6 across unmodified water/DCE interface. (b) Plot of forward peak current as a function of the square root of the scan rate. ... 144 4. 21 (a) Cyclic voltammogram for the K+ transfer facilitated by DB18C6 across
SWCNT-modified water/DCE interface. (b) Plot of the forward peak
current as a function of the square root of the scan rate. ... 146
5. 1 Cyclic voltammograms of polypyrrole electropolymerisation at Pt
electrode in 10 mM BTPPATPFB organic (DCB) solution.. ... 154 5. 2 Schematics of electrochemical cells used for the electropolymerisation
process. ... 156 5. 3 Cyclic voltammograms of the supporting electrolytes obtained in the
absence and in the presence of 0.1 M Py in DCB. ... 156 5. 4 Cyclic voltammogram for IrCl62− transfer across water/DCB interface
in the absence of Py in DCB phase.. ... 157 5. 5 Cyclic voltammogram recorded in the presence of both pyrrole and
IrCl62−/3- redox couple. ... 158 5. 6 Cyclic voltammogram response recorded at water/DCB interface in the
presence of only the supporting electrolytes and for the
electropolymerisation of pyrrole applying 25, 50 and 75 cycles. Scan rate. .. 160 5. 7 Raman spectra of the PPy films prepared at water/DCB interface by four
different dynamic electropolymerisation protocols: CVs at 0.1 V s-1 scan rate with 25, 50, and 75 cycles using the potential range 0.35 V to 0.87 V and by using multiple potential steps: 0.6 V, 0.09 V (open circuit potential, OPC), 0.7 V, 0.09 V and 0.8 V for 120 s, 30 s, 120 s, 30 s and 120 s,
respectively. ... 161 5. 8 SEM images showing the morphologies of the deposited PPy films
prepared at water/DCB interface by CVs at 0.1 V s-1 scan rate with
25 cycles, 50 cycles, 75 cycles, and by multiple potential steps method. ... 163 5. 9 Cyclic voltammetric response obtained at the water/DCB interface for the
electropolymerisation of pyrrole in the presence of adsorbed SWCNTs
compared to a blank response. Scan rate used was 0.1 Vs-1 ... 165 5. 10 SEM images of pristine interfacial SWCNTs and SWCNT/PPy composite
and AFM image of the composite material. ... 166 5. 11 Raman spectra of SWCNT/PPy film prepared at water/DCB interface
by 50 CV cycles at 0.1 V s-1 scan rate.. ... 168
6. 1 Photographs of MoS2 illustrating the different dispersion processing stages. 173 6. 2 UV-Vis absorption spectra of MoS2 dispersion in DCB at several dilutions. 174
10
6. 3 Plot of absorbance at 670 nm as a function of MoS2 dispersion
concentration... 175 6. 4 SEM and AFM images of solvent-phase exfoliated MoS2 in DCB
deposited on a Si/SiO2 wafe and histograms of the counted objects. ... 177 6. 5 (a) Pure-DCB ultra-sonicated for 12 hrs in a bath sonicator (b) AFM image
of the sonicated DCB deposited on a SiSiO2 wafer. (c–d) Histograms of the counted objects thickness and length, respectively. ... 179 6. 6 Effect of electrolyte on MoS2 dispersion in DCB. ... 180 6. 7 Raman spectra of bulk and solvent exfoliated MoS2. ... 182 6. 8 Molar conductivity of BTPPATPBCl in DCB as a function of the square root
of the electrolyte concentration.. ... 184 6. 9 Concentration of MoS2 as a function of sedimentation time showing that no
sedimentation of the MoS2 particles occurred during centrifugation of the control samples at 8000 rpm.. ... 187 6. 10 Aggregation profiles of MoS2 in the presence of different concentrations of
BTPPATPBCl in DCB.. ... 188 6. 11 Aggregation rate constant of MoS2 dispersed in DCB as a function of
BTPPATPBCl concentration. ... 189 6. 12 Inverse stability ratio of MoS2 aggregation as a function of electrolyte
11
The University of Manchester Aminu Rabiu Koko
Doctor of philosophy
Adsorption of Single-wall Carbon nanotubes at Liquid/Liquid Interface 2017
Abstract
In this thesis, the adsorption of single-wall carbon nanotubes (SWCNTs) at the liquid/liquid interface, and the subsequent electrochemical investigation of the electrical properties of the adsorbed nanotubes have been studied.
Prior to the adsorption of the nanotube, the stability of dispersion of SWCNTs in non-aqueous solvents was assessed by determining the onset of aggregation of the SWCNTs when organic electrolyte was introduced. It was found that electrostatic repulsion between the SWCNTs contributes significantly to the stability of the SWCNTs in non-aqueous solvents. Similar result was also found when the aggregation kinetics of molybdenum disulphide (MoS2) dispersion in non-aqueous media was studied using the same organic electrolyte.
The formation of nanomaterial-polymer composites by deliberate electrochemical oxidation of pyrrole and the sonochemical polymerisation of the organic solvent was also studied. Electrolyte addition was shown to be a promising way to separate the 2D material from the sonopolymer.
12
Declaration
I, Aminu Koko Rabiu, declare that no portion of the work referred to in this thesis has been submitted in support of an application for another degree or qualification of this or any other university or other institute of learning.
Copyright
i.The author of this thesis (including any appendices and/or schedules to this thesis) owns certain copyright or related rights in it (the “Copyright”) and s/he has given The University of Manchester certain rights to use such Copyright, including for administrative purposes.
ii.Copies of this thesis, either in full or in extracts and whether in hard or electronic copy, may be made only in accordance with the Copyright, Designs and Patents Act 1988 (as amended) and regulations issued under it or, where appropriate, in
accordance with licensing agreements which the University has from time to time. This page must form part of any such copies made.
iii.The ownership of certain Copyright, patents, designs, trademarks and other intellectual property (the “Intellectual Property”) and any reproductions of copyright works in the thesis, for example graphs and tables (“Reproductions”), which may be described in this thesis, may not be owned by the author and may be owned by third parties. Such Intellectual Property and Reproductions cannot and must not be made available for use without the prior written permission of the owner(s) of the relevant Intellectual Property and/or Reproductions.
iv. Further information on the conditions under which disclosure, publication and commercialisation of this thesis, the Copyright and any Intellectual Property and/or Reproductions described in it may take place is available in the University IP Policy (see http://documents.manchester.ac.uk/DocuInfo.aspx?DocID=487), in any relevant Thesis restriction declarations deposited in the University Library, The University Library’s regulations (see http://www.manchester.ac.uk/library/aboutus/regulations) and in The
13
Acknowledgment
First and foremost, I would like to give my special thanks to my supervisor, Prof. Robert Dryfe for his continuous support, patience and guidance throughout my PhD research period. I would also like to thank Kebbi State University of Science and technology, Aliero (KSUSTA) in collaboration with Tertiary Education Trust Fund (TETFund) Nigeria for funding of my studentship. Thanks also to the staff at the NEXUS facility, Newcastle University for carrying out all my XPS measurements. Special thanks go to Dr Peter Toth and Dr Andrew Rodgers for their support and guidance and to all members of the electrochemistry group who helped in my project directly or indirectly.
My acknowledgment would not be complete without thanking my family members and friends for their support and understanding.
14
Publications
Aminu K. Rabiu, Peter S. Toth, Andrew J. N Rodgers and Robert A. W. Dryfe, Electrochemical investigation of adsorption of single wall carbon nanotubes at liquid/liquid interface, Chemistry open, 6, 57-63 (2017).
Peter S. Toth, Matěj Velický, Mark A. Bissett, Thomas J. A. Slater, Nicky Savjani, Aminu K. Rabiu, Alexander M. Rakowski, Sarah J. Haigh, Paul O'Brien, and Robert A. W. Dryfe, Asymmetric MoS2-Graphene sandwiches: preparation, functionalization and application, Adv. Mater., 28, 8256-8264 (2016).
P. S. Toth, A. N. J. Rodgers, A. K. Rabiu, D. Ebanez, J. X Yang, A. Colina and R. A. W. Dryfe. Interfacial doping of carbon nanotubes at polarisable organic/water: a liquid/liquid pseudo capacitor, J. Mater. Chem. A, 4, 7365-7371(2016)
P. S. Toth, A. K. Rabiu and R. A. Dryfe, Control preparation of carbon nanotube-conducting polymer composites at polarisable organic/water interface, Electrochem. Commun., 60, 153-157 (2015).
P.S. Toth, A.N.J. Rodgers, A.K. Rabiu and R.A.W. Dryfe, “Electrochemical
activity and metal deposition using few-layer graphene and carbon nanotubes assembled at the liquid–liquid interface”, Electrochem. Commun., 50, 6-10 (2015) P.S. Toth, S.J. Haigh, A.K. Rabiu, A.N.J. Rodgers, A. Rakowski and R.A.W.
Dryfe, Preparation of low dimensional carbon material-based metal nanocomposites using a polarisable organic/water interface, J. Mater., Res., 30, 2679-2687 (2015).
15
Abbreviations
AD Arc discharge
AFM Atomic force microscopy Ag/AgCl Silver/silver reference electrode
BTPPA Bis(triphenylphosphoranylidene)ammonium
BTPPACl Bis(triphenylphosphoranylidene)ammonium chloride BWF Breit–Wigner–Fano
CCC Critical coagulation concentration CE Counter Electrode
CNT Carbon nanotube CV Cyclic voltammetry
CVD Chemical vapour deposition DB18C6 Dibenzo-18-crown-6 DCB 1,2-Dichlorobenzene DCE 1,2-Dichloroethane
DLVO Derjaguin, Landau, Verwey and Overbeek DMF Dimethylformamide
DMSO Dimethyl sulphoxide DOS Density of states EDL Electrical double layer
ITIES Interface between two immiscible electrolyte solutions NMP N-Mehtyl-2-pyrrolidone
PTFE Polytetrafluoroethylene PVDF Polyvinylidene fluoride PF6 hexafluorophosphate
16
Py Pyrrole
PPy Polyppyrrple
RBM Radial breathing mode RE Reference electrode
SEM Scanning electron microscopy SWCNT Single-wall carbon nanotube TBA Tetrabutylammonium
TFPB Tetrakis[3,5-bis-(trifluoromethyl)phenyl]-borate TMA+ Tetramethylammonium ion
TPB Tetraphenylborate
TPBCl Tetrakis(4-chlorophenyl)borate TPFB Tetrakis(pentafluorophenyl)borate ion TPA Tetraphenylarsonium
TPrA Tetrapropylammonium UV-Vis Ultraviolet –Visible vHs van Hove singularities VdWs van der Waals
WE Working electrode
17
Chapter 1
Introduction
1.1 Carbon Nanotubes
Carbon nanotubes (CNTs) have been extensively studied since their discovery in 1991 by Iijima1 due to their remarkable physical and structural properties. They are composed of a single or few-layer thick graphene sheet seemingly rolled-up into seamless cylindrical tubes (Figure 1.1). The ends of the tubes may be open or closed by a hemi-fullerene.2 Graphene is a single sheet of graphite, one atom thick, consisting entirely of sp2 hybridized carbon atoms arranged in a hexagonal honeycomb lattice.3
Figure 1. 1. Schematic representation of a graphene sheet, SWCNT and a MWCNT.
As indicated in Figure 1.1, the two main types of CNTs are single-wall carbon nanotubes (SWNTs) and Multiwall carbon nanotubes (MWCNTs). SWNTs consist of a single cylindrical layer of graphene sheet, whilst MWCNTs are composed of more than one layer of graphene rolled into concentric cylinders, with a
Graphene
SWCNT
18
spacing of 0.34 nm between the individual cylinders.2 The diameters of the nanotubes are typically 0.8 – 2 nm for SWCNTs and 5 – 20 nm for the MWCNTs, whilst their lengths range from about 100 nm to several centimetres.2 Thus, CNTs possess large length to diameter ratio (aspect ratio, 102 – 107), and are commonly regarded as quasi-one-dimensional (1D) nanostructures.4, 5
CNTs hold great potential for numerous applications, including fillers in nanocomposite materials,1 nanoelectronics,6 field effect transistors,7 electrochemical and sensor devices5, 8 and as catalyst support.9, 10 These applications are suggested based on the unique material properties exhibited by the nanotubes. For example, CNTs possess excellent mechanical properties, with a reported Young’s modulus of ~1 TPa and a tensile strength that is between 10–100 times higher than that of steel.1, 11
A thermal conductivity of 3500 W m-1 K-1 has been measured at room temperature for a SWCNT;12 this value is impressively higher than that of diamond (2000 W m-1 K-1).2 In metallic SWCNTs and MWCNTs, the electronic transport takes place ballistically (i.e., electrons transport through the nanotube without scattering) for distances in the range of microns, enabling the nanotubes to carry a large amount of current without dissipating heat.5, 13 CNTs have been shown to tolerate current densities in excess of 109 A cm-2,14 which is ca. three orders of magnitude greater than copper.11, 13 In the case of semiconducting SWCNT, ballistic electron transport is also possible, but occurs only over nanotube lengths in the range of a few hundreds of nanometres.11, 15 Moreover, CNTs exhibit a large surface area, up to 1500 m2 g-1 and good chemical stability.11
19
1.1.2 Structure of a SWCNT
As mentioned previously, a SWCNT can be visualized as a single layer of graphene sheet rolled into a cylindrical tube. Depending on the direction about which the graphene sheet is rolled, various kinds of SWCNTs are produced (Figure 1.2). The structure, diameter and physical properties of each SWCNT are stated by a chiral vector, Ch, which is defined by the relation
Ch = na1+ ma2 (1.1) where the integers n and m are called chiral indices and denotes the number of unit vectors (a1 and a2) in the hexagonal honeycomb lattice.5, 16, 17 The diameter dt and the chiral angle, θ , (angle between Ch and a1 direction) can be expressed in terms of the integers, 𝑛 and 𝑚 as17, 18
dt= Ch⁄π =
a
π√n2+ nm + m2 (1.2)
θ = tan-1[√3m/(2n + m) ] (1.3)
where a is the lattice constant of the hexagonal honeycomb lattice, which is given as
𝑎 = √3 × 𝑎𝑐𝑐 (𝑎𝑐𝑐 is the C-C bond length, which is ~ 0.142 nm in graphite), and Ch is the length of the chiral vector, Ch.
20
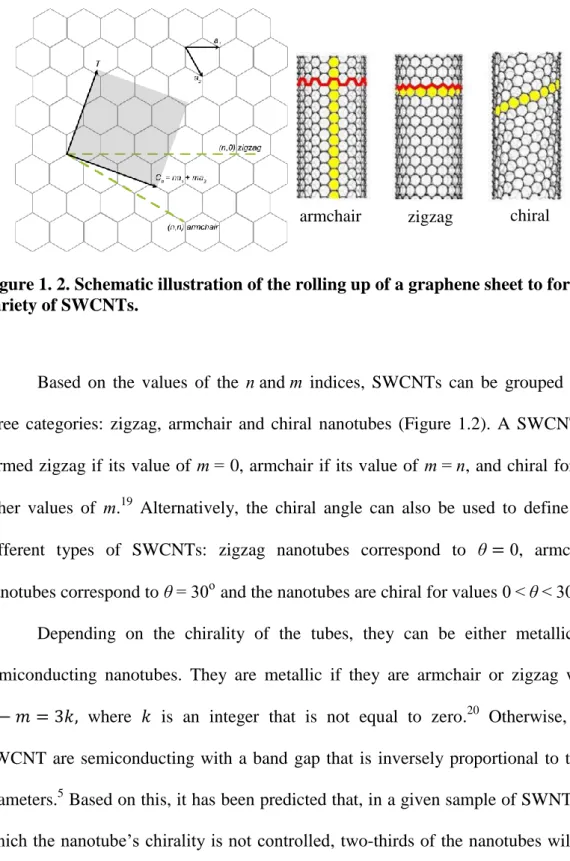
Figure 1. 2. Schematic illustration of the rolling up of a graphene sheet to form a variety of SWCNTs.
Based on the values of the n and m indices, SWCNTs can be grouped into three categories: zigzag, armchair and chiral nanotubes (Figure 1.2). A SWCNT is termed zigzag if its value of m = 0, armchair if its value of m = n, and chiral for all other values of m.19 Alternatively, the chiral angle can also be used to define the different types of SWCNTs: zigzag nanotubes correspond to θ= 0, armchair nanotubes correspond to θ = 30o and the nanotubes are chiral for values 0< θ <30o.17
Depending on the chirality of the tubes, they can be either metallic or semiconducting nanotubes. They are metallic if they are armchair or zigzag with
𝑛 − 𝑚 = 3𝑘, where 𝑘 is an integer that is not equal to zero.20 Otherwise, the SWCNT are semiconducting with a band gap that is inversely proportional to their diameters.5 Based on this, it has been predicted that, in a given sample of SWNTs in which the nanotube’s chirality is not controlled, two-thirds of the nanotubes will be semiconducting and one-third will be metallic.21
21
1.1.2 Methods of SWCNT Synthesis
There are currently three main methods, namely, arc discharge (AD), laser ablation and chemical vapour deposition (CVD), that can be used to synthesise SWCNTs. These methods can allow high-quality and bulk quantities of SWCNTs to be produced.22 The AD technique, initially applied for the synthesis of fullerenes, was the earliest method to be utilised to grow SWCNTs.23, 24 In this method, a potential difference is applied across two graphite electrodes contained in a reaction chamber filled with an inert gas, such as helium or argon. As the electrodes are brought into close proximity, an arc is produced which results in the vaporisation of the graphite anode to form CNTs.19, 25 The nanotubes produced in this way are usually MWCNTs. To form SWCNTs, a metal catalyst (e.g., cobalt, iron, nickel-yttrium mixture, etc.) has to be incorporated into the arc-discharge system.19, 26 A yield of 70 – 90% SWCNTs has been obtained with the nickel-yttrium catalyst using this technique.26 The main advantage of AD method is that SWCNTs with a high degree of structural perfection can be produced by careful control of process parameters since high temperatures (> 2000 K) are used in the synthesis.19, 27 However, a major drawback of this technique is that the SWCNTs are formed alongside other carbonaceous impurities (usually, fullerenes, amorphous carbon and graphitic polyhedrons) and metal catalysts, thereby necessitating post-synthesis purification.28
The laser ablation method, initiated by the Smalley’s group,29 was the next method to be applied for the synthesis of SWCNTs. In this technique, a high power laser is used to vaporise a graphite/metal (e.g., Ni-Co) composite target contained in a chamber heated to 1200 °C. The chamber is filled with a flowing inert gas, which during synthesis sweeps the produced nanotubes to a water-cooled copper collector
22
placed outside the reaction chamber. The laser ablation method has been used to obtained high quality SWCNTs with a yield comparable to that of AD method.30 The main disadvantage of this technique, however, is that it is relatively more expensive than the AD method, as it requires high purity graphite rods, high laser powers and produces lower amounts of SWCNTs per day.20
The CVD technique is generally considered as the most promising method for industrial synthesis of SWCNTs because it can be easily scaled-up and, also, allows more control over the morphology and structure of the formed nanotubes.22 In this technique, the carbon source is a hydrocarbon gas (acetylene or methane), which is made to flow along with an inert gas into a tube furnace reactor inside which a metal catalyst (usually, iron, nickel or cobalt nanoparticles) is deposited on a solid substrate. The furnace is typically held at temperatures between 500 °C and 1000 °C. The catalytic thermal decomposition of the hydrocarbon gas is followed by nucleation and growth of the SWCNTs. The yield of SWCNT is very high as compared to the other methods. One of the main advantages of this method is that it allows the growth of nanotubes directly on conventional, as well as patterned, solid substrates. There are several variants of CVD process that can be used to synthesise SWCNTs. One such method is the high pressure carbon monoxide (HipCO) method, in which carbon monoxide is used as the carbon feedstock and iron pentacabonyl, Fe(CO)5, is employed as the catalyst precursor.19, 22, 28
1.1.3 Dispersion of SWCNTs in Liquid Phase
Owing to strong tube-tube attractive Van der Waals interaction and the hydrophobic graphene surface, as-produced SWCNTs tend to aggregate into bundles or ropes and are not easily dispersed in either water or organic solvents. Presently,
23
there are three main approaches that can be used to disperse SWCNTs in the liquid phase. The first approach involves coating or wrapping the SWCNTs with a dispersant material, typically a surfactant,31, 32 a polymer33 or a biomolecule34 to aid their solubilisation in a given solvent. Mechanical agitation (ultra-sonication or high shear mixing) is usually applied to help in de-bundling and dispersing the nanotubes.32 The coated or wrapped nanotubes are stabilised in the surrounding solvent medium by steric hindrance or electrostatic repulsion, arising from the adsorption of surfactant molecules onto the SWCNTs.32, 35 One of the main advantages of this strategy is that water is frequently used as the dispersing medium, which is particularly important for a myriad of applications in which water must be used. Additionally, it also allows high weight fractions of SWCNTs to be suspended; up to 20 mg mL-1 of SWCNTs has been successfully dispersed with the aid of a surfactant.31 However, the introduction of a third component into the system, which may be difficult to remove, is undesirable in many applications and most fundamental investigations.
The second approach that has been used to disperse SWCNTs in liquid phase is chemical functionalisation of the SWCNT sidewalls or ends caps prior to their dissolution. This approach has been used to increase the dispersibilty of SWCNTs in both water36 and various organic solvents.37 Several functionalisation strategies, including halogenation, oxidation, thiolation, amidation, esterification, radical addition, cycloaddition and electrochemical reduction have been employed and varying levels of enhancement in dispersibility has been achieved.38 However, this approach results in the modification of the intrinsic properties of the SWCNTs and must be avoided in the case of investigations aimed at studying the pristine properties of the SWCNTs.38, 39
24
In order to avoid perturbation of the nanotube’s intrinsic properties or the introduction of a third component into the system, the direct dispersion of pristine SWCNTs into non-aqueous solvents has been widely used. As in the case of aqueous dispersion preparation, ultrasonication is used to de-bundle and disperse the nanotubes in the non-aqueous solvents. To date, a large number of common solvents have been tested and varying degrees of exfoliation and dispersion quality demonstrated.40, 41 42 Amongst the successful solvents, cyclohexyl-pyrrolidone (CHP), N-methyl-2-pyrroldone (NMP) and N, N-dimethylformamide (DMF) are commonly regarded as the best for dispersing pristine SWCNTs.35, 42, 43 Other solvents, which have been shown to successfully exfoliate and disperse SWCNTs include, 1,2-dichloroethane (DCE)44-46 and 1,2-dichlorobenzene (DCB).40, 47 These latter solvents are particularly relevant to the work described in this thesis.
There have been numerous studies aimed at understanding what distinguishes a “good” solvent for dispersing SWCNT from a “bad” one.35, 42, 48-50 The majority of these studies have been based on solubility parameters, including the Hildebrand solubility parameter, Hansen solubility parameters and solvent surface energy. Initially, the Hildebrand solubility parameter was applied to study the dispersibility of SWCNTs in a range of solvents.40, 42, 48, 49 The Hildebrand or total solubility parameter (𝛿T), defined as the square root of the cohesive energy density (Equation 1.4), is a numerical value that indicate the total attractive intermolecular forces that must be overcome when dispersing solute molecules in a given solvent.51 Solvents whose Hildebrand parameter matches that of the solute are regarded as “good” solvents. In the case of SWCNTs, it was found that the Hildebrand parameter is not specific enough to predict good nanotubes solvents as only a fraction of the solvents with the appropriate 𝛿𝑇 values were found to disperse SWCNTs.42, 49, 50
25 δT= 𝑐1/2=(∆H−RT Vm ) 1 2 (1.4)
where c = cohesive energy density, ∆H = enthalpy of vaporisation, R = gas constant,
T = temperature and Vm = molar volume. This led to the consideration of the Hansen solubility parameters, which arise on the basis that the cohesive energy density of a material (i.e., Hildebrand solubility parameter) is the sum of three different intermolecular interactions, namely, dispersive (δD), polar (δP) and hydrogen bonding (δH) interactions (δT = δD+δP+δH).52 Therefore, by taking into account the different interactions, a clearer picture of the contribution of each component to the total interactions can be obtained. By using the set of thee Hansen parameters, Bergin et al.42 found that SWCNTs were dispersed in solvents with δD in the range 17–18 MPa1/2, δP in the range 5 < δP < 14 MPa1/2 and δH in the range 3 < δP < 11 MPa1/2. Similar results were also demonstrated by other researchers.49, 50 However, while the Hansen solubility parameters could be useful in predicting nanotube solvents, it was also observed that many solvents having the correct Hansen parameters were not effective at dispersing SWCNTs.42
Since SWCNTs exhibit a well-defined surface, it was suggested42, 53 that the surface energies rather than the cohesive energies should best describe the nanotube-solvent interactions. Indeed, it was demonstrated experimentally that nanotube-solvents with surface energies close to that of SWCNTs (ca. 70 mJ m2) were successful at dispersing SWCNTs.42, 53 However, many solvents with surface energies close to 70 mJ m2 were also found to be ineffective at dispersing SWCNTs.42 In addition solvents with very similar surface energies were observed to demonstrate different nanotube dispersibility. Therefore, while both the Hansen solubility parameters and
26
the solvent surface energy can be used as a guide to predict SWCNTs solvents, further work is needed to fully understand SWCNT dispersibility in non-aqueous solvents.
1.2 Molybdenum disulphide
The recent isolation of two-dimensional (2D) graphene and the demonstration of its exotic properties,54, 55 have led to an upsurge of renewed interest in other 2D layered materials, particularly the transition metal dichalcogenides (TMDs).56, 57 Layered TMDs are a family of materials with the general formula MX2, where M is a transition metal element (e.g., Nb, Ta, W, Mo) and X is a chalcogen atom (e.g., S, Se, Te).56, 58 Historically, this family of materials have been studied and used in various applications including lithium ion batteries, dry solid lubricants and catalysis.59, 60 The exfoliated forms of the layered TMDs exhibit a diverse range of interesting mechanical, optical, thermal and electronic properties, due to surface and quantum confinement effects.61 These properties are different from, but complementary to, those of graphene.56, 62 While graphene is a zero-band gap semiconductor, single-layers of TMDs show sizeable bandgaps, which is important for a range of applications, such as electronics and optoelectronics.56, 62 Among the different members of the TMDs family, molybdenum disulphide (MoS2) has received the most attention due to its unique optical, catalytic and electronic properties.57, 63, 64 For instance, MoS2 in its three-dimensional (3D) bulk form possesses an indirect band gap of 1.2 eV, but changes to a direct band gap of 1.8 eV upon exfoliation down to a monolayer,62 and exhibits strong photoluminescence.65 The field-effect transistor fabricated from monolayer MoS2 has been shown to demonstrate carrier mobility of about 200 cm2 V-1 s-1 and a current on/off ratio of 1 × 108.66 Additionally,
27
single-/few-layer MoS2 has demonstrated promise as a catalysis for hydrogen evolution reaction (HER) and energy storage devices.67
Figure 1. 3.Crystal structure of layered MoS2. Adapted with permission from ref.66 Copyright 2011 Macmillan Publishers Ltd.
A single-layer or monolayer MoS2 consists of a hexagonal layer of molybdenum atoms sandwiched between two layers of sulphur atoms, in the form S-Mo-S (Figure 1.3).63 The thickness of the three atoms (S-Mo-S) layer is reported to be in the range 0.6–0.7 nm.63, 68 Bulk MoS2 crystals are constructed from these S-Mo-S layers, while individual monolayers are attached to each other via van der Waals interaction forces, just as in the case of graphite.56, 63 Because of the weak van der Waals interaction energies between the single layers, MoS2 crystals can readily be exfoliated down to single- or few-layers 2D structures. Depending on the coordination of the Mo atoms, monolayer-MoS2 can occur in either the trigonal prismatic (2H-MoS2) phase or in an octahedral (1T-MoS2) phase (Figure 1.4).64, 68
6.5 Å
28
The two crystal phases exhibit different electronic properties and stabilities; 2H-MoS2 is semiconducting and thermodynamically stable while 1T-MoS2 is metallic and metastable.61, 67, 68 The 1T-MoS2 is believed to exhibit superior electrocatalytic activity towards hydrogen evolution reaction than the 2H-MoS2, with charge transfer kinetics cited as one of the key factors responsible for the enhancement.69-71 Interconversion between the two different phases has been demonstrated; 2H-MoS2 can be converted via intercalation with alkali metals (e.g., Li or K) to 1T-MoS2,72, 73 and since the latter is thermodynamically less stable, it converts slowly during storage at room temperature back to the 2H-MoS2 phase.74 2H-MoS2 has also been obtained by annealing freshly prepared 1T-MoS2at 300 °C.73
Figure 1. 4.(a)trigonal prismatic and (b) octahedral structures of monolayer MoS2. The purple and yellow spheres represent molybdenum and sulphur atoms, respectively. Adapted with permission from ref.68 Copyright 2013 Macmillan Publishers Ltd.
1.2.1 Liquid-Phase Exfoliation of MoS
2Several methods have been employed to date to prepare single- or few-layer MoS2. The first method that was used to isolate high quality single-layer MoS2 is micromechanical cleavage.75 This method involves using adhesive tape to detach
Trigonal Prismatic Octahedral
29
atomically thin flakes from the bulk MoS2 crystals. The detached single- or few-layer crystals can easily be transferred to a substrate (often, Si/SiO2 because it allows the prepared nanosheets to be optically detected).56, 63, 66 Although this method produces the highest quality single-MoS2 nanosheets, it suffers from lack of scalability and control over the size and thickness of the MoS2 layers.56, 63 As such, the application of this method is limited, largely, to fundamental characterisations as well individual device fabrication.65, 68, 76 For fundamental and practical applications requiring large quantities of exfoliated MoS2 nanosheets, liquid phase-exfoliation methods are commonly utilised. These methods are not only capable of producing large quantities of single- and few-layer MoS2, but also, allow for solution-based processing of the resultant dispersion, such as deposition on solid substrates, formation of thin or free-standing films and nanocomposite materials, which can be prepared by simple mixing of the suspension with other nanomaterials.77-80 There are many approaches that have been used to obtain MoS2 nanosheets in the liquid-phase. These include chemical or electrochemical lithium-intercalation, followed by exfoliation in water or ethanol, and exfoliation by direct ultrasonication in appropriate organic solvents, aqueous-surfactant solutions or polymer solutions.77, 81, 82
1.2.1.1 Chemical and Electrochemical Lithium-Intercalation Methods
Although the chemical lithium-intercalation and exfoliation of bulk MoS2 into single-layers was first reported in 1986,83 dedicated effort on isolation and deposition of high quality monolayer MoS2 sheets was only reinitiated recently after the discovery of graphene.68, 73, 84 In a typical procedure, the bulk MoS2 powder is soaked in a solution containing organic-based lithium intercalant, such as n -butyllithium (n-BuLi) or lithium borohydride (LiBH4) for 1–3 days to allow lithium
30
to intercalate between the sheets of the MoS2. When the intercalated MoS2 is exposed to water, the lithium reacts vigorously with the water evolving hydrogen gas, which separates the MoS2 layers, forming a colloidal suspension.83-86 The MoS2 nanosheets are stabilised electrostatically by a surface charge (presence of OH– groups).83, 85 Ultrasonication is typically employed to aid in the exfoliation of the nanosheets.83-86 Although a high yield of monolayers can be obtained using this method, it has some drawbacks, which includes extreme environmental sensitivity, long lithiation time (1- 3 days) and cleaved reaction temperature (e.g. 100 °C).73, 84
In order to overcome some of the drawbacks of the chemical exfoliation method, Zeng et al.87 proposed an alternative approach that uses electrochemical control to drive the lithium intercalation process. Lithium insertion into the MoS2 inter-sheets occurs during galvanic discharge of the electrochemical cell, which comprised of bulk MoS2-containing cathode and a lithium foil anode (serves as lithium ion source). As before, the lithium-intercalated species are exfoliated in water or ethanol via ultrasonication. The use of electrochemical control to intercalate lithium into the MoS2 nanosheets has made the process faster, requiring only few hours (e.g., 6 h) as compared to days for the case of chemical lithium-intercalation route. Moreover, the amount of lithium inserted can be monitored and accurately controlled, which is advantageous as sufficient lithium-intercalation can be achieved, and the decomposition of the lithium-intercalated species into metal nanoparticles and LiS2, due to over-lithiation, can also be avoided.
Generally, the lithium-intercalation approach produces nanosheets which differ with respect to their structure and electronic properties from those of the bulk starting material.73, 88 Specifically, the molybdenum atom coordination changes from
31
trigonal prismatic (2H), associated with the pristine MoS2, to octahedral (1T), while the electronic structure changes from semiconducting to metallic.73 As mentioned previously, annealing at 300 °C can lead to the conversion of the metallic 1T-MoS2 to the semiconducting 2H-MoS2, though 100% conversion is not usually achieved.73
1.2.1.2 Direct Exfoliation of MoS2 in Liquids
An effective alternative route to using lithium-intercalation is the direct exfoliation of MoS2 in suitable organic solvents, surfactants or polymer solutions. First described by the Coleman group,77, 89 this represents a simple, scalable and inexpensive strategy that can be used to prepare pristine (2H) 2D MoS2 nanosheets in solution. This approach is similar to that described in section 1.1.3 for the case of SWCNT dispersion preparation. Typically, the bulk MoS2 is submerged in an appropriate liquid medium and sonication is used to provide energy sufficient enough to overcome the van der Waals interlayer attraction, resulting in the exfoliation of the MoS2 nanosheets in solution. When water is used as the dispersion medium, a third phase component (e.g., a surfactant) must be incorporated as a stabiliser.81, 90 In this case, the nanosheets are stabilised against re-stacking either by steric or electrostatic repulsive interaction arising from the adsorption of the surfactant molecule on the nanosheets.81, 90 Alternatively, the deliberate addition of a stabilising agent can be avoided by exfoliating the nanosheets in specific organic solvents.77, 78 A wide range of organic solvents have been used to exfoliate and disperse MoS2 nanosheets, with NMP and CHP appearing to be the most successful.89 It is important to note that these solvents were also among the best solvents for dispersing SWCNTs. Direct solvent exfoliation produces mostly few-layer MoS2 nanosheets, with small lateral size (50–1000 nm).77 As with SWCNTs, attempts to describe the stabilisation
32
mechanism in terms of solvent solubility parameters have been reported and it was suggested that MoS2 were dispersed in solvents that had surface energies close to that of nanosheets (~70 mJ m-2, estimated by the authors from the exfoliation work and inverse gas chromatography measurements).89 In addition the Hansen solubility parameters were also suggested to be useful in describing MoS2 dispersibility.89 However, not all solvents exhibiting the correct surface energy or Hansen solubility parameters were efficient in dispersing MoS2, suggesting that as with SWCNTs further work is needed to fully understand MoS2 dispersibility in non-aqueous solvents.
1.3 Particle Adsorption at Liquid/Liquid Interface
The adsorption of colloidal particles at liquid/liquid interfaces was first described by Ramsden91 and Pickering92 more than 100 years ago. Pickering92 demonstrated that different micrometre size solid particles can adsorb at the interface between two immiscible liquids and generate a resistant film, which inhibits droplet coalescence, thereby stabilising emulsion droplets. Although using particles as emulsion stabilisers may have several advantages over surfactant stabilisation (e.g.,
better emulsion stability), little attention was paid to the former approach until recently, with the renewed interest attributed to the present activity in nanoscale technology for fabrication of functional nanomaterials.93, 94 There is also considerable interest in solids adsorbed at liquid/liquid interfaces for applications in catalysis and sensing.95 The benefits of using liquid/liquid interfaces for the self-assembly of nanostructures is that the interface is defect-free and dynamic, allowing errors generated during the assembly to be corrected easily.96 Several groups have successfully demonstrated the self-assembly of various kinds of nanoscale objects
33
including metal nanoparticles,97, 98 two-dimensional (2D) nanomaterials (e.g.,
graphene99, 100 and MoS2101) and CNTs102-106 at the liquid/liquid interface. Depending on whether the liquid/liquid interface is curved (i.e., involving emulsion droplets) or flat, the resultant particle assembly can form rings,106 microporous capsules107 or 2D nanoparticle films, localised between the bulk liquid phases97.
Generally, the adsorption of colloidal particles from either the organic or aqueous phase to the water/oil interface is considered to be driven by a decrease in the free energy of the interface.95, 96, 108 When a single spherical particle with radius,
r, is adsorbed at the water/oil interface, the decrease in the interfacial energy from an initial value, E0 (before adsorption) to a final one E1 (after adsorption) is given by109
∆E=E0 −E1 = − πr2 γo w⁄ [γo w⁄ − (γp w⁄ −γp o⁄ )] 2 (1.5)
where ∆𝐸 is the desorption energy (i.e., the energy input required to desorb the particle), γo w⁄ , γp w⁄ and γp o⁄ are the interfacial tensions arising from the oil/water, particle/water and particle/oil interfaces, respectively.
Equation 1.5 shows that for a given liquid/liquid system (keeping γo w⁄ , γp w⁄ and γp o⁄ constant), the reduction in interfacial energy increases with increasing particle size, r2. This means that larger particles will form more stable assemblies at the liquid/liquid interface than smaller ones. For micron-size particles, the energy required to desorb a particle is typically much larger than the thermal energy, kbT, (on the order of 107 kbT)96. As a result of this, micron-sized particles are generally held irreversibly at the liquid/liquid interface. On the other hand, nanometre sized particles exhibit desorption energy that is comparable to the thermal energy. This
34
leads to a dynamic adsorption of these nanoparticles to the interface, with particles being reversibly adsorbed and desorbed.109, 110
Besides particle size, the interfacial tensions γo w⁄ , γp w⁄ and γp o⁄ (i.e., wettability of a particle surface) also controls the strength with which a particle is adsorbed at liquid/liquid interface (Equation 1.5). Practically, the measurement of
γp w⁄ and γp o⁄ is not straightforward, and often the three-phase contact angle (𝜃) between the solid and the two immiscible liquid phases is used as a measure of particle wettability. The three-phase contact angle is related to the interfacial tensions of the three phases by Young’s equation (Equation 1.6)111
cosθ=γp/o−γp/w
γw/o (1.6)
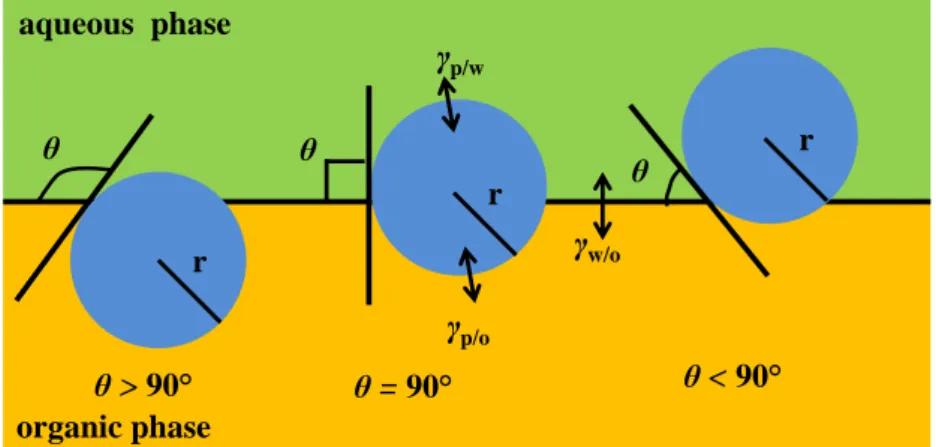
By convention, 𝜃 is measured through aqueous phase. As shown in Figure 1.5, when
𝜃 < 90° the particle is hydrophilic and a larger portion of the particle is located in the bulk of the water phase. If 𝜃 >90° the particle is hydrophobic and a larger portion of the particle is located in the bulk of the oil phase. When 𝜃 is around 90°, the particle prefers to sit at the interface between the two bulk liquid phases.111, 112
35
Figure 1. 5. Schematic illustration of the various positions of a spherical particle at liquid/liquid interface as a function of its contact angle.
Using the three-phase contact angle, the desorption energy of a spherical particle can be more easily calculated by employing the following Equation (1.7):93
∆E= πr2γ
o w⁄ (1 ± cos 𝜃)2 (1.7) The sign inside the bracket of Equation 1.7 is positive for particle removal from the liquid/liquid interface into the organic phase and negative for removal into the aqueous phase.
It is important to note that Equations (1.5) and (1.7) are only applicable to spherical particles. For rod-like or cylindrical particles, such as SWCNTs, the expressions must be modified to account for the particle’s geometry. Wang et al.,113 have recently derived an expression for the change in interfacial energy (∆E) due to the adsorption of a SWCNT at the liquid/liquid interface (Equation 1.8), where L and R are the length and radius of the SWCNT, respectively.
∆E= − 2RLγow(πθ/180° cosθ−sinθ) (1.8) organic aqueous aqueous phase organic phase r r r θ >90 θ = 90 θ <90 θ θ θ γp/o γp/w γw/o
36
In the above equation, SWCNT are assumed to adsorb with their long axis parallel to the liquid/liquid interface (Figure 1.6) because of their large aspect ratio.105, 114, 115 On the basis of Equation 1.8, bundles and full-length nanotubes should be more effective at stabilising liquid/liquid interfaces than individual or short-length nanotubes. Using Equation 1.8, Wang et al.113 estimated ∆E to be about 200 kbT for an individual SWCNT and 4500 kbT for a bundle of the same length comprising 710 individual tubes (the length and diameter of the nanotubes were however not specified). It has also been observed experimentally that short-length nanotubes produced by acid cut procedure exhibit reduced emulsion stabilisation capabilities compared to longer nanotubes.116 Further discussion on CNT adsorption at liquid/liquid interfaces is presented in chapter 4.
Figure 1. 6. Schematic representation of a SWCNT oriented parallel to the liquid/liquid interface.
organic aqueous
aqueous phase
37
1.4 Liquid/Liquid Electrochemistry
Liquid/liquid electrochemistry is concerned with the study of electrochemical processes occurring at the interface between two immiscible electrolyte solutions (ITIES). Typically, one of these solutions is an aqueous electrolyte and the other is a polar organic solvent containing an electrolyte. The organic solvent should be of moderately high relative permittivity (εr), typically in the range 10–35,117, 118 so as to allow the dissociation of the dissolved electrolyte. Several organic solvents have been used in ITIES studies, with the most common ones being nitrobenzene (NB, εr = 34.8),119 and DCE (εr = 10.36)120. Hydrophobic room temperature ionic liquids (RTIL) have also been used in place of organic electrolyte.121, 122 The presence of electrolytes makes the respective phases conductive and allows external control of the electrical potential difference across the interface. Under proper set-up, the ITIES acts in a similar way to the metal/electrolyte interface. The difference between the two is that, in the case of the metal/electrolyte interface, current is observed due to redox reactions taking place on the surface of the electrode, whilst interfacial transper of charged species (either ions or electrons) governs the observed current flow for the case of ITIES.123-125 Due to this similarity in behaviour of the two interfaces, many of the established electrochemical methods, such as chronoamperometry, cyclic voltammetry and impedance spectroscopy can be utilised in ITIES studies.119, 120, 124-127
The history of studies on the ITIES dates back to the end of nineteenth and the beginning of twentieth centuries, but major progress in the field started only in the 1970s after it was demonstrated that the ITIES could be polarised electrochemically.123, 128-132 The introduction of a four-electrode potentiostat, with positive feedback loop to allow the elimination of ohmic drop, by Samec and
co-38
workers130, 133 during this period was a major development that advanced electrochemical measurements at the ITIES.
There are two main factors that make electrochemical studies at the ITIES of great interest. Firstly, the ITIES can serve as a simple model of biological membranes for investigating many important biological processes, such as ion transfer.134 Secondly, charge transfer reactions across liquid/liquid interfaces have a wide range of applications in chemistry, including solvent extraction,135 electrocatalysis136, 137 and phase transfer catalysis,138 amperometric sensors139 and electroanalysis140. Recently, the functionalisation or modification of liquid/liquid interfaces with metal or semiconducting nanoparticles, carbon nanostructures (including graphene and CNTs) has attracted significant attention for a range of applications, particularly, optics, catalysis and sensing.100, 141-143 The study of the ITIES has focused mainly on ion-transfer, electron-transfer and assisted ion-transfer reactions.144, 145
1.4.1 Galvani Potential Difference and Nernst Equation for ITIES
The thermodynamic equilibrium condition for partitioning of an ion i
between the aqueous (w) and organic (o) phase solutions is expressed by equating the electrochemical potential (𝜇̃𝑖𝛼, 𝛼 = w or o) of the ion in both phases127, 146
𝜇̃𝑖𝑜= 𝜇̃𝑖𝑤 (1.9)
where 𝜇̃𝑖𝛼 is given by Equation (1.10) as
𝜇̃𝑖𝛼 = 𝜇𝑖𝛼+ 𝑧𝑖𝐹𝜙 (1.10)
In the above Equation, 𝜙 is the inner (Galvani) potential of the phase α, and 𝜇𝑖𝛼 is the chemical potential of the ion i in that phase, 𝑧𝑖 is the charge number of the ion
39
and F is the Faraday constant. The 𝑧𝑖𝐹𝜙 term represents the electrostatic contribution to the electrochemical potential.146 From Equations (1.9) and (1.10), the Galvani potential difference between the two phases (∆𝑜𝑤𝜙 = 𝜙𝑤 − 𝜙𝑜) can be expressed as117, 127, 146 ∆𝑜𝑤𝜙 = 1 𝑧𝑖𝐹(𝜇𝑖 𝑜− 𝜇 𝑖𝑤) (1.11) Equation (1.11) can leads to Equation (1.12) by taking into account the concentration dependence of chemical potential of the ion146
∆𝑜𝑤𝜙 = 1 𝑧𝑖𝐹(𝜇𝑖 𝑜,°− 𝜇 𝑖𝑤,°) + 𝑅𝑇 𝑧𝑖𝐹ln 𝑎𝑖𝑜 𝑎𝑖𝑤 (1.12)
where 𝜇𝑖𝛼° is the standard chemical potential of the ion in phase α, T is the absolute temperature, R is the gas constant, and 𝑎𝑖 is the activity of i in phase α. At an activity ratio of unity, the standard Galvani potential difference (∆𝑜𝑤𝜙𝑖°, also known as the standard ion transfer potential) for i can be expressed as117
∆𝑜𝑤𝜙 𝑖 ° = 1 𝑧𝑖𝐹(𝜇𝑖𝑜,°− 𝜇𝑖𝑤,°) = 1 𝑧𝑖𝐹∆𝐺𝑖𝑤→𝑜,° (1.13)
where ∆𝐺𝑖𝑤→𝑜,° is the standard molar Gibbs energy of transfer of ion i from the aqueous phase to the organic phase and is given by the difference, 𝜇𝑖𝑜,°− 𝜇𝑖𝑤,°. Ions exhibiting large negative or positive values of ∆𝐺𝑖𝑤→𝑜,° are termed hydrophobic and hydrophilic ions, respectively.122 The standard ion transfer potential is an important parameter as it measures the relative affinity of a given ion for two immiscible phases in contact.146 From Equation (1.12 & 1.13), the Nernst equation for the ITIES can be written as125, 127, 144, 146
40 ∆𝑜𝑤𝜙 = ∆ 𝑜 𝑤𝜙 𝑖°+ 𝑅𝑇 𝑧𝑖𝐹ln 𝑎𝑖𝑜 𝑎𝑖𝑤 (1.14)
Although Equation (1.14) is similar in form to the Nernst equation for redox reactions at the solid electrode/solution interface, it should be noted that there is no redox process involved in the former case.125, 144 The similarity, however, suggests that the energetics at ITIES is described by the same laws as those in the redox process at solid electrodes.146 It is also clear from this equation that the composition of the liquid phases can be altered by applying a positive or negative Galvani potential difference from an external source which causes an ion to transfer from one phase to the other.
When more than one ion is involved in the partition equilibrium, which is typically the situation in practical ITIES systems, the equilibrium Galvani potential difference is given by117, 125 ∑ 𝑧𝑖𝑐𝑖 𝑉𝛼+ 𝑉𝛽(𝛾𝑖𝛼 𝛾𝑖𝛽) exp [ 𝑧𝑖𝐹 𝑅𝑇 (∆𝑜𝑤𝜙 − ∆𝑜𝑤𝜙𝑖°)] 𝑖 = 0 (1.15)
where 𝑉𝛼 and 𝑉𝛽 are the volume of the two immiscible phases (e.g., w and o), 𝑐𝑖 is the concentration of the ion across both phases, 𝛾𝑖𝛼 and 𝛾𝑖𝛽 are the activity coefficients in each phase. This equation is complicated and can only be solved analytically in some limiting cases. e.g. the case of a monovalent salt (A+ B) that dissociates completely in both phases.117, 122, 125 Two of these limiting cases are relevant to the work described in this thesis and are discussed in section 1.5.2.
41
1.4.2 Polarisable and Non-polarisable ITIES
Generally, the interfaces between two immiscible electrolyte solutions can be classified as polarisable or non-polarisable interfaces depending on whether the interface can be polarised externally using a potentiostatic control or not. When the two immiscible solutions in contact contain a common ion such as tetrabutylammonium (TBA+) with hydrophobic and hydrophilic counterions, the TBA+ will achieve partition equilibrium between the two solutions, such that the interface becomes polarised at a fixed potential called the distribution potential. This distribution potential is given by Equation (1.14), which is rewritten as Equation (1.16) provided the condition,
∆𝑜𝑤𝜙 TBA° +− ∆𝑜𝑤𝜙X°− ≫ 4(𝑎TBAY 0 𝑎TBAX0 )(1 + 𝑎TBAY0 𝑎TBAX0 )
applies, where X and Y are aqueous and organic counterions respectively.
∆𝑜𝑤𝜙 = ∆ 𝑜 𝑤𝜙 TBA° ++ 𝑅𝑇 𝐹 ln 𝑎TBA+𝑜 𝑎TBA+𝑤 (1.16)
Since this polarisation potential is fixed, the interface cannot be polarised by applying potential from an external source without changing the chemical compositions of the adjacent phases. Thus, the interface is said to be non-polarisable and this constitutes one limiting case of Equation (1.15).144 This type of interface is typically used as a reference liquid/liquid interface because it is reversible for one of the organic phase ions (e.g., bis(triphenylphosphoranylidene)ammonium ion, BTPPA+, used in this thesis).
On the other hand, a polarisable (or more accurately, ideally polarisable) interface is one in which a hydrophilic salt, such as LiCl, is dissolved in water and a
42
hydrophobic salt such as tetrabutylammonium tetraphenyl borate (TBATPB), is dissolved in organic phase so that the concentration of each salt in the other phase is negligible. Under these conditions, the Galvani potential of the interface will be undefined and thus the interface will be ideally polarisable, i.e., the interface can be polarised from an external potential provided ∆𝑜𝑤𝜙Li° +, ∆𝑜𝑤𝜙TPB° − ≫ 0 and ∆𝑜𝑤𝜙TBA° +,
∆𝑜𝑤𝜙Cl° − ≪ 0.117, 119, 125, 144 This represents the second limiting case of Equation (1.15) that is important in this thesis.
1.4.3 The potential Window
For the case of the ideally polarisable ITIES discussed above, there is a Galvani potential range over which negligible ion re-distribution occurs (i.e., within this range all ions remain essentially in their parent phases). This potential range is called the potential window and its limits are dictated by the lowest values of the standard Galvani potentials of the ions involved.117 Figure 1.7 illustrates the principles of the potential window for a liquid/liquid system in which the aqueous phase contains lithium chloride (LiCl, a hydrophilic salt) and the organic phase (DCE) contains bis(triphenylphosporanylidene)ammonium tetrakis(4-chlorophenyl) borate (BTPPATPBCl, a hydrophobic salt).
43
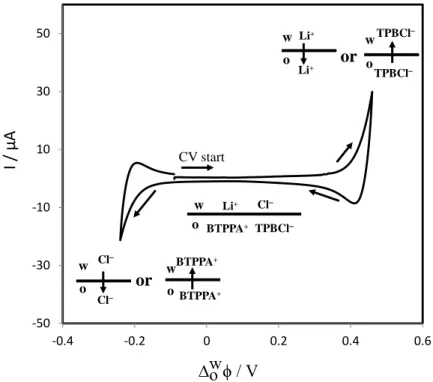
Figure 1. 7. Cyclic voltammogram of an ITIES system (10 mM LiCl(aq)/10 mM BTPPATPBCl(DCE)) illustrating the potential window for the supporting
electrolyte (the window is limited by the transfer of aqueous phase ions, Li+ and Cl). Scan rate: 50 mV s-1.
By ITIES convention, the polarity of the interface is assigned to the aqueous phase, so that positive polarisation implies that the aqueous phase becomes more positive and negative polarisation means the opposite.124, 125 If a positive or negative Galvani potential is applied from an external source, only a little current flows within the potential window due to charging of the interface. As the polarisation continues in either direction, ions limiting the potential window will begin to transfer from their original phase into the adjacent phase and a large increase in current is recorded. At high positive polarisation, either the positive ion in the aqueous phase, Li+ in this case, or the negative ion in the organic phase, TPBCl, transfers to the opposite phase. Similarly, at high negative polarisation either the negative ion in the aqueous phase (Cl in the present case) or the positive ion in the organic phase (BTPPA+) transfers into the opposite phase. Faradaic processes, e.g., ion transfer can
or -50 -30 -10 10 30 50 -0.4 -0.2 0 0.2 0.4 0.6 I / μ A or w o Li+ Li+ w o Cl Cl w oBTPPA+ w o TPBCl TPBCl CV start BTPPA+ w o Li+ BTPPA+ TPBCl Cl