FCND DP No. 110
FCND DISCUSSION PAPER NO. 110
Food Consumption and Nutrition Division International Food Policy Research Institute
2033 K Street, N.W. Washington, D.C. 20006 U.S.A.
(202) 862–5600 Fax: (202) 467–4439
June 2001
FCND Discussion Papers contain preliminary material and research results, and are circulated prior to a full peer review in order to stimulate discussion and critical comment. It is expected that most Discussion Papers will eventually be published in some other form, and that their content may also be revised.
EVALUATING TRANSFER PROGRAMS WITHIN A GENERAL
EQUILIBRIUM FRAMEWORK
ABSTRACT
We set out a general equilibrium model for the evaluation of a domestically financed transfer program, which helps to combine the results from a computable general equilibrium model with disaggregated household data. We separate the indirect welfare impact into three components: (1) the redistribution effect arising from the need to finance programs, (2) the reallocative effect arising from the transfer of resources between households with different “tax propensities,” and (3) the distortionary effect arising from the need to use distortionary finance instruments. We show how all these effects can be usefully subsumed within one parameter, namely, the cost of public funds. Using a Mexican cash transfer program as an illustration, we use the approach to show that the substantial welfare gains that result from the switch from universal food subsidies to targeted cash transfers reflect both the improved targeting efficiency of the latter as well as a relaxation of the trade-off between equity and efficiency objectives when designing tax systems. More generally, the indirect costs of finance can be substantially lowered when such programs are combined with appropriate tax reforms.
CONTENTS
Acknowledgments...iv
1. Introduction... 1
2. A Theoretical Model... 3
3. Application of the Model... 8
4. An Illustration for Mexico ... 16
Data and CGE Model... 16
Simulation and Results ... 20
5. Summary and Conclusions ... 26
Appendix Tables ... 29
References ... 32
TABLES 1 Description of VAT experiments ...21
2 Social cost of public funds...22
3 National sectors in model...30
4 Summary statistics ...31
FIGURES 1 Cost of public funds ...24
ACKNOWLEDGMENTS
The authors thank Sherman Robinson for numerous insightful discussions and suggestions, as well as participants at seminars at the International Food Policy Research Institute (IFPRI), the Inter-American Development Bank, the International Monetary Fund, the 2000 LACEA and NEUDC conferences, and the World Bank. We also thank Lourdes Hinayon for administrative assistance. All errors remain our own.
Dave Coady and Rebecca Lee Harris
1. INTRODUCTION
In response to budgetary pressures, many developing countries have recently moved (or are considering moving) to more targeted poverty alleviation programs.1 A central component of these programs involves a transfer to “poor” households either in the form of a cash transfer or an infra- marginal subsidized ration. When evaluating the economic impact of such transfers, it is useful to separate these into direct and indirect income (or welfare) effects. The direct income effects reflect the design of the program (i.e., the rules for targeting transfers); these are often referred to as first-round effects and are captured by partial equilibrium approaches to policy evaluation. The indirect effects capture the second-round income changes brought about by the impact of cash transfers and their financing on the level and composition of demand and supply. In this paper we focus primarily on the indirect income effects, more particularly those that are a
consequence of the need to finance the program domestically. We view this dimension of the program to be especially important since any credible poverty alleviation strategy must have a credible financing strategy underlying it. The latter, in tur n, can have important consequences for the level and distribution of household incomes and economic welfare.
1
For example, the Programa Nacional de Educacion, Salud, y Alimentacion (PROGRESA) program in Mexico, the Programma de Asignacion Familiar (PRAF) program in Honduras, and the Red de Proteccion Social (RED) program in Nicaragua. Similar programs are being seriously considered by other Latin American countries, including Columbia and Argentina.
The layout of the paper is as follows. In order to facilitate understanding of the sources of the indirect welfare effects, in the following section we set out a general equilibrium model that shows how one can separate these effects into three components. First, there is a redistribution effect due to the fact that someone must be taxed in order to pay for the cost of the transfer program. If high- income households bear the brunt of this taxation, and if we attribute a social value to a more equal distribution of income, then the resulting welfare cost will be less than the direct welfare gain from the transfers. Second, there is a reallocation effect that results from the fact that the pattern of demand will change if those who finance the program have income elasticities of demand different from those who receive the transfers. The resulting demand changes can have important consequences for government revenues when taxes vary substantially across
commodities. The welfare effects arise essentially because demand shifts away from (or towards) commodities for which demand was previously too low due to their inefficiently high tax rates. Third, there is a distortionary effect because of the need to raise the
revenue to finance the program through manipulating distortionary commodity taxes and subsidies. For example, if the program is financed by reducing distortionary subsidies, then this effect is positive, but if financed by increasing distortionary taxes, then it may be negative.
Based on this model, in Section 3, we show how the results from a computable general equilibrium model can be combined with disaggregated data from household surveys to evaluate the full impact of such programs on social welfare. We further show how the three components can be usefully subsumed within one parameter, namely, the
cost of public funds. In Section 4, we present an illustration of the approach, using data for Mexico to evaluate the recent redirection of their poverty alleviation strategy away from universal food subsidies towards targeted cash transfers.
2. A THEORETICAL MODEL
In this section we present a general equilibrium model of the economy that
identifies the sources of the welfare impacts of cash transfer programs. Consider a simple economy made up of households, firms, and the government. We assume that welfare of household h is captured by a standard indirect utility function, Vh(q,w,mh), where q is a vector of commodity prices, w is a vector of factor prices, and mh is household lump-sum income (including government transfers, rh, and lump-sum taxes, Th; i.e., mh = rh – Th).2 The budget constraint for each household is then given by q.xh = w.fh = mh, where x and f are the demand for final goods and the supply of factors, respectively. Firms are assumed to operate under constant returns to scale so that supply is demand determined and profits are zero.3 The government’s budget constraint is given by
R≡t.x + ττ.f - Σh rh + Σh Th ,
2
Throughout, we use bold type to denote vectors (small letters) and matrices (capital letters).
3
To bring out the main sources of welfare changes, the model presented is simpler than the CGE model used in our illustration of the methodology below. More complex market structures, however, can be easily incorporated by replacing producer prices with shadow prices and actual government revenue with shadow government revenue (see Drèze and Stern 1987). However, the analysis as presented here will still go through with only minor changes.
where t and ττ are vectors of taxes on commodities consumed and factors supplied by households, respectively, and t = q – p, with p being a vector of producer prices. Since producer prices are assumed fixed, we have dq = dt.
The objective of the “social planner” is to introduce policy reforms that increase social welfare as captured by a conventional Bergson-Samuelson social welfare function:
W(V1(q,w,m1), ……, Vh(q,w,mh), ……, VH(q,w,mH)) ,
defined over H households.4 In order to identify the various components of the total welfare impact of the program, it is useful to formally derive the welfare impact of cash transfers within the above framework. The problem the “social planner” then faces is to redistribute resources using the most efficient policy instruments from among a set that includes, for example, commodity taxes or subsidies, quantity rations, and cash transfers.
The constraints facing the planner are the market equilibrium constraints that demand must equal supply as well as the government budget constraint. For ease of exposition, factor supplies (i.e., f) can be subsumed within the vector x with negative values if the household is a net supplier of these factors. As shown in Drèze and Stern (1987), using Walras’ law, the planner’s problem may be rewritten as
4
This specification has important implications for the way in which we model the program below. In particular, the absence of public goods from the utility functions and the static nature of the specification means that to ensure consistency, we must keep both the supply of public goods and investment constant in our CGE model.
‹ (s;ω) ≡ W(…,Vh(s;ω),…) + λR , (1) where s is a vector of policy instruments that are completely controlled by the planner and are chosen optimally, ωω is a vector of policy instruments that are outside the
planner’s complete control and that include the policy instruments highlighted above, and
λ is the Lagrange multiplier on the government budget constraint (i.e., the marginal social—or shadow—value of government revenue). As before Vh(.) is the indirect utility function for h, and W(.) is a Bergson-Samuelson social welfare function. This
formulation of the problem has the attraction of presenting the problem in terms of the standard trade-off between consumer welfare and government revenue. The impact of any “policy reform” on W(.) captures the direct welfare impact of the reform while the impact on revenue captures the indirect welfare impacts.5
This policy reform under consideration is a cash transfer program, dr≡ {drh}. Differentiating equation (1) w.r.t. r, and noting the dm = dr, we get6
(
tX r)
r m d dr dr d W m h h h h h − ∑ − . . = ∂ ∂∑
β λ , (2)where βh≡ (∂W/∂mh) is the social valuation of extra income accruing to h and Xm is a
matrix with each household’s marginal budget shares across commodities as column
5
This implicitly assumes that the only distortions in the economy are government induced. Where other market imperfections exist, one needs to focus on “shadow revenue,” which captures income effects accruing outside the government b udget. See Drèze and Stern (1987) for a detailed discussion.
6
entries. The first term captures the direct welfare impact of the cash transfer program as depicted by typical evaluations of such programs. The term in brackets is the net revenue cost of the program calculated as the program budget adjusted for any changes in revenue due to higher demands by these households. λ is the social cost of the revenue used to finance the transfer and will depend on the set of instruments used to balance the budget.
The sources of the indirect welfare effects will depend on how the program is to be financed. If it is to be financed by lump-sum taxes, Th, then we have a similar equation as (2), replacing dr with dT. The net impact on welfare is then
(
)
[ t.X . m t.X . T] m m d dr dT dr m d dT m d W h h h h h h h h − + −∑ + +∑ − = ∂ ∂∑
β λ ,where dm = (dr – dT). If lump-sum taxes exactly cover the indirect transfers, i.e.,
ΣhdTh = Σhdmh, then we have
(
)
[t.X . r t.X . T] m m d dr dT m d m d d dW h h h h − + − =∑
β λ , (3)where the first term captures the pure redistribution impact and the second captures the reallocation impact. If the reallocation effect is zero (e.g., if marginal budget shares are
the same across households or if taxes are zero), then we are left with only a redistribution effect.7
Now, consider the program being financed by a change in indirect taxes, dt. Using the standard properties of the indirect utility function, the welfare impact of a tax change is then t t x t x t x t d d W ∂ ∂ + + − = ∂ ∂ . . . λ β . (4)
The first term indicates that households gain from the reform according to the level of their existing consumption, i.e., the existing level of demand gives a measure of this welfare effect in money terms. The direct impact on social welfare is greater the more that higher income households consume the commodities with the highest tax increases. Again, the social cost of raising revenue using a commodity tax is lower if households respond to the price change by switching demand away from (towards) relatively highly subsidized (taxed) commodities. Fully differentiating the budget
constraint, setting x.dt = Σhdrh, and using the Slutsky decomposition, we get a net change
in welfare due to the transfer program financed by commodity taxation as
7
In general, because of the presence of indirect revenue effects, we cannot solve out analytically for the vector dT, which keeps revenue constant. To do so, we would have to assume that marginal budget shares are constant across households.
(
)
(
)
t q x t t x r X t x t t c m h d d d dt dr d W h h h . . . . ∂ ∂ + − + − = ∂ ∂∑
β λ λ , (5)where xc is the compensated demand function. Again, the first term is the redistribution effect, the second is the reallocation effect, and the third is the distortion effect of using distortionary taxes to finance the transfers.8
The above analysis identifies the source of the welfare impacts from a poverty alleviation cash transfer program financed domestically, identifying separately the equity (i.e., distribution) and efficiency (i.e., reallocation and distortion) impacts. It also
provides a useful framework for interpreting the results from our analysis presented later in the text, especially in understanding the origin of the indirect welfare effects.
3. APPLICATION OF THE MODEL
To trace through the indirect effects of a transfer program, we need to specify the structure of the economy so as to identify how the changes in supply and demand that result from the transfers work themselves through the various commodity and factor markets. This includes specifying not only how equilibrium is restored in these markets but also specifying how equilibrium is restored to government finances as a result of both
8
When indirect taxes are set optimally, we further know that t.(∂xci / ∂q/xi = bi/λ, where bi is a weighted
average of household bh = βh - λh + λt.(∂xh/∂mh), with the share of each household in the total consumption of commodity i as weights. See Coady and Drèze (2000) for a more detailed discussion.
the direct and indirect impacts on government revenues and expenditures. These issues are addressed in this section.
With regard to commodities one can consider a number of alternative market structures, with markets characterized either by
1. Fixed prices with markets clearing through quantity adjustment. This could be the case, for example, where excess capacity exists in the economy so that the extra demand generated by the transfers absorbs some of these “surplus” resources, thus generating Keynesian-type income multiplier effects (i.e., demand- led growth). Other indirect welfare effects may exist in the presence of domestic commodity and factor taxes. Alternatively, the extra demand may be satisfied through international trade flows (i.e., changes in the levels of imports and exports), with the indirect welfare effects being due to the presence of trade taxes.
2. Flexible prices with markets clearing through price adjustment. When the
economy is characterized by full capacity, extra demands will, in general, result in price increases that bring about an appropriate reallocation of resources between sectors and consequent supply and demand changes. For given demand changes resulting from transfers, the more mobile are factors in and out of a sector, then the smaller the price change required to bring forth the necessary supply
responses. Aga in, the indirect effects here operate through changing government revenue in the presence of commodity and factor taxes.
In general, models with excess capacity generate relatively high (and positive) indirect effects: the more supply and demand are redirected towards commodities that utilize “surplus” resources in their production, the higher the magnitude of the positive welfare effects. In the absence of excess capacity, the general equilibrium welfare impacts will also depend on (1) the existing structure of taxes and subsidies (including price controls) on commodities and factors, and (2) how the transfers are financed (i.e., which combination of taxes or subsidies are changed).
In order to identify the general equilibrium effects identified above, one can use a computable general equilibrium (CGE) model of the economy9 and use the following two-step approach. First, the transfers are fed into the CGE model and we consider alternative market structures and budget-closure rules. Then the resulting direct and indirect income effects, as well as the price changes, are taken from the CGE model and, together with disaggregated household data, are used to calculate the impact on social welfare.10 Using the model from the previous section, the social welfare effects of income and price changes are calculated as
dw w V V W dq q V V W dm m V V W dW h h h h h h h h h h b ∂ ∂ ∂ ∂ ∑ + ∂ ∂ ∂ ∂ ∑ + ∂ ∂ ∂ ∂ ∑ = , 9
An alternative would be to use shadow prices in the place of such a fully articulated model of the economy. On this approach, see Little and Mirrlees (1974); Ahmad, Coady, and Stern (1988); Newbery and Stern (1987); and Coady (1997).
10
where the first term captures the direct welfare effect from income transfers and the final two terms capture the indirect welfare effects coming through the resulting general equilibrium changes in commodity and factor prices. Defining βh≡ (∂W/∂mh) and using Roy’s identity, this can be rewritten as
i h i h i h h h h h h h dm de x dq dW =∑ β +∑ β −∑ ∑ β , (6)
where βh is the so-called social marginal utility of income to household h (or “welfare weight”), deh is the change in factor incomes, xih is the quantity of commodity i
consumed by household h, and dqi, the corresponding price change. Multiplying and
dividing both terms by total income yh and the second term by qi, this can be rewritten as
dW = ∑hβhyh [ ϕh + γh - ∑iθih ρi ] ,
where ϕh and γh are the proportionate changes in household income due to the direct transfers and indirect income effects, respectively, ρi, the proportionate change in the
price of commodity i, θih is the share of expenditure on commodity i in the total
expenditure of the household, and we use the household budget constraint. The term in brackets can be interpreted as the proportionate change in real incomes (i.e., nominal incomes minus a cost-of- living index). These proportio nate changes are outputs from the CGE model and are then applied to household-level data.
In order to apply the above approach, one needs to specify the term βh. This can be calculated as
βh
= (yk/yh)ε ,
where yk is the income of a reference household (for which βk = 1) and ε can be
interpreted as an “inequality aversion” parameter with concern for inequality increasing with ε. For example, with ε = 0, all welfare weights take the value unity so that extra income to all households is considered equally socially valuable. With ε = 1, the social value of extra income to a household with twice the initial income of k is considered only as half as socially valuable as extra income to k. This welfare weight decreases to a quarter when ε = 2 and so on.11
We now present a very simple model that suggests a very useful way of
presenting the results of such an analysis.12 Using equation (7) and subsuming both the indirect welfare effects (i.e., coming through both factor and commodity price changes) into one variable, dz, the welfare impact of the program can also be written as
dW = ∑hβhdmh - λ*∑hdmh , (7)
11
See Myles (1995, pp. 114-115) for more discussion.
12
where h h h h h h dm dz β β ηλ λ ∑ ∑ = ≡ *
is the adjusted cost of public funds, i.e., the social welfare cost of raising one unit of government revenue (λ) multiplied by a tax propensity (η) that adjusts for the fact that households spend the extra income from transfers on taxed (or subsidized) commodities, thus decreasing (increasing) the amount that needs to be raised to balance the budget. As above, dmh is the direct cash transfer to household h, ∑hdmh is the program budget, and βh
is the social valuation of this transfer. The first term on the right- hand-side of equation (7) is then the direct welfare impact and the second is the indirect welfare impact of the program. The magnitude of the indirect effect is determined by the magnitude of λ*. If the government is unconcerned about income distribution (e.g., either because incomes are already equalized or ε = 0, then βh = 1(= β) for all households. If, in addition, the transfers (and other government revenue needs) are financed by nondistortionary lump-sum taxes, then we have λ = 1(= β). The program then results in no overall change in welfare.
However, if, instead, the transfers have to be financed by introducing distortionary taxes, then we have β = 1 and λ*>1, so that the net welfare impact is negative due to an indirect distortionary effect capturing the so-called “deadweight
losses” associated with taxes. If distortionary taxes already existed, then the sign of λ will depend on whether these were optimally set or not and which taxes (subsidies) are
increased (decreased) to finance the program. If, initially, taxes were set optimally, then
λ*
>1 and welfare decreases.13 If, instead, the program is financed by the removal of distortionary subsidies, then λ*<1, and welfare increases. If, initially, taxes were not set optimally, then λ*>1 (λ*<1) if the program is financed by raising taxes that were initially too high (low). In the presence of an inefficient tax structure, one also gets reallocation effects if income elasticities differ across those received and financing the budget. For example, if the poor (who receive transfers) have a relatively high propensity to consume highly taxed commodities from extra income, then this will decrease λ*, since the net revenue costs of financing the program will be lower (i.e., η < 1).
Even if the two efficiency effects are zero (e.g., due to the availability of lump-sum transfers), λ* can still differ from unity if income distribution is suboptimal. If, in such a situation, the incidence of taxation falls on relatively low- income (high- income) households, then λ* > 1 (λ* < 1), reflecting a higher (lower) social cost of raising revenue. The belief that λ* < 1 is obviously the central motivation for such transfer programs in the first place.
We are interested in determining the overall welfare impact of the actual transfer program, but also in comparing across alternatives. For example, in our illustration
13
Optimal taxation requies that, for all taxes under the control of the policymaker, the deadweight loss from raising extra revenue (i.e., λ) is equalized across all tax instruments
below, the actual program is the transfer program financed by a reduction in food subsidies and the alternatives reflect alternative financing scenarios, namely, alternative reforms of the value-added tax (VAT) system. In order to motivate the manner in which we present our results, it is useful to rearrange equation (7). Since the direct welfare impact is common across all (i.e., the actual and alternative) programs, one can equivalently compare the welfare impacts by comparing the benefit-cost ratios of programs defined as * * * j D j h h h h h j h h h j dm dm λ λ λ α β λ β θ = ∑ = ∑ ∑ ≡ ,
where λ*j is the social cost of raising the revenue to finance the program (i.e., one for
each of the actual and alternative financing strategies, j), αh is the transfer received by household h as a proportion of the transfer budget, and λD is a weighted average of
household βs, since ∑hα = 1. One can also interpret λD as the welfare impact of the direct
transfers and λ*j as the welfare cost of the indirect income effects.14 In principle, one
should choose the program with the highest θj > 1; i.e., conditional on benefits exceeding
costs, one chooses the program that exhibits the lowest social cost of delivering these
14
The term λD is analygous to what is commonly referred to as the distributional characteristic of policy
instruments or programs (Feldstein 1972). It is straightforward to show that λT = αλD + (1 - α)λI, where λT
is the distributional characteristic of the full program, λI is that of the indirect program component, and α is
the share of the direct income transfers in the total (i.e., direct plus indirect) income effect of the program. One can also easily show that λI = λ*λD(α/1 - α).
benefits. Or, in other words, θj is the social return to every dollar raised to finance the
program. Below, we present results for λD, λ*j, and θj across alternative financing
scenarios and different degrees of aversion to inequality (i.e., values of ε).
4. AN ILLUSTRATION FOR MEXICO
In this section, we provide an illustration of the above approach by way of an evaluation of the recent shift in policy emphasis in Mexico’s poverty alleviation strategy away from universal food subsidies towards targeted cash transfers. We start by
providing a very brief description of the data underlying the computable general
equilibrium (CGE) model and the key features of this model. We then present the results from alternative policy simulations of a cash transfer program financed domestically.
DATA AND CGE MODEL
The CGE model used in this analysis relies on a social accounting matrix (SAM) of Mexico for 1996.15 The data were first collected as a national SAM, which was then divided into five regions. The model is able to capture differences among the regions in terms of production and consumption patterns, in a “top-down” approach: rather than having complete regional SAMs, the model regionally disaggregates the national SAM only by production and factor markets and households.
15
The model includes four rural regions, North, Central, Southwest, and Southeast, which produce only primary agricultural products. There is one “national” urban region, which comprises all of the urban areas of Mexico, regardless of geographical location. Each region has 3 households, defined as poor, medium, or rich, according to the income tercile into which they fall. The urban area produces processed agricultural goods and other goods and services. Generally, the North region produces more high- valued agriculture, in particular fruits and vegetables, much of which is exported. Agriculture production relies on more irrigated land use, and households are wealthier. The Southeast region is poorest, more of the land used is non- irrigated, and there is less commercial farming. The Central and Southwest regions are a mixture of the first two, with a range of subsistence and commercial farming and agricultural technology. These two areas also produce the largest amounts of basic grains and beans. Appendix Table 3 lists the sectors used in the model.
There are four types of nonagricultural labor: professional, white-collar, blue-collar, and unskilled/informal, and four agricultural labor categories differentiated by region. The agricultural activities employ only agricultural labor and nonagricultural activities do not use any agricultural labor. Each rural region uses two types of land, irrigated and non- irrigated, for a total of eight land types. There is one capital category, used by all sectors.
The government and the enterprise account already alluded to are the other domestic institutions in the SAM. The government, which is national, collects seven types of taxes: a value-added tax, a producer tax, an export tax, a sales tax, an import
tariff, a payroll tax, and an income tax. It receives transfers from the rest of the world and provides transfers to households and enterprises. The rest of the world account provides transfers to households, buys Mexico’s exports, and sells its imports. In Appendix Table 4, we present some useful summary statistics of the data used in the analysis.
The CGE model used in this study follows the sectoral and socioeconomic structure of the SAM described above.16 The CGE model is neo-classical in spirit with agents responding to price changes, reflecting our central focus on the general
equilibrium effects arising from the need to finance the program domestically (i.e., there are no surplus resources in the economy or distortions other than taxes). The model is Walrasian, determining only relative prices. Product prices, factor prices, and the
equilibrium exchange rate are defined relative to the consumer price index, which serves as the price numeraire. The country is “small” in the sense that it takes world prices as given.
The production technology is a nested function of constant elasticity of substitution (for factors within value-added) and Leontief functions (for intermediate inputs and value-added). Producers decide to supply their output to either the export or domestic market according to a constant elasticity of transformation function, which permits some degree of independence from international prices. The composite
consumption good is also a constant elasticity of substitution function of imported and domestically produced commodities. This aggregation, known as the Armington function,
16
permits imperfect substitutability between imported and domestically produced goods and, therefore, two-way trade.
Households receive income from factor payments (land, labor, and capital payments) net of factor taxes, government transfers, and transfers from the rest of the world. They consume goods according to a linear expenditure function, purchasing goods from the market as well as from home production (in rural areas only). They also pay taxes on their monetary income and save a share of their total income. Government income is the sum of all taxes: direct taxes on households and enterprises, value-added taxes, producer taxes, import tariffs, export taxes, social security taxes, and sales taxes.
The macroeconomic accounts are balanced as follows. The choice of government budget closure will depend on the simulation being performed; in all cases, government (dis)savings will be held fixed, as will real government spending. One of the tax
instruments will be free to adjust to keep government savings at its base-line level. This will allow us to perform government budget-neutral experiments without having
government purchases of goods and services affect the welfare analysis. Similarly, in the savings- investment balance, real investment will be held fixed, and the marginal
propensity to save equilibrates the account. The current account is balanced by the exchange rate, so that any welfare effects are not based on changes in foreign flows. In the factor markets, labor and land are mobile across sectors and capital is fixed, giving the model a medium- term time frame.
SIMULATION AND RESULTS
In this section, we very briefly describe our policy simulations and then evaluate their impacts on welfare. As mentioned earlier, this involves taking the indirect welfare impacts from the CGE analysis and superimposing them on the household- level data. The program is modeled as a poverty alleviation program that transfers income to “poor” households in rural areas, equivalent to a 30 percent increase in their nominal incomes and 2 percent of aggregate consumption. The total welfare impact of such a program will depend on how it is financed and we consider a number of alternatives. The actual source of finance is the elimination of food subsidies. In the base run of the model, subsidies on Manufactured Maize, Manufactured Wheat, and Dairy Manufacturing imply a consumer subsidy on these goods of 25 percent, 20 percent, and 20 percent, respectively. The other alternatives considered involve various reforms of the value-added tax (VAT) system. The present VAT system is modeled as having three rates: 0 percent, 5 percent, and 10 percent on agriculture/processed foods, light manufacturing/ intermediate goods, and consumer durables/capital goods, respectively (Table 1).
We consider the following VAT reforms as alternative ways to finance the program:
1. Proportional Increase (PVAT): in all VAT rates to 0 percent, 7.5 percent, and 15 percent, respectively.
3. Uniform Top Rate (TVAT): with the top two rates made uniform at 11 percent.
4. Uniform Bottom Rate (BVAT): with the bottom two rates made uniform at 7 percent.
5. Uniform Single Rate (SVAT): with an 8.3 percent rate on all goods.
Table 1. Description of value -added tax (VAT) experiments
Low ratea Middle rateb High ratec
VAT experiment Description (percent) (percent) (percent)
Base -- 0.0 5.0 10.0
PVAT Proportional increase in Base VAT rates 0.0 7.3 14.6
HVAT Increase in high rate only 0.0 5.0 16.1
TVAT Uniform top rate 0.0 11.4 11.4
BVAT Uniform bottom rate 7.2 7.2 10.0
SVAT Single rate 8.3 8.3 8.3
a
Low rate is applied to all raw agricultural, processed agricultural, and other food activities.
b
Middle rate is applied to Light Manufacturing, Intermediate Goods, and Professional Services activities.
c
High rate is applied to Capital Goods, Consumer Durables, Construction, and Commerce, Trade and Transportation activities.
The basic approach is to compare the social costs of raising the necessary revenue to finance the program (the “cost of public funds,” λ*j) with those of the actual financing
instrument, i.e., the elimination of food subsidies, as well as with the program benefit (i.e., λD).
The results of our simulations are presented in Table 2.17 We start by comparing the cost of public funds across alternative financing packages for ε = 0, i.e., where we are concerned only with the efficiency aspects of the program and not with its impact on the
17
distribution of income or poverty. It is clear that, from an efficiency perspective, financing the program by reducing subsidies dominates with the cost of raising $100 being only $62. In other words, every $100 raised to finance the program increases welfare (and GDP) by $38. These substantial welfare gains result from the elimination of a highly distortionary subsidy. This compares extremely favorably with the alternative forms of VAT financing.
Table 2. Social cost of public funds
Cost of raising a unit of revenue (λλj)a
Inequality aversionb Benefit (λλD) Food subsidies PVAT (0,7.5, 15) HVAT (0,5,16) TVAT (0,11) BVAT (7,10) SVAT (8.3) ε = 0 1 0.625 1.061 1.071 1.051 0.969 0.955 ε = 0.5 1.242 0.468 0.732 0.751 0.718 0.668 0.685 ε = 1 1.584 0.397 0.611 0.633 0.602 0.560 0.599 ε = 2 2.792 0.395 0.658 0.679 0.664 0.612 0.690 ε = 3 5.448 0.557 1.023 1.045 1.054 0.970 1.109 ε = 4 11.549 0.996 1.962 1.988 2.042 1.882 2.155 ε = 5 26.011 2.060 4.227 4.263 4.425 4.082 4.671
Two of the VAT alternatives, i.e., SVAT and BVAT, also result in welfare gains, with the cost of raising $100 being $95 if financed by a move to a single uniform VAT rate or $97 if financed by a move towards a uniform VAT rate in the place of the bottom two rates. These efficiency gains arise from the reform in the VAT structure. In general, the inefficiency associated with a tax system is minimized by having relatively higher
rates on commodities with relatively low own-price elasticities of demand.18 Since basic food items tend to have low price elasticities, shifting taxes towards these commodities will tend to increase welfare and this is what happens in both the case of SVAT and BVAT. Our results tell us that the gains resulting from thus reforming the VAT structure outweigh the welfare losses from the higher average rate required to finance the program.
The other VAT alternatives considered all have a cost of public funds greater than unity, ranging between $105-$107 per $100 of revenue raised. All of these involve an increase in the VAT rates of one or both of the top two VAT rates and the commodities falling within these rates tend to be the most price elastic. These welfare losses mean that, in the absence of any social value being attached to any improvement in the income distribution, such a program would be welfare decreasing. However, not only are distributional concerns the motivating force for the program in the first place, but they also tend to be the motivation behind tax structures that exhibit high tax rates on low price-elastic luxuries typically consumed disproportionately by higher- income
households. Therefore, any evaluation of the program should explicitly address this issue. Introducing distributional concerns involves analyzing the results for values of
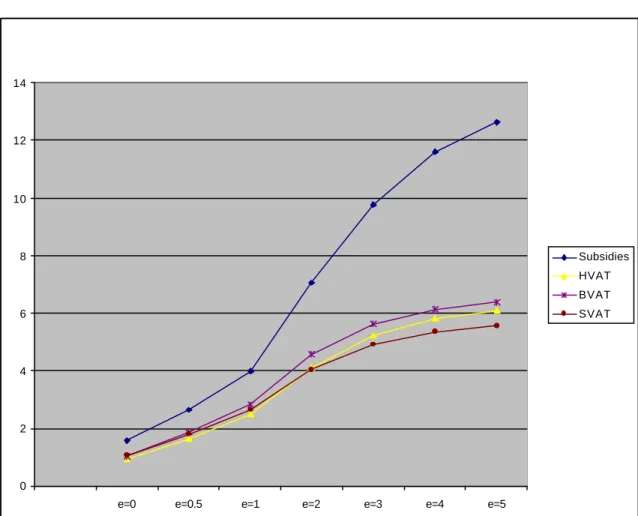
ε > 0. The cost of public funds for a number of financing instruments is presented in Figure 1: in order to avoid clutter, we focus on only three of the VAT alternatives, i.e., the most inefficient system (HVAT) and the two most efficient systems (BVAT and
18
We are implicitly assuming that cross-price elasticities are zero or sufficiently small as to make this general rule of thumb valid. See, for example, Coady and Drèze (2000) and Myles (1995) for more detailed discussion.
SVAT), along with subsidy financing. The first thing to notice is that once we introduce even a little concern for income distribution (e.g., ε = 0.5), the cost of raising a peso becomes substantially less than one peso for all financing instruments. This reflects the fact that the indirect income effects are distributed in favor of the poor at the expense of the nonpoor. The second thing to notice is that the relationship between the cost of public
Figure 1. Cost of public funds
0 1 2 3 4 5
e=0 e=0.5 e=1 e=2 e=3 e=4 e=5
Subsidies HVAT BVAT SVAT
funds and ε is U-shaped, with the former beginning to rise after ε = 1. Eventually, at around ε = 3, the cost of public funds goes above unity. This pattern indicates that although the tax incidence is lowest for the poor as a whole, it is relatively high for the poorest of the poor, and the greater the weight we place on the income of the poorest, the higher the social cost of raising revenue through the alternative VAT instruments.
Although the cost of financing the program through reducing subsidies follows the same U-shaped pattern, it remains the most attractive form of finance throughout. In fact, for higher values of ε, it also appears to be the least regressive form of financing. This is brought out clearly in Figure 2, which shows the benefit-cost ratios (BCRs) across the instruments discussed above. The higher the value of ε, the more attractive subsidy reductions look relative to VAT financing. For example, at only moderate levels of aversion to income inequality, the BCR with subsidy financing is about four, i.e., every $100 raised to finance the program increases welfare by $400, a very high social return by any standard. But even the BCRs for VAT financing increase monotonically with ε, reflecting the targeting of the transfers at poor households. This brings out one of the main attractions of the program, i.e., the fact that it is very efficiently targeted. More generally, it indicates the potential return in welfare terms from introducing a more efficiently targeted transfer program. The presence of such a program enables one to design a more efficient tax system by lessening the need to trade off efficiency goals against equity objectives, e.g., by reducing the need for high subsidies on necessities or high taxes on price-elastic luxuries that exist for equity reasons. More generally, it is also
clear that the indirect cost of the transfer program can be substantially reduced if the program can be combined with reform of an initially inefficient tax system.
Figure 2. Benefit-cost ratios
5. SUMMARY AND CONCLUSIONS
Most analyzes of the welfare impact of cash transfers have essentially been undertaken within a partial equilibrium framework that focuses exclusively on the direct effect of the transfers on the beneficiaries. In this paper, we emphasize the need to take a
0 2 4 6 8 10 12 14
e=0 e=0.5 e=1 e=2 e=3 e=4 e=5
Subsidies HVAT BVAT SVAT
general equilibrium perspective of the program. In particular, we focus in on the indirect welfare effects that arise from the need to finance the program domestically. This focus is motivated by the belief that any credible poverty alleviation strategy must have a credible financing strategy underlying it.
We first show how the indirect effects arising from the need for domestic financing can be separated into three components: (1) the redistribution effect due to some households being taxed to finance the transfers to households, (2) the reallocation effect, which results when those financing the program have different consumption patterns (or income elasticities) from those receiving the transfers, so that there is a second-round effect on government revenue when taxes differ across commodities, and (3) the distortionary effect, which arises when the program is financed by manipulating distortionary taxes and subsidies. The first effect can be viewed as capturing the equity implications of the program and the last two effects as capturing the efficiency
implications.
Based on the above model, we show how the results from a CGE analysis of domestically financed cash transfers can be super- imposed on disaggregated household data to evaluate the total welfare impact of the program. We show how the three separate components of the indirect income effects can be subsumed within one parameter, the (adjusted) cost of public funds. This term represents the welfare cost of financing the program and should be compared to the welfare benefit from the transfers as captured by the commonly used distributional characteristic. We construct a benefit-cost ratio defined as the distributional characteristic of the direct transfers divided by the (adjusted) cost of
public funds. Our illustration, based on Mexico’s recent reform of its poverty alleviation strategy, clearly shows that the move from universal food subsidies to targeted transfers has two sources of benefit: (1) the introduction of a more distributionally powerful transfer policy instrument, and (2) the fact that this reduces the need to trade off equity objectives against efficiency objectives when designing the tax system. More generally, the welfare cost of funding such programs can be substantially lowered when they are accompanied by reforms of the tax system.
Table 3. National sectors in model
1. Maize 2. Wheat 3. Beans
4. Other Grains (Sorghum, Barley) 5. Fruits and Vegetables
6. Other crops (Tobacco, Hemp, Cotton, Cocoa, Sugar, Coffee, Soy, Safflower, Sesame, and Others) 7. Livestock/Forestry/Fisheries (Bovines, Goats, Sheep, Bees, Poultry and Others, Forestry and Fisheries) 8. Diary
9. Prepared Fruits and Vegetables 10. Wheat Manufacturing 11. Corn Manufacturing 12. Sugar Manufacturing
13. Other Processed Foods (Coffee Manufacturing, Processed Meats, Oils and Fats, Feeds, Alcohol, Beverages, and Others
14. Light Manufacturing (Lumber, Wood, Paper, Print, and Cigar Manufacturing, Soft Fiber Textiles, Hard Fiber Textiles, Other Textiles, Leather, Apparel)
15. Intermediates (Chemicals, Synthetics, Rubber, Glass, Cement, Fertilizers, Other Chemicals, Oil Refining, Oil and Gasoline, Petrochemicals, Coal, Iron, Non-Ferrous Metal, Sand/Gravel, Minerals)
16. Consumer Items (Pharmaceuticals, Soaps, Plastic, Metal Furnishings, Household Appliances, Electronic Equipment, Automobiles and Parts)
17. Capital Goods (Metal Products, Metal Manufacturing, Non-Electronic Machines, Electronic Machines, Other Electric Goods, Transportation Materials, Mineral Manufacturing, Iron Manufacturing, Non-Ferrous Metal Manufacturing, Others)
18. Professional Services (Professional Services, Education, Medical, Finance/Real Estate, Public Administration and Defense, Electricity, Gas, and Water)
19. Other Services (Other Services, Restaurants) 20. Construction
Table 4. Summary statistics
Sectoral composition (%)
Producer
taxa VAT Sales tax Tariff
Export
tax Output
Domestic
supply Imports Exports
Exports/ output Imports/ domestic supply Maize 0.000 -- 0.006 0.012 0.007 0.62 0.83 1.17 0.03 0.85 24.19 Wheat -0.571 -- 0.000 0.007 0.032 0.12 0.12 0.00 0.01 1.44 0.07 Beans -0.003 -- 0.008 0.009 0.006 0.11 0.10 0.14 0.17 29.03 24.37 Other grain -0.449 -- 0.000 0.000 0.008 0.16 0.16 0.00 0.15
Fruits and vegetables -0.001 -- 0.006 0.000 0.018 0.75 0.64 0.32 0.95 23.43 8.55
Other crops -0.002 -- 0.007 0.016 0.006 0.84 0.77 1.55 1.89 41.72 34.75
Livestock 0.001 -- 0.008 0.014 0.033 2.20 2.21 0.39 0.42 3.53 3.00
Dairy -0.308 -- 0.008 0.005 0.007 1.81 1.89 0.56 0.12 1.18 5.04
Maize manufacturing -0.308 -- 0.008 0.018 0.007 1.47 1.47 0.02 0.10 1.28 0.28
Wheat manufacturing -0.308 -- 0.008 0.030 0.006 1.13 1.03 0.17 0.70 11.54 2.75
Prepared fruits and vegetables 0.002 -- 0.006 0.017 0.009 0.30 0.20 0.18 0.69 43.62 15.60
Sugar 0.002 -- 0.005 0.034 0.023 0.40 0.41 0.35 0.30 14.09 14.94 Other food 0.002 -- 0.008 0.016 0.007 4.29 4.46 3.38 2.50 10.81 13.01 Light manufacturing 0.002 0.05 0.007 0.027 0.009 5.50 5.73 11.78 10.27 34.71 35.29 Intermediates 0.002 0.05 0.006 0.016 0.019 5.43 5.57 12.50 11.44 39.14 38.54 Capital goods 0.002 0.10 0.007 0.021 0.012 7.36 9.89 46.26 30.68 77.52 80.23 Construction items 0.002 0.10 0.007 0.023 0.006 11.96 8.41 21.24 39.74 61.78 43.33 Construction 0.003 0.10 0.006 -- -- 5.24 5.28 -- -- -- -- Professional services 0.007 0.05 0.008 -- -- 19.96 20.15 -- -- -- -- Other services 0.004 -- 0.009 -- -- 11.15 11.27 -- -- -- -- Commerce 0.003 0.10 0.009 -- -- 19.22 19.43 -- -- -- -- a
REFERENCES
Ahmad, E., D. Coady, and N. Stern. 1988. A complete set of shadow prices for Pakistan: Illustrations for 1975-76. Pakistan Development Review 27 (1): 7-43.
Coady, D. 1997. Agricultural pricing policies in developing countries: An application to Pakistan. International Tax and Public Finance 4: 39-57.
Coady, D., and J. Drèze. 2000. Commodity taxation and social welfare: The generalized Ramsey Rule. Discussion Paper, STICERD. London: London School of
Economics.
Coady, D., and R. Harris. 2000. A general equilibrium analysis of the welfare impacts of PROGRESA transfers. IFPRI Final Report. Food Consumption and Nutrition Division, International Food Policy Research Institute, Washington, D.C.
Drèze, J., and N. Stern. 1987. The theory of cost-benefit analysis. In Handbook of public economics, ed. A. Auerbach and M. Feldstein. Amsterdam: North-Holland. Feldstein, M. 1972. Distributional equity and the optimal structure of public prices.
American Economic Review 62: 32-36.
Harris, R. 2000. Estimation of a regionalized Mexican social accounting matrix: Using entropy techniques to reconcile disparate data sources. Proceedings from the Seminario Internacional Insume-Producto: Regional y Otras Aplicaciones (International Input-Output Seminar: Regional and Other Applications) in Guadalajara, Mexico, September 2-4, 1999 (Forthcoming in Fall 2000).
Little, I., and J. Mirrlees. 1974. Project appraisal and planning for developing countries. London: Heinemann.
Myles, G. 1995. Public economics. Cambridge: Cambridge University Press.
Newbery, D., and N. Stern, eds. 1987. The theory of taxation for developing countries. Oxford: Clarendon Press.
02 Determinants of Credit Rationing: A Study of Informal Lenders and Formal Credit Groups in Madagascar, Manfred Zeller, October 1994
03 The Extended Family and Intrahousehold Allocation: Inheritance and Investments in Children in the Rural Philippines, Agnes R. Quisumbing, March 1995
04 Market Development and Food Demand in Rural China, Jikun Huang and Scott Rozelle, June 1995 05 Gender Differences in Agricultural Productivity: A Survey of Empirical Evidence, Agnes R.
Quisumbing, July 1995
06 Gender Differentials in Farm Productivity: Implications for Household Efficiency and Agricultural Policy, Harold Alderman, John Hoddinott, Lawrence Haddad, and Christopher Udry, August 1995 07 A Food Demand System Based on Demand for Characteristics: If There Is "Curvature" in the Slutsky
Matrix, What Do the Curves Look Like and Why?, Howarth E. Bouis, December 1995
08 Measuring Food Insecurity: The Frequency and Severity of "Coping Strategies," Daniel G. Maxwell, December 1995
09 Gender and Poverty: New Evidence from 10 Developing Countries, Agnes R. Quisumbing, Lawrence Haddad, and Christine Peña, December 1995
10 Women's Economic Advancement Through Agricultural Change: A Review of Donor Experience, Christine Peña, Patrick Webb, and Lawrence Haddad, February 1996
11 Rural Financial Policies for Food Security of the Poor: Methodologies for a Multicountry Research Project, Manfred Zeller, Akhter Ahmed, Suresh Babu, Sumiter Broca, Aliou Diagne, and Manohar Sharma, April 1996
12 Child Development: Vulnerability and Resilience, Patrice L. Engle, Sarah Castle, and Purnima Menon, April 1996
13 Determinants of Repayment Performance in Credit Groups: The Role of Program Design, Intra-Group Risk Pooling, and Social Cohesion in Madagascar, Manfred Zeller, May 1996
14 Demand for High-Value Secondary Crops in Developing Countries: The Case of Potatoes in Bangladesh and Pakistan, Howarth E. Bouis and Gregory Scott, May 1996
15 Repayment Performance in Group-Based credit Programs in Bangladesh: An Empirical Analysis, Manohar Sharma and Manfred Zeller, July 1996
16 How Can Safety Nets Do More with Less? General Issues with Some Evidence from Southern Africa, Lawrence Haddad and Manfred Zeller, July 1996
17 Remittances, Income Distribution, and Rural Asset Accumulation, Richard H. Adams, Jr., August 1996 18 Care and Nutrition: Concepts and Measurement, Patrice L. Engle, Purnima Menon, and Lawrence
Haddad, August 1996
19 Food Security and Nutrition Implications of Intrahousehold Bias: A Review of Literature, Lawrence Haddad, Christine Peña, Chizuru Nishida, Agnes Quisumbing, and Alison Slack, September 1996
21 Livestock Income, Male/Female Animals, and Inequality in Rural Pakistan, Richard H. Adams, Jr., November 1996
22 Alternative Approaches to Locating the Food Insecure: Qualitative and Quantitative Evidence from South India, Kimberly Chung, Lawrence Haddad, Jayashree Ramakrishna, and Frank Riely, January 1997
23 Better Rich, or Better There? Grandparent Wealth, Coresidence, and Intrahousehold Allocation, Agnes R. Quisumbing, January 1997
24 Child Care Practices Associated with Positive and Negative Nutritional Outcomes for Children in Bangladesh: A Descriptive Analysis, Shubh K. Kumar Range, Ruchira Naved, and Saroj Bhattarai, February 1997
25 Water, Health, and Income: A Review, John Hoddinott, February 1997
26 Why Have Some Indian States Performed Better Than Others at Reducing Rural Poverty?, Gaurav Datt and Martin Ravallion, March 1997
27 "Bargaining" and Gender Relations: Within and Beyond the Household, Bina Agarwal, March 1997 28 Developing a Research and Action Agenda for Examining Urbanization and Caregiving: Examples
from Southern and Eastern Africa, Patrice L. Engle, Purnima Menon, James L. Garrett, and Alison Slack, April 1997
29 Gender, Property Rights, and Natural Resources, Ruth Meinzen-Dick, Lynn R. Brown, Hilary Sims Feldstein, and Agnes R. Quisumbing, May 1997
30 Plant Breeding: A Long-Term Strategy for the Control of Zinc Deficiency in Vulnerable Populations, Marie T. Ruel and Howarth E. Bouis, July 1997
31 Is There an Intrahousehold 'Flypaper Effect'? Evidence from a School Feeding Program, Hanan Jacoby, August 1997
32 The Determinants of Demand for Micronutrients: An Analysis of Rural Households in Bangladesh, Howarth E. Bouis and Mary Jane G. Novenario-Reese, August 1997
33 Human Milk —An Invisible Food Resource, Anne Hatløy and Arne Oshaug, August 1997
34 The Impact of Changes in Common Property Resource Management on Intrahousehold Allocation, Philip Maggs and John Hoddinott, September 1997
35 Market Access by Smallholder Farmers in Malawi: Implications for Technology Adoption, Agricultural Productivity, and Crop Income, Manfred Zeller, Aliou Diagne, and Charles Mataya, September 1997 36 The GAPVU Cash Transfer Program in Mozambique: An assessment, Gaurav Datt, Ellen Payongayong,
James L. Garrett, and Marie Ruel, October 1997
37 Why Do Migrants Remit? An Analysis for the Dominican Sierra, Bénédicte de la Brière, Alain de Janvry, Sylvie Lambert, and Elisabeth Sadoulet, October 1997
39 Whose Education Matters in the Determination of Household Income: Evidence from a Developing Country, Dean Jolliffe, November 1997
40 Can Qualitative and Quantitative Methods Serve Complementary Purposes for Policy Research? Evidence from Accra, Dan Maxwell, January 1998
41 The Political Economy of Urban Food Security in Sub-Saharan Africa, Dan Maxwell, February 1998 42 Farm Productivity and Rural Poverty in India, Gaurav Datt and Martin Ravallion, March 1998 43 How Reliable Are Group Informant Ratings? A Test of Food Security Rating in Honduras, Gilles
Bergeron, Saul Sutkover Morris, and Juan Manuel Medina Banegas, April 1998
44 Can FAO's Measure of Chronic Undernourishment Be Strengthened?, Lisa C. Smith, with a Response by Logan Naiken, May 1998
45 Does Urban Agriculture Help Prevent Malnutrition? Evidence from Kampala, Daniel Maxwell, Carol Levin, and Joanne Csete, June 1998
46 Impact of Access to Credit on Income and Food Security in Malawi, Aliou Diagne, July 1998 47 Poverty in India and Indian States: An Update, Gaurav Datt, July 1998
48 Human Capital, Productivity, and Labor Allocation in Rural Pakistan, Marcel Fafchamps and Agnes R. Quisumbing, July 1998
49 A Profile of Poverty in Egypt: 1997, Gaurav Datt, Dean Jolliffe, and Manohar Sharma, August 1998. 50 Computational Tools for Poverty Measurement and Analysis, Gaurav Datt, October 1998
51 Urban Challenges to Food and Nutrition Security: A Review of Food Security, Health, and Caregiving in the Cities, Marie T. Ruel, James L. Garrett, Saul S. Morris, Daniel Maxwell, Arne Oshaug, Patrice Engle, Purnima Menon, Alison Slack, and Lawrence Haddad, October 1998
52 Testing Nash Bargaining Household Models With Time-Series Data, John Hoddinott and Christopher Adam, November 1998
53 Agricultural Wages and Food Prices in Egypt: A Governorate-Level Analysis for 1976-1993, Gaurav Datt and Jennifer Olmsted, November 1998
54 Endogeneity of Schooling in the Wage Function: Evidence from the Rural Philippines, John Maluccio, November 1998
55 Efficiency in Intrahousehold Resource Allocation, Marcel Fafchamps, December 1998
56 How Does the Human Rights Perspective Help to Shape the Food and Nutrition Policy Research Agenda?, Lawrence Haddad and Arne Oshaug, February 1999
57 The Structure of Wages During the Economic Transition in Romania, Emmanuel Skoufias, February 1999
59 Placement and Outreach of Group-Based Credit Organizations: The Cases of ASA, BRAC, and PROSHIKA in Bangladesh, Manohar Sharma and Manfred Zeller, March 1999
60 Explaining Child Malnutrition in Developing Countries: A Cross-Country Analysis, Lisa C. Smith and Lawrence Haddad, April 1999
61 Does Geographic Targeting of Nutrition Interventions Make Sense in Cities? Evidence from Abidjan and Accra, Saul S. Morris, Carol Levin, Margaret Armar-Klemesu, Daniel Maxwell, and Marie T. Ruel, April 1999
62 Good Care Practices Can Mitigate the Negative Effects of Poverty and Low Maternal Schooling on Children's Nutritional Status: Evidence from Accra, Marie T. Ruel, Carol E. Levin, Margaret Armar-Klemesu, Daniel Maxwell, and Saul S. Morris, April 1999
63 Are Urban Poverty and Undernutrition Growing? Some Newly Assembled Evidence, Lawrence Haddad, Marie T. Ruel, and James L. Garrett, April 1999
64 Some Urban Facts of Life: Implications for Research and Policy, Marie T. Ruel, Lawrence Haddad, and James L. Garrett, April 1999
65 Are Determinants of Rural and Urban Food Security and Nutritional Status Different? Some Insights from Mozambique, James L. Garrett and Marie T. Ruel, April 1999
66 Working Women in an Urban Setting: Traders, Vendors, and Food Security in Accra, Carol E. Levin, Daniel G. Maxwell, Margaret Armar-Klemesu, Marie T. Ruel, Saul S. Morris, and Clement Ahiadeke, April 1999
67 Determinants of Household Access to and Participation in Formal and Informal Credit Markets in Malawi, Aliou Diagne, April 1999
68 Early Childhood Nutrition and Academic Achievement: A Longitudinal Analysis, Paul Glewwe, Hanan Jacoby, and Elizabeth King, May 1999
69 Supply Response of West African Agricultural Households: Implications of Intrahousehold Preference Heterogeneity, Lisa C. Smith and Jean-Paul Chavas, July 1999
70 Child Health Care Demand in a Developing Country: Unconditional Estimates from the Philippines, Kelly Hallman, August 1999
71 Social Capital and Income Generation in South Africa, 1993-98, John Maluccio, Lawrence Haddad, and Julian May, September 1999
72 Validity of Rapid Estimates of Household Wealth and Income for Health Surveys in Rural Africa, Saul S. Morris, Calogero Carletto, John Hoddinott, and Luc J. M. Christiaensen, October 1999
73 Social Roles, Human Capital, and the Intrahousehold Division of Labor: Evidence from Pakistan, Marcel Fafchamps and Agnes R. Quisumbing, October 1999
74 Can Cash Transfer Programs Work in Resource-Poor Countries? The Experience in Mozambique, Jan W. Low, James L. Garrett, and Vitória Ginja, October 1999
Demand, SudhanshuHanda, November 1999
77 ThePoliticalEconomy of FoodSubsidyReforminEgypt, TammiGutner, November 1999.
78 Determinants of PovertyinMozambique: 1996-97, GauravDatt, KennethSimler, SanjuktaMukherjee,
andGabrielDava, January2000
79 AdultHealthintheTimeofDrought, JohnHoddinottandBillKinsey, January2000
80 Nontraditional Crops and Land Accumulation Among Guatemalan Smallholders: Is the Impact Sustainable? Calogero Carletto, February 2000
81 The Constraints to Good Child Care Practices in Accra: Implications for Programs, Margaret Armar-Klemesu, Marie T. Ruel, Daniel G. Maxwell, Carol E. Levin, and Saul S. Morris, February 2000 82 Pathways of Rural Development in Madagascar: An Empirical Investigation of the Critical Triangle of
Environmental Sustainability, Economic Growth, and Poverty Alleviation, Manfred Zeller, Cécile Lapenu, Bart Minten, Eliane Ralison, Désiré Randrianaivo, and Claude Randrianarisoa, March 2000 83 Quality or Quantity? The Supply-Side Determinants of Primary Schooling in Rural Mozambique,
Sudhanshu Handa and Kenneth R. Simler, March 2000
84 Intrahousehold Allocation and Gender Relations: New Empirical Evidence from Four Developing Countries, Agnes R. Quisumbing and John A. Maluccio, April 2000
85 Intrahousehold Impact of Transfer of Modern Agricultural Technology: A Gender Perspective, Ruchira Tabassum Naved, April 2000
86 Women’s Assets and Intrahousehold Allocation in Rural Bangladesh: Testing Measures of Bargaining Power, Agnes R. Quisumbing and Bénédicte de la Brière, April 2000
87 Changes in Intrahousehold Labor Allocation to Environmental Goods Collection: A Case Study from Rural Nepal, Priscilla A. Cooke, May 2000
88 The Determinants of Employment Status in Egypt, Ragui Assaad, Fatma El-Hamidi, and Akhter U. Ahmed, June 2000
89 The Role of the State in Promoting Microfinance Institutions, Cécile Lapenu, June 2000
90 Empirical Measurements of Households’ Access to Credit and Credit Constraints in Developing Countries: Methodological Issues and Evidence, Aliou Diagne, Manfred Zeller, and Manohar Sharma, July 2000
91 Comparing Village Characteristics Derived From Rapid Appraisals and Household Surveys: A Tale From Northern Mali, Luc Christiaensen, John Hoddinott, and Gilles Bergeron, July 2000
92 Assessing the Potential for Food-Based Strategies to Reduce Vitamin A and Iron Deficiencies: A Review of Recent Evidence, Marie T. Ruel and Carol E. Levin, July 2000
93 Mother-Father Resource Control, Marriage Payments, and Girl-Boy Health in Rural Bangladesh, Kelly K. Hallman, September 2000
95 Attrition in the Kwazulu Natal Income Dynamics Study 1993-1998, John Maluccio, October 2000 96 Attrition in Longitudinal Household Survey Data: Some Tests for Three Developing-Country Samples,
Harold Alderman, Jere R. Behrman, Hans-Peter Kohler, John A. Maluccio, Susan Cotts Watkins, October 2000
97 Socioeconomic Differentials in Child Stunting Are Consistently Larger in Urban Than in Rural Areas, Purnima Menon, Marie T. Ruel, and Saul S. Morris, December 2000
98 Participation and Poverty Reduction: Issues, Theory, and New Evidence from South Africa, John Hoddinott, Michelle Adato, Tim Besley, and Lawrence Haddad, January 2001
99 Cash Transfer Programs with Income Multipliers: PROCAMPO in Mexico, Elisabeth Sadoulet, Alain de Janvry, and Benjamin Davis, January 2001
100 On the Targeting and Redistributive Efficiencies of Alternative Transfer Instruments, David Coady and Emmanuel Skoufias, March 2001
101 Poverty, Inequality, and Spillover in Mexico’s Education, Health, and Nutrition Program, Sudhanshu Handa, Mari-Carmen Huerta, Raul Perez, and Beatriz Straffon, March 2001
102 School Subsidies for the Poor: Evaluating a Mexican Strategy for Reducing Poverty, T. Paul Schultz, March 2001
103 Targeting the Poor in Mexico: An Evaluation of the Selection of Households for PROGRESA, Emmanuel Skoufias, Benjamin Davis, and Sergio de la Vega, March 2001
104 An Evaluation of the Impact of PROGRESA on Preschool Child Height, Jere R. Behrman and John Hoddinott, March 2001
105 The Nutritional Transition and Diet-Related Chronic Diseases in Asia: Implications for Prevention, Barry M. Popkin, Sue Horton, and Soowon Kim, March 2001
106 Strengthening Capacity to Improve Nutrition, Stuart Gillespie, March 2001
107 Rapid Assessments in Urban Areas: Lessons from Bangladesh and Tanzania, James L. Garrett and Jeanne Downen, April 2001
108 How Efficiently Do Employment Programs Transfer Benefits to the Poor? Evidence from South Africa, Lawrence Haddad and Michelle Adato, April 2001
109 Does Cash Crop Adoption Detract From Childcare Provision? Evidence From Rural Nepal, Michael J. Paolisso, Kelly Hallman, Lawrence Haddad, and Shibesh Regmi, April 2001