Sensor Data Classification for the Indication of
Lameness in Sheep
Al-Rubaye Zainab1, 3, Al-Sherbaz Ali1, McCormick Wanda2, and Turner Scott1 1 Department of Computing and Immersive Technologies, School of Art, Science and
Technology, Northampton, NN2 6JD, UK
{zainab.al-rubaye,ali.al-sherbaz,scott.turner}@northampton.ac.uk 3 Computer Science Dept., College of Science, University of Baghdad, Baghdad, Iraq
2 Animal Welfare & Management, Moulton College, Northampton, NN3 7RR, UK [email protected]
Abstract. Lameness is a vital welfare issue in most sheep farming countries, including the UK. The pre-detection at the farm level could prevent the disease from becoming chronic. The development of wearable sensor technologies enables the idea of remotely monitoring the changes in animal movements which relate to lameness. In this study, 3D-acceleration, 3D-orientation, and 3D-linear acceleration sensor data were recorded at ten samples per second via the sensor attached to sheep neck collar. This research aimed to determine the best accuracy among various supervised machine learning techniques which can predict the early signs of lameness while the sheep are walking on a flat field. The most influencing predictors for lameness indication were also addressed here. The experimental results revealed that the Decision Tree classifier has the highest accuracy of 75.46%, and the orientation sensor data (angles) around the neck are the strongest predictors to differentiate among severely lame, mildly lame and sound classes of sheep.
Keywords: Sensor data analysis. Classification. Sheep lameness detection.
1 Introduction
Lameness is a painful impaired movement disorder, which relates to an animal’s locomotion system and causes a deviation from normal gait or posture [1]. In sheep, footrot is the most common cause, resulting in 90% of the sheep lameness cases in the UK [2][3]. Unfortunately, lameness has a negative impact on the sheep industry and overall farm productivity. Statistics from the Agriculture and Horticulture Development Board (AHDB) estimated the annual UK economic loss to be £10 for each ewe in 2016 [4]. The underlying reasons for the commercial loss in the UK sheep industry can be related to declines in various outcomes, including sheep body condition; lambing percentage; lamb birth weight; growth rate in lambs; wool growth; milk production and poor fertility in rams [5]. Hence, the lameness is listed as one of the main causes for sheep culling beside infertility and mastitis [6][7].
Although lameness is endemic and cannot be eradicated entirely, the early detection of lameness will prevent the condition from spreading quickly within the flock. Thus, the advantages of early lameness detection can maximise the farm’s income, enhancing sheep welfare to improving the entire flock performance and reducing the veterinary, medicine, and labour costs [5]
2 Lameness Detection
Since the indication for lameness correlates with changes in animal posture, gait, or behaviour, previous studies have utilised different types of data collection and data analysis methods which were applied in various ways for lameness detection in cattle. However, there is a paucity of research studies of sheep lameness detection.
2.1 Data Collection Methods
Initially, lameness was assessed by trained observers who scored the lameness level via a numerical rating system (NRS). Although the subjective method for scoring lameness can be implemented with no technical equipment and could suit on-farm assessment, it lacks the objective reliability [8].
Alternatively, surveillance cameras were used to record gait measurements which relate to lameness in the cows to be tested by computer vision techniques. For instance, back arch curvature was studied by [9][10][11], the body movements pattern was explored by [12], and the step overlap was investigated in cattle by [13][14]. Despite the extraction of features that strongly relate to gait variables from computer vision techniques, as investigated by many authors, the implementation of computer vision techniques on the farm is still a challenging task [15].
Various sensor systems have been developed to evaluate animal movements using either leg mounted sensors or neck attached sensors. Most of the studies that have implemented data collection via sensors to detect lameness were undertaken with cattle rather than sheep. Mainly, the sensor devices that attached to the cow’s leg, pedometers, were used [16] to calculate the mean number of steps per hour as an indicator for lameness in cattle, whereas in [6] the researcher depended on the measurement of the activity and lying behaviour for lameness indication.
Accelerometers have also been mounted to the leg to measure the gait features in relation to cow lameness. For example, the differences in the symmetry of variance for the forward acceleration of the hind legs of the cow were explored in [17]; the acceleration of legs and back of the cow was investigated in [18]; while the researcher in [19] measured the lying and standing time, the number of lying bouts, and step count to identify the characteristic of the lame limb. Statistically, the early signs of lameness were illustrated by [20] by performing the Principal Component Analysis (PCA). Furthermore, a neck acceleration sensor was also explored in a pilot study that was conducted by [21] to investigate the relationship between the mobility score and the neck acceleration measurements which linked to the lame cow by using statistical kurtosis measurement.
2.2 Data Analysis Approaches
The resulting information from sensor-based data calls for more professional and precise approaches to analyse such relatively large data sets, in order to classify and infer animal behaviour. The concept of ‘reality mining’ has explored the idea of cross -collaboration between disciplines to produce more integrated approaches [22]. Therefore, Data Mining techniques, which are a confluence of many disciplines [23], have been used to analyse the sensor-based data to classify various behavioural types that could have played an important role to detect some illness concerns such as lameness.
Machine Learning (ML) is one set of techniques adopted within data mining which investigates how computers learn from the data set to enhance the performance of the tested algorithm automatically. Supervised ML algorithms (classification) can identify a complex pattern (class) of new test data, based on the attributes of previously known classes of training data sets, and predict an intelligent decision [21].
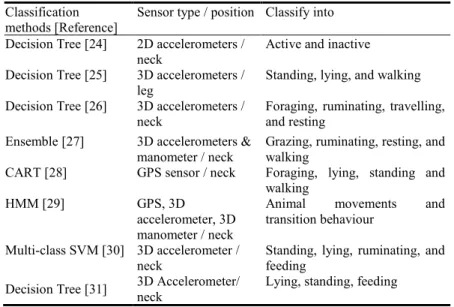
Apart from lameness detection, analysis methods and different classification approaches have mostly investigated different sensor-based data to identify a wide range of behaviour patterns for various species including cattle and sheep. The following two tables (1 & 2) display the research studies which classify cattle and sheep behaviour by using ML with sensor-based data predictors.
Table 1. Cattle behaviour classification in research studies Classification
methods [Reference]
Sensor type / position Classify into Decision Tree [24] 2D accelerometers /
neck
Active and inactive Decision Tree [25] 3D accelerometers /
leg
Standing, lying, and walking Decision Tree [26] 3D accelerometers /
neck
Foraging, ruminating, travelling, and resting
Ensemble [27] 3D accelerometers &
manometer / neck Grazing, ruminating, resting, and walking CART [28] GPS sensor / neck Foraging, lying, standing and
walking
HMM [29] GPS, 3D
accelerometer, 3D manometer / neck
Animal movements and transition behaviour
Multi-class SVM [30] 3D accelerometer / neck
Standing, lying, ruminating, and feeding
Table 2. Sheep behaviour classification in research studies Classification methods [Reference] Sensor type / position Classify into LDA, Classification Tree,
and developed Decision Tree [32]
Pitch & Roll tilt sensor / neck
Active and inactive
LDA, QDA [33] 3D
accelerometers / neck
Lying, standing, walking, running and grazing
Decision Tree [34] 3D accelerometer / under the jaw
Grazing, lying, running, standing and walking
Statistical analysis methods [35]
3D accelerometer / under the jaw
Grazing, ruminating and resting
3 Research Method
Predominantly, the previous studies have investigated how to detect lameness in dairy cattle and how to classify their behaviour depending on ML techniques, while the undertaken research explored lameness detection in sheep via the classification of acceleration orientation and linear acceleration data that were retrieved from a mounted sensor within a neck collar.
3.1 Data Collection
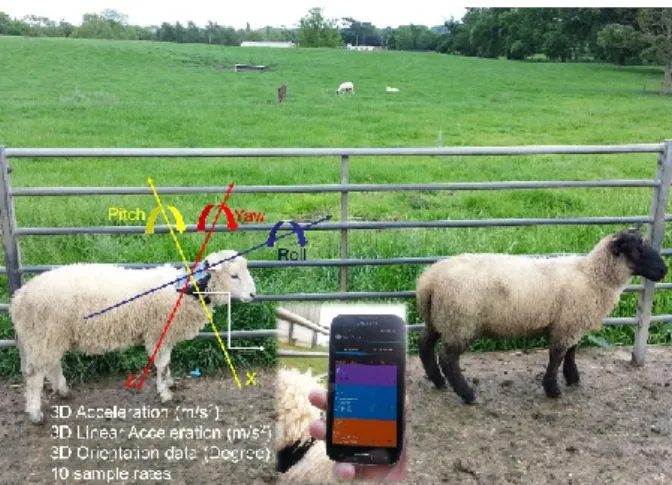
The data were collected from Lodge Farm, Moulton College in Northamptonshire, UK, in January 2017 from seven sheep which were labelled as purple, green, and neutral by a trained shepherd to indicate ‘severely lame’, ‘mildly lame’, and ‘sound’ respectively. A Galaxy S4 Android 5.0 mobile device was attached to the sheep neck collar to record built in sensor data via a free Android sensor application called SensoDuino [36].
In the study, SensoDuino recorded three-dimensional acceleration, linear acceleration, and orientation sensor data into a log file in the SD card of the mobile device for later data analysis. The measurements were logged for 3-7 minutes while the sheep was walking on a flat field at ten samples per second. The video footages were also taken as ground truth recordings. Fig. 1 shows the sensor position on the sheep neck at the farm.
Remark 1. The ethical approval and risk assessment request to visit the Lodge Farm and collect the data about the sheep movements via a sensor neck collar was authorised by the Moulton College research committee in April 2016.
Fig. 1. Sensor deployment on the Lodge Farm. 3.2 Raw Data Interpretation
The accelerometer sensor calculates the changes in movements involving the gravity around three axes, while the linear acceleration measurements exclude it. Whereas, the orientation calculates the value of the angles around the neck (in degrees) for three dimensions.
The initial plotting of the raw data and its class are shown in Fig. 2. It is visually interpreted that the sound class and non-sound class (severely and mildly lame) can be linearly separated in Fig. 2.c. Therefore, the orientation group can be the best indicator for lameness in sheep. However, the severely lame and mildly lame class are overlapped and challenging to distinguish.
On the other hand, the acceleration data group (Fig 2.a) has less impact than the orientation group, while the linear acceleration data (Fig 2.b) may not be as useful as a single predictor because of no gravity measurements here.
a. Acceleration sensor data b. Linear acceleration sensor data c. Orientation sensor data
3.3 Raw Data Preparation for ML Classifier
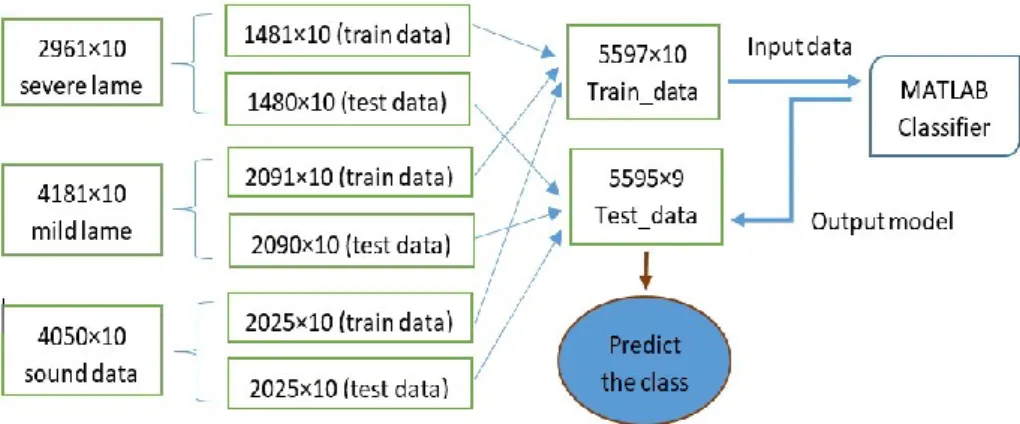
In this pilot study, recordings from seven sheep were considered, their details are listed in Table 3. Each recording refers to the sheep that had been mounted with the SensoDuino sensor that retrieved ten10 readings per second. The lameness class for the participant sheep was either severely lame, mildly lame or sound.
Table 3. Details of the collected data File name Total samples
(10 samples per second)
Sheep status
L1_severe 2961 severely lame
L1_mild 4181 mildly lame
S1 4050 sound
L2_severe 4292 severely lame
L2_mild 2211 mildly lame
S2 2741 sound
S7 1626 sound
The input data to the classifier model, implemented in Matlab (Mathworks, USA) to be trained include acceleration data (Acc_x, Acc_y, Acc_z), linear acceleration data (AccLin_x, AccLin_y, AccLin_z), and orientation data (Azimuth, Pitch, Roll). Furthermore, another column was added to the previous nine input columns that indicated the status class of the sheep as either severely lame, mildly lame or sound. The L1_severe file (relating to a severely lame sheep) was divided into two files, one used to train the model and the other for testing the model. The same procedure was implemented to L1_mild and S1 files that relate to mildly lame and sound sheep respectively. Fig. 3 illustrates how the data files were prepared for Matlab learner classifier. It also shows how the model was built and tested.
4 Initial Results and Discussion
A pilot study was applied to investigate the current supervised machine learning techniques which produced promising results regarding the best classifier performance, the strongest predictor group, and testing the prediction accuracy for the built models with new data set.
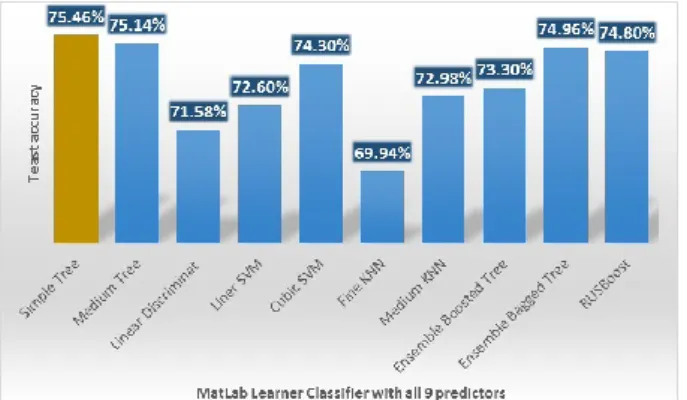
4.1 Investigation of the Best Classifier
The main experiment was conducted to evaluate the effective classifier for lameness detection when all nine predictors were used to train the model. The results in Fig. 4 show that the Simple Tree classifier (decision tree) has the highest test accuracy of 75.46% when it is tested with Test_data file (see Fig. 3).
Fig. 4. MatLab classifier accuracy for (3 Acc, 3 AccLin, and 3 Angles) readings of SensoDuino. The overall accuracy of the classifier performance and the sensitivity to predict each class separately are calculated by equation (1) and (2) respectively as follows:
Classifier accuracy =Number of correct predictions
Total number of predictions
= (𝑇𝑃 + 𝑇𝑁) (𝑇𝑃 + 𝑇𝑁 + 𝐹𝑃 + 𝐹𝑁) (1) The Sensitivity = 𝑇𝑃 (𝑇𝑃 + 𝐹𝑁) (2)
The confusion matrix was used to measure the performance of a classifier learner on a set of known class data [37]. The diagonal line in the confusion matrix represents the overall of True Positive predictions (TP) and True Negative predictions (TN), which means that the actual classes match the predicted classes. Otherwise, the area above and under the diagonal are called False Negative (FN) and False Positive (FP) [38]. The confusion matrix for the Simple Tree classifier (decision tree) is presented in Fig. 5.
Fig. 5. A confusion matrix for a Decision Tree classifier.
4.2 Investigation of the Strongest Predictor Group
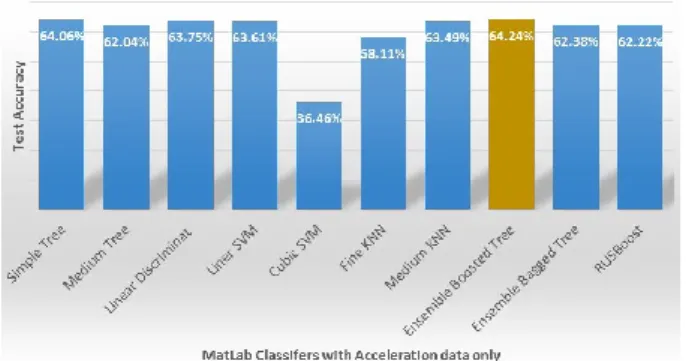
For eliminating the number of lameness predictors, the attention was turned towards identifying the impact of each group among acceleration, linear acceleration, and orientation (angles). In general, when using the angle data as predictors to build the training model, the result accuracy ratio tends to be higher in comparison to acceleration data group or linear acceleration group.
The first group of predictors, which are the acceleration data (Acc), were tested with more than one classifier. The results in Fig. 6 indicate that both Ensemble Bagged Tree and Medium Tree showed the result with an accuracy ratio of 64.24% and 64.06% respectively. In fact, the acceleration data here are the measurements of changing in the velocity as well as the gravity of the object to the earth. Acceleration data are expected to be sensitive to the sheep activity in behaviours like grazing when the sheep’s head is down rather than being in a normal posture.
Fig. 6. Accuracy results for Matlab classifiers when acceleration (include the gravity) is tested. The second data group to be investigated was the linear acceleration (AccLin) which refers to acceleration only without gravity. These parameters show the changes in velocity as it is more helpful to know if the sheep are walking quickly, in a slow rhythm or not walking at all. In Fig. 7, the results show that the Ensemble Bagged Tree produced a higher rate of accuracy compared to the other classifiers. However, the overall accuracy of all classifiers is less than 44.52%. Consequently, the utilising of the
linear acceleration sensor data as the only predictor are not quite as useful to indicate lameness.
Fig. 7. Accuracy results for Matlab classifiers when the linear acceleration is tested. The third and the most active group for lameness detection was the orientation data which indicated the value of the angle around x-axis (pitch), y-axis, (roll), and z-axis (azimuth). The results in Fig. 8 reflect that the Simple Tree classifier can be used to produce a better prediction result among the other classifiers. Generally, when using the angle data as predictors to build the training model, the result accuracy ratio tends to be higher in comparison to the acceleration data group or linear acceleration group separately.
Fig. 8. Accuracy results for Matlab classifiers when Azimuth, Pitch, and Roll are the only input predictors.
4.3 Testing the models with unseen data samples
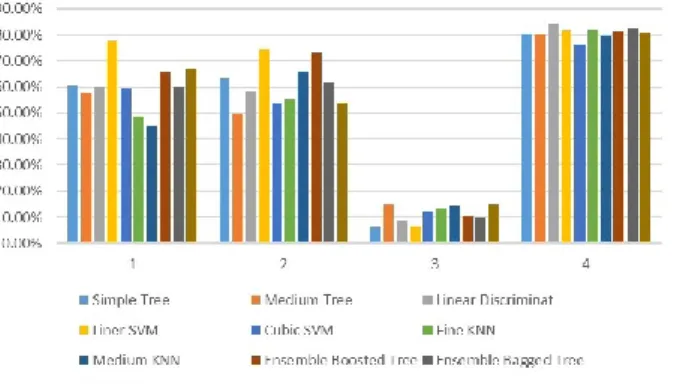
The built models were tested with new unseen examples, which are listed in Table 3, to measure the reliability of the models with a new data set. In Fig. 9, the results show the sensitivity to predict the sound class (S7) is higher than 80% for all classifiers compared to the sensitivity to predict the mildly lame and severely lame classes (L2_mild and L2_severe), with the mean sensitivity of 60.93% and 60.18% respectively.
Furthermore, in Fig. 9, it was noticed that the accuracy ratio to predict lameness in sheep was affected by the initial placement of the mobile device. For instance, the
movement of the sound sheep S2 during the experiment led the sensor to be shifted
from its initial placement. As a result, the prediction accuracy of S2 was too low.
Fig. 9. The accuracy results for the trained models when new data set was tested (1= L2_severe, 2=L2_mild, 3=S2, and 4=S7)
5 Conclusion and Future Work
It is concluded from the current research that the Decision Tree is the best ML classifier for the sheep sensor-based data to predict the early signs of lameness. Moreover, the higher accuracy ratio is recorded with the orientation group (pitch, roll, and azimuth), whatever the applied classifier is. Conversely, the lowest accuracy ratio is registered with the linear acceleration group.
In future work, the initial sensor positioning where the calibration to the reference sensor readings is essential will be taken into consideration, since the sensor reading samples need to be reliable in a flat and a varied terrain as well. Furthermore, the raw data need to be pre-processed for the sake of improved lameness prediction and distinction in severity.
Acknowledgement. With great appreciation to the Ministry of Higher Education and Scientific Research in Iraq for the financial support. Many thanks to the University of Northampton and Moulton College for the cooperative efforts to provide a satisfactory academic environment. Many thanks for the Lodge Farm Shepherd ‘Tim’ who was very helpful in scheduling the observation time at Lodge Farm.
References
1. A. Van Nuffel, I. Zwertvaegher, L. Pluym, S. Van Weyenberg, V. Thorup, M. Pastell, B. Sonck, and W. Saeys, “Lameness Detection in Dairy Cows: Part 1. How to Distinguish
between Non-Lame and Lame Cows Based on Differences in Locomotion or Behavior,”
2. M. Groenevelt, K. Anzuino, S. Smith, M. R. F. Lee, and R. Grogono-Thomas, “A case report
of lameness in two dairy goat herds; a suspected combination of nutritional factors concurrent
with treponeme infection,” BMC Res. Notes, vol. 8, no. 1, p. 791, 2015.
3. P. D. Scott, DipECBHM, CertCHP, DSHP, and FRCVS, “Lameness Control in Sheep,”
2016. [Online]. Available: http://www.nadis.org.uk/bulletins/lameness-control-in-sheep.aspx. [Accessed: 13-Mar-2017].
4. K. Brian, “Reducing Lameness for Better Returns,” 2016.
5. Defra, “Lameness in Sheep,” 2003. [Online]. Available:
http://adlib.everysite.co.uk/adlib/defra/content.aspx?id=000IL3890W.18B4NRK0LZK8LC. [Accessed: 14-Mar-2017].
6. M. Alsaaod, C. Römer, J. Kleinmanns, K. Hendriksen, S. Rose-Meierhöfer, L. Plümer, and
W. Büscher, “Electronic detection of lameness in dairy cows through measuring pedometric
activity and lying behavior,” Appl. Anim. Behav. Sci., vol. 142, no. 3–4, pp. 134–141, 2012.
7. AHDB, “Managing cull ewes,” 2016.
8. F. C. Flower and D. M. Weary, “Gait assessment in dairy cattle,” Animal, vol. 3, no. 1, pp.
87–95, 2009.
9. A. Poursaberi, C. Bahr, A. Pluk, A. Van Nuffel, and D. Berckmans, “Real-time automatic lameness detection based on back posture extraction in dairy cattle: Shape analysis of cow
with image processing techniques,” Comput. Electron. Agric., vol. 74, no. 1, pp. 110–119,
2010.
10.S. Viazzi, C. Bahr, a Schlageter-Tello, T. Van Hertem, C. E. B. Romanini, a Pluk, I.
Halachmi, C. Lokhorst, and D. Berckmans, “Analysis of individual classification of lameness
using automatic measurement of back posture in dairy cattle.,” J. Dairy Sci., vol. 96, no. 1, pp. 257–66, 2013.
11.S. Viazzi, C. Bahr, T. Van Hertem, A. Schlageter-Tello, C. E. B. Romanini, I. Halachmi, C.
Lokhorst, and D. Berckmans, “Comparison of a three-dimensional and two-dimensional
camera system for automated measurement of back posture in dairy cows,” Comput. Electron. Agric., vol. 100, pp. 139–147, 2014.
12.A. Poursaberi, C. Bahr, A. Pluk, D. Berckmans, I. Veermae, E. Kokin, and V. Pokalainen,
“Online lameness detection in dairy cattle using Body Movement Pattern (BMP),” Int. Conf.
Intell. Syst. Des. Appl., no. 1, pp. 732–736, 2011.
13.X. Song, T. Leroy, E. Vranken, W. Maertens, B. Sonck, and D. Berckmans, “Automatic
detection of lameness in dairy cattle-Vision-based trackway analysis in cow’s locomotion,”
Comput. Electron. Agric., vol. 64, no. 1, pp. 39–44, 2008.
14.A. Pluk, C. Bahr, T. Leroy, A. Poursaberi, X. Song, E. Vranken, W. Maertens, A. Van Nuffel,
and D. Berckmans, “Evaluation of Step Overlap as an Automatic Measure in Dairy Cow
Locomotion,” Am. Soc. Agric. Biol. Eng., vol. 53, no. 4, pp. 1305–1312, 2010.
15.T. Van Hertem, M. Steensels, S. Viazzi, E. C. B. Romanini, A. Schlageter Tello, K. Lokhorst,
E. Maltz, and I. Halachmi, “Improving a computer vision lameness detection system by
adding behaviour and performance measures,” Proc. Int. Conf. Agric. Eng., pp. 1–8, 2014.
16.H. Mazrier, S. Tal, E. Aizinbud, and U. Bargai, “A field investigation of the use of the
pedometer for the early detection of lameness in cattle,” Can. Vet. J., vol. 47, no. 9, pp. 883–
886, 2006.
17.M. Pastell, J. Tiusanen, M. Hakojärvi, and L. Hänninen, “A wireless accelerometer system
with wavelet analysis for assessing lameness in cattle,” Biosyst. Eng., vol. 104, no. 4, pp.
545–551, 2009.
18.N. Chapinal, A. M. de Passillé, M. Pastell, L. Hänninen, L. Munksgaard, and J. Rushen,
“Measurement of acceleration while walking as an automated method for gait assessment in
dairy cattle,” J. Dairy Sci., vol. 94, no. 6, pp. 2895–2901, 2011.
19.E. Kokin, J. Praks, I. Veermäe, V. Poikalainen, and M. Vallas, “IceTag3DTM accelerometric
device in cattle lameness detection,” Agron. Res., vol. 12, no. 1, pp. 223–230, 2014.
Friggens, “Lameness detection via leg-mounted accelerometers on dairy cows on four commercial farms,” Animal, vol. 9, no. 10, pp. 1704–1712, 2015.
21.T. T. Mottram and N. J. Bell, “A novel method of monitoring mobility in dairy cows,” First
North Am. Conf. Precis. Dairy Manag., pp. 2–3, 2010.
22.J. Krause, S. Krause, R. Arlinghaus, I. Psorakis, S. Roberts, and C. Rutz, “Reality mining of
animal social systems,” Trends Ecol. Evol., vol. 28, no. 9, pp. 541–551, 2013.
23.H. Jiawei, M. Kamber, and J. Pei, Data Mining: Concepts and Techniques, 3rd Editio. Elsevier, 2012.
24.E. S. Nadimi, H. T. Søgaard, and T. Bak, “ZigBee-based wireless sensor networks for
classifying the behaviour of a herd of animals using classification trees,” Biosyst. Eng., vol.
100, no. 2, pp. 167–176, 2008.
25.B. Robert, B. J. White, D. G. Renter, and R. L. Larson, “Evaluation of three-dimensional accelerometers to monitor and classify behavior patterns in cattle,” Comput. Electron. Agric., vol. 67, no. 1–2, pp. 80–84, 2009.
26.L. A. González, G. J. Bishop-Hurley, R. N. Handcock, and C. Crossman, “Behavioral
classification of data from collars containing motion sensors in grazing cattle,” Comput.
Electron. Agric., vol. 110, pp. 91–102, 2015.
27.R. Dutta, D. Smith, R. Rawnsley, G. Bishop-Hurley, J. Hills, G. Timms, and D. Henry,
“Dynamic cattle behavioural classification using supervised ensemble classifiers,” Comput.
Electron. Agric., vol. 111, pp. 18–28, 2015.
28.N. de Weerd, F. van Langevelde, H. van Oeveren, B. A. Nolet, A. Kölzsch, H. H. T. Prins,
and W. F. de Boer, “Deriving Animal Behaviour from High-Frequency GPS: Tracking Cows
in Open and Forested Habitat,” PLoS One, vol. 10, no. 6, p. e0129030, 2015.
29.Y. Guo, G. Poulton, P. Corke, G. J. Bishop-Hurley, T. Wark, and D. L. Swain, “Using
accelerometer, high sample rate GPS and magnetometer data to develop a cattle movement
and behaviour model,” Ecol. Modell., vol. 220, no. 17, pp. 2068–2075, 2009.
30.P. Martiskainen, M. Järvinen, J.-P. Skön, J. Tiirikainen, M. Kolehmainen, and J. Mononen,
“Cow behaviour pattern recognition using a three-dimensional accelerometer and support
vector machines,” Appl. Anim. Behav. Sci., vol. 119, no. 1–2, pp. 32–38, 2009.
31.J. A. Vázquez Diosdado, Z. E. Barker, H. R. Hodges, J. R. Amory, D. P. Croft, N. J. Bell,
and E. A. Codling, “Classification of behaviour in housed dairy cows using an
accelerometer-based activity monitoring system,” Anim. Biotelemetry, vol. 3, no. 1, p. 15, 2015.
32.C. Umstätter, A. Waterhouse, and J. P. Holland, “An automated sensor-based method of
simple behavioural classification of sheep in extensive systems,” Comput. Electron. Agric., vol. 64, no. 1, pp. 19–26, 2008.
33.J. Marais, S. P. Le Roux, R. Wolhuter, and T. Niesler, “Automatic classification of sheep
behaviour using 3-axis accelerometer data,” in twenty-fifth annual symposium of the Pattern Recognition Association of South Africa (PRASA), 2014, pp. 978–0.
34.F. A. P. Alvarenga, I. Borges, L. Palkovič, J. Rodina, V. H. Oddy, and R. C. Dobos, “Using
a three-axis accelerometer to identify and classify sheep behaviour at pasture,” Appl. Anim. Behav. Sci., vol. 181, pp. 91–99, 2015.
35.V. Giovanetti, M. Decandia, G. Molle, M. Acciaro, M. Mameli, A. Cabiddu, R. Cossu, M.
G. Serra, C. Manca, S. P. G. Rassu, and C. Dimauro, “Automatic classification system for
grazing, ruminating and resting behaviour of dairy sheep using a tri-axial accelerometer,”
Livest. Sci., vol. 196, no. December 2016, pp. 42–48, 2016.
36.H. Bitar, “SensoDuino: Log and Transmit Android Sensors to Arduino & PC via Bluetooth.”
2013.
37.Kevin Markham, “Simple guide to confusion matrix terminology,” Data School, 2014.
[Online]. Available: http://www.dataschool.io/simple-guide-to-confusion-matrix-terminology/. [Accessed: 28-Aug-2017].
38.P. Tan, M. Steinbach, and V. Kumar, Introduction to Data Mining, 1st Editio. Pearson Education India, 2006.
![Table 2. Sheep behaviour classification in research studies Classification methods [Reference] Sensor type / position Classify into LDA, Classification Tree,](https://thumb-us.123doks.com/thumbv2/123dok_us/9730964.2854641/4.892.217.677.255.448/behaviour-classification-research-classification-reference-position-classify-classification.webp)