A
JPSST
2
H
POLICY RESEARCH WORKING
PAPER
2711
Identifying
Class Size Effects
Do smaller classes raise testscores? Evidence from rural
in Developing Countries
schools in Bolivia suggeststhat they do.
Evidence from Rural Schools
in Bolivia
Miguel Urquiola
The World Bank
Development Research Group
Public Services for Hunman Development
November 2001
Public Disclosure Authorized
Public Disclosure Authorized
Public Disclosure Authorized
I
POLICY RESEARCH WORKING PAPER 2711Summary findings
Although class size has attracted great interest as a policy determine pupil-teacher ratios in rural areas, the author instrument, inferences on its effects are controversial. implements two research designs to deal with this issue. Recent work highlights a particular way to consider the The first uses a teacher allocation pattern as an
endogeneity issues that affect this variable: class size is instrumental variable; the second relies on variation from often correlated with enrollment, which may in turn be remote schools with a single class per grade. Both suggest related to socioeconomic status. that class size has a negative effect on test sc,res.
In Bolivia, Urquiola shows, these correlations are significant. Building from institutional arrangements that
This paper-a product of Public Services for Human Development, Development Research Group-is part of i larger effort in the group to explore ways to improve service delivery in education, health, and social protection. Copie5 of the paper are available free from the World Bank, 1818 H Street NW, Washington, DC 20433. Please contact Hedy Sla,iovich, room mail stop MC3-311, telephone 202-473-7698, fax 202-522-1154, email address hsladovichCaiworldbank.org. Policy Research Working Papers are also posted on the Web at http://econ.worldbank.org. The author may be contacted at [email protected]. November 2001. (39 pages)
The Policy Research Working Paper Series disseminates the findings of work in progress to encourage the exchange of ideas :bout development issues. An objective of the series is to get the findings out quickly, even if the presentations are less than fully polishcu. The papers carry the names of the authors and should be cited accordingly. The findings, interpretations, and conclusions expressed i7 this paper are entirely those of the authors. They do not necessarily represent the view of the World Bank, its Executive Directors, (Ir the countries they represent.
Identifying class size effects in developing countries:
Evidence from rural schools in Bolivia
Miguel Urquiola*
Development Research Group
The World Bank
*[email protected]. For useful comments, I am indebted to David Card, Ken Chay, Paul Gertler, Darren Lubotsky, David Stern, and participants of seminars at Berkeley, Chicago, Cornell, ITAM, Northwestern, The World Bank, and the LACEA meetings. I thank Tito Hoz de Vila, Minister of Education of Bolivia, for providing access to the information used. The institutional support of the Universidad Cat6lica Boliviana, where the empirical work was carried out, is gratefully acknowledged.
1 Introduction
Policy makers in developing countries are increasingly interested in raising educational quality, and often turn to economists for guidance on how this might be done. Perhaps surprisingly, however, economic research sheds little light on how educational authorities should allocate their budgets, at least with respect to what inputs they should emphasize. In a survey of developing country studies, for instance, Hanushek (1995) suggests that none of the commonly studied school inputs has a consistently significant impact on test scores.1 In a review of this research, Kremer (1995) agrees that the evidence on class size, a "popular" input because it can directly and quickly reflect policy, is particularly weak.2
The source of disagreements over the effect of class size and other quality measures is simple: these variables are typically correlated with unobserved factors that also influence educational outcomes, a fact that weakens inferences that are not based on credibly exoge-nous variation. To address this issue, recent research identifies quasi-experimental situations in which the variation in some input is arguably exogenous. This work includes Case and Deaton (1998) in the case of South Africa, and Angrist and Lavy (1999) and Lavy (1999) for Israel.3 These last two papers highlight a particular way to think about endogeneity in
the case of class size.
Namely, this variable is often positively related to enrollment, which may in turn be correlated with socioeconomic status (SES) and achievement. Lavy (1995), for instance, finds an enrollment/SES/achievement link to be an important feature in Israel, and points out that the Coleman (1966) report includes a similar finding for the U.S. Closer to the subject of this paper, MIizala et al. (1999) argue enrollment positively affects test scores in Bolivia, a result they attribute to economies of scale.
This paper first illustrates why such correlations may be prevalent in developing coun-tries, and shows they are indeed a relevant feature in Bolivia. Additionally, it argues they may partially account for why conventional cross sectional analyses suggest that larger classes have no effect on or may even raise test scores, as reviewed in Hanushek (1995). The paper then addresses these endogeneity issues relying on two empirical strategies that emerge from the institutional arrangements that determine pupil/teacher ratios in rural Bolivia.
Using a research design conceptually similar to Angrist and Lavy's (1999), the first approach exploits a teacher allocation practice that allows principals whose schools have classes with more than 30 students to apply for an additional teacher. In the presence of this mechanism, enrollment and class size are not "smoothly" related, making it feasible to iden-tify the latter's effects using the resulting class size function as an instrumental variable. In
1 These conclusions are broadly similar to those from an even more extensive survey Hanushek (1986) presents for the U.S.
2 Other surveys are more optimistic about certain inputs' effects. See for instance Fuller (1986) and Fuller and Clarke (1994) for developing countries, and Hedges, Laine and Greenwald (1994) for the U.S.
3 These efforts are similar to research in the U.S. that explicitly explores the source of variation in some
input. See for instance Finn and Achilles (1990), Akerhielm (1995), Boozer and Rouse (1995), Krueger (1999), and Hoxby (1999).
short, this strategy accepts the presence of an enrollment/SES link, but identifies a situation where the effects of class size can be potentially separated from those of enrollment
The second strategy considers only rural locations so small as to have fewer than 30 students in a single school with only one class per grade. Such institutions are located in remote areas and enjoy a monopoly in educational supply, greatly reducing the scope for parental choice. This, combined with the fact that they do not qualify for adclitional teachers, implies class size is largely out of their authorities' control. These factors may jointly determine that the enrollment/SES correlations that cause bias in other samples are less significant in this setting. In contrast with the first approach, therefore, this sr.rategy focuses on a situation where it is impossible to isolate class size from enrollment because they are in fact equal. Instead, it relies on the fact that in comparisons between remote areas, enrollment/SES correlations may be less important than in broader samples.
All variations of these two approaches suggest class size has a negative and significant impact on test scores. In most cases, the magnitude of the implied effects is not far from those suggested by Finn and Achilles (1990) and Krueger (1999) for the Tennessee STAR experiment,4 and by Angrist and Lavy (1999) for Israel. Additionally, it is consisteilt with the early-schooling effects emphasized by Hanushek (1998) and Krueger (1999).
The remainder of the paper is divided into four sections. The next describes the data and provides some background on Bolivia's educational system. Section 3 presents the general empirical framework and descriptive statistics, Section 4 covers the empirical strategies, and Section 5 reviews results. Section 6 concludes.
2 Background and data
Despite a recent transfer of educational infrastructure to more than 300 local gov-ernments, Bolivia retains a relatively centralized public educational system, in which the Ministry of Education continues to hire all teachers and set the curriculum. At 100 percent, the primary gross enrollment rate is close to that in countries with comparable incorne lev-els. Drop out rates are still relatively high, however, and secondary enrollment ratios are therefore considerably below those of similar countries. Additionally, there is a widespread perception that for any given grade level, a substantial proportion of students is no where near mastery of the grade-appropriate skills.
In response, recent governments have embarked on reforms to improve quality and achieve further gains in access. As part of this effort, the Educational Quality Measurement System (SIMECAL) was introduced in 1993. This system has a testing progranm as its centerpiece, and is the main source of data for this study.5 Each year, SIMECAL focuses on one or two grade levels in a sample of schools that includes urban private, urban public,
4 See Finn and Achilles (1999) and Hanushek (1999) for recent reassessments of the STAR evidence.
and rural public institutions; private schools are very rare in the rural area of Bolivia, and are excluded from this sample.
In addition to gathering language and math test data on each student, the system collects information on his classroom and home background, as obtained from questionnaires administered to: the student himself, his teacher, the head of his household, the school principal, and in the case of rural schools, some community leader. This paper draws mainly on test scores and information collected from students and household heads.
Since its inception, SIMECAL has reached grades 3, 6, 8, and 12. The results presented below focus mainly on the 3rd grade, a choice made for three reasons:
1) Particularly in the rural area, Bolivia still has a schooling supply problem. In a sig-nificant proportion of small towns, schools offer only the first three or four elementary grades, so focusing on the lowest grade available increases coverage.
2) The fact that inputs have cumulative effects causes a well known complication in edu-cational production function analyses. Because the 3rd is the lowest of the grade levels
available, its test scores are less likely to be "tainted" by previous input availability. This complication also provides an argument for the focus on "small" rural schools that distinguishes one of the identification strategies proposed, since in these cases, between-year changes in enrollment and class size will tend to be small, so that the input of interest is more likely to have been held constant during students' careers. 3) As stated, relatively few students reach secondary education in Bolivia, and differential
drop-out rates could bias inferences on class size. This is naturally less of an issue at the 3rd than at the other available grade levels.
3 Empirical framework
and descriptive
statistics
Historically, developing countries have devoted great efforts to enhance their popula-tions' access to education. Over the years, however, papers such as Behrman and Birdsall (1983) and Case and Yogo (1999) have suggested that the returns to educational investments are not independent of school quality.6 The emergence of such results, combined with the perception that improving schools can help to eliminate remaining enrollment deficits, ex-plains why researchers have attempted to identify inputs that raise achievement, and why class size, one which policy can quickly influence, has received such attention.
As stated, significant controversy surrounds inferences on these effects, primarily be-cause the extent to which different students enjoy particular inputs is probably related to other characteristics that affect achievement. In the case of class size, recent literature sug-gests that considering how enrollment/class size and enrollment/SES correlations affect the analysis, is a useful way to think about such sources of bias.
6 These findings are similar to others that apply to high-income countries, such as those presented by Card and Krueger (1992).
Specifically, if enrollment and class size are positively related, and enrollment is in turn correlated with SES, cross-sectional studies will not reveal the causal effect of class size. Lavy (1995) and Angrist and Lavy (1999) emphasize this point for Israel, a-d note that an enrollment/SES correlation is also relevant in the U.S., as pointed out by Col3man (1966) and Hedges et al. (1994). They also suggest its presence may bias Akerhielm's (1995) conclusions. In the case of Bolivia, Mizala et al. (1999) use cross sectional evidence to suggest enrollment raises achievement, hypothesizing this may be due to economies of scale. This section illustrates one way these correlations arise and complicate inferer.,ces on class size in the case of Bolivia, and more generally argues they may be relevant in other developing countries. For this purpose, it is useful to note that most empirical work begins with the assumption, often dictated by data availability, that the jth class in school k has
size:
nk
where Ek is total enrollment in the school, and nk is the number of classes. For notational
simplicity, all these variables are assumed to be grade specific.
A first aspect to consider is why enrollment and class size would be related, since, if they are not, any additional enrollment/SES relation will not necessarily pose problems. The setting in which the clearest association arises is among sparsely populated rural lccations where schools may have only one 3rd grade, so that enrollment and class size are perfectly
correlated. This point is evident in Figure 1, which applies formula (1), plotting class size against enrollment for all schools in the sample. For very small institutions towards the left of the diagram, the two variables are identical. The figure also illustrates that a positive association remains over most ranges of enrollment, if only that which arises from conmiparing the small and larger establishments.
Beyond the factors that actually cause a positive enrollment/class size link, -.he key point here is that with this relation present, any additional enrollment/SES correlations will potentially bias inferences on class size. The simplest way to see how these can originate once again involves comparing relatively small and large schools. Because the former will generally be located in rural and the latter in urban areas, any welfare differences between these two realms will give rise to an enrollment/SES correlation. This aspect is relevant in developing countries, where for instance, income per capita is often significantly higher in urban centers than in sparsely populated rural areas.
Figure 2 illustrates this point using information on mothers' educational attainment. Specifically, the figure plots enrollment and the fraction of children in each class whose mothers completed less than five years of schooling, suggesting the following observations:
1) There is a concentration of rural public classes towards the left of the diagram, refecting the fact that they are more often in schools with low enrollments. In contrast urban classes, both public and private, are more evenly distributed.
2) A significant proportion of rural classes are in the upper part of the graph, indicating that relatively few of their students' mothers completed more than five years of school-ing. In contrast, classes from urban and particularly private institutions are more clustered towards the bottom of the figure, indicating children in these schools come from households with greater educational attainment.
3) To summarize these two points, the figure displays a negative linear relation suggesting that at least as measured by mothers' schooling, children in larger schools come from higher SES backgrounds.
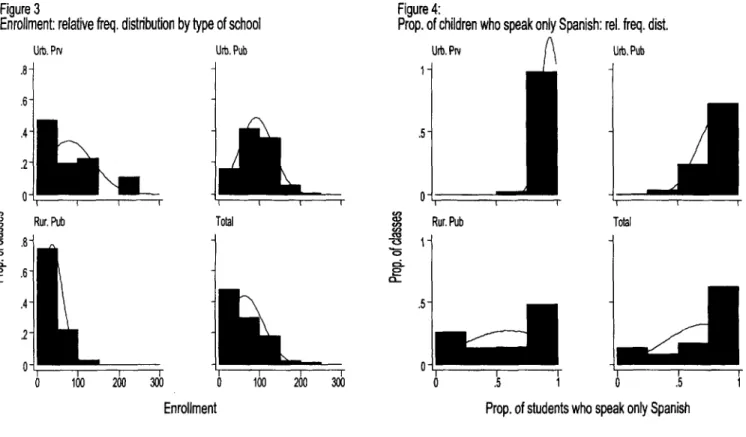
Using 3rd grade class-level data, figures 3 and 4 present an additional illustration of
enrollment/SES correlations. The first of these shows relative frequency distributions of enrollment by type of school. As expected, urban classes (the ones covered in the top two panels) display relatively normal distributions, with many schools having between 50 and 150 3 rd grade students. More than 70 percent of rural public schools, in contrast, have
enrollments below 50.
Figure 4 complements this information showing the distribution of the proportion of students in each class who declare they speak only Spanish. This is a relevant trait in Bolivia, where a significant percentage of the population still uses native languages with varying degrees of intensity.7 Although the current educational reform stresses multicultural education and a new bilingual testing system is in place, the tests considered here were administered in Spanish, and most instruction still takes place in this language. In general, furthermore, Spanish-only speakers display higher SES than native language users.
This figure shows that a significant majority of children in the urban area, particularly in the private sector, speak only Spanish, but that there is a greater prevalence of indigenous languages in the rural area. For instance more than one in three rural classes contains less than 50 percent Spanish-only speakers, while there are almost no such cases in the urban area. Combined with the information in Figure 3, this data once again suggests a positive enrollment/SES link.'
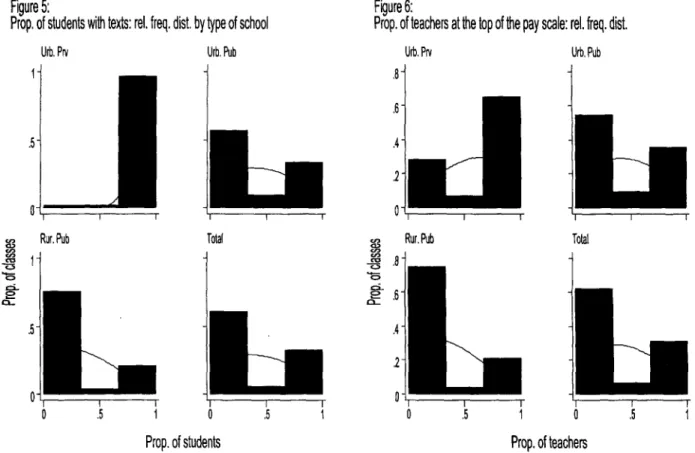
To summarize, figures 2-4 have shown that the enrollment/achievement correlations that Mizala et al. (1999) emphasize may arise not from economies of scale but from enroll-ment/SES correlations. Figures 5 and 6 suggest they may also reflect positive links between enrollment and the availability of "better" inputs beyond class size. To make this point, they focus on the distribution of the proportion of teachers who declare that more than half of their students have textbooks, and the proportion who are in the top three categories of the pay scale.9 Combined with the enrollment distributions previously displayed, these data
7 The two main indigenous languages are Aimara and Quechua. Alb6 (1995) estimates that slightly more than half of the entire population has some command of one of these.
8 It might seem surprising that simultaneously, Figure 4 suggests there is a significant proportion of rural classes where Spanish-only speakers are as prevalent as in the urban areas. This heterogeneity in the rural distribution partially reflects geographic variation, namely, the presence of schools from the eastern part of the country, where the prevalence of indigenous languages is low even in agricultural settings.
again suggest that children in larger schools generally enjoy "better" inputs.
The preceding examples have all motivated the existence of enrollnient/SES corrc,!ations as a reflection of rural/urban differences. These links may also arise withinr urbanl areas, however, if some schools are more "efficient" in the sense of being better able to ra: se test scores, and if, additionally, higher SES parents are better able to identify such instituttions. This type of "competition" effect, emphasized by Hoxby (1997) in the case of the U.S., may be important in Bolivia because the country has an "open" public educational systemn, so that admission to a particular school involves no residential requirements. 1 0 This detc rrnines that some public schools perceived to be better by parents, are oversubscribedl. To ili -strate, in the days surrounding admittance periods, a few schools in major Bolivian c(ities ha-;e some parents physically queuing up to several days to get their children elirolled. To the extent that higher SES or more motivated parents are the ones who engage in such behavior, this may also induce the mentioned enrollment/SES and enrollment/achievement correlai;ons.
These sorting and "competition" effects are probably reinforced by the availability of religious public schools, a trait shared with several Latin American countries. These in-stitutions are generally physically owned and run by a religious denominationl (mllost often the Catholic Church), but their teachers are supplied and paid for by the State. I.ke all publicly-funded schools, they do not charge direct fees. There is evidence they hav-! more effective incentive systems, that parents perceive them as better, and( they are on r verage oversubscribed more frequently than public schools without religious affiliations.
Regardless of the precise origins of the enrollment/class size and enrollment/SF S cor-relations this section has discussed, it is clear that in their presence it may be impossible to identify class size effects using cross-sectional variation. In particular. these links may bias estimates upward, suggesting this variable may have less of a negative effect than inight actually be the case. The descriptive statistics in Table 1 illustrate this point. Thi- table presents information on the whole sample of schools, and also on each type of institution:
urban private, urban public, and rural public.
A first point is the ordering of average test scores in both subjects: students in uirban private schools place highest, followed by those in urban public and rural public instit.itions.
As expected, the table also shows that urban and particularly private school students (lisplay "better" socioeconomic characteristics and enjoy "higher quality" inputs. The key point is that at the same time, average class size is highest in the urban private sector, followed by the urban public and rural public cases, so that a comparison of means would suggest larger
classes in fact produce better outcomes.
In this context, the fact that higher SES children are often in larger classes nma, seem surprising. It is important to realize, however, that the class size levels childreni expe':ience are the result of a complex decision process in which parents may consider not on fi this and formal qualifications. See Urquiola et al. (2000) for detail.
10 There have recently been attempts to introduce residential controls, but. anecdotal evi.deuice ijilicates these are either not enforced or ineffective.
variable's level (or even that of other educational inputs), but also aspects such as their children's peer group composition. If one adds to this the fact that schools have cost-related incentives to keep class sizes high, it is clear that no straightforward predictions on the relation betweein, say, inicome, and class size will be available.
To sunmmarize, the simple information presented in this section shows that biases arising from a combination of enrollrment/class size and enrollment/SES correlations will typically affect inferences about class size in countries like Bolivia. The following section introduces the empirical strategies used to deal with this problem, and to address the endogeneity of class size more generally.
4
Empirical
strategies
Miost work on class size begins from a reduced form specification which assumes that the test score T of an individual i in class
j,
school k, and town I is given byTijkl a a ,+c'Cjkl + XijklO, + XjklO,3 + Xkkl3k + Xd3X + Eijkl, (2)
where Aijkl is a. vector of studenits' socioeconomic characteristics, Xjkl denotes traits specific to given classes, such as teachers' qualifications, Xkl refers to school characteristics, and XI
stands for town-level variables, like population size (CIJkl is as defined in formula 1, page 6). The previous section illustrated that in any practical application, the X vectors are likely to exclude key characteristics that affect achievement, and being correlated with class size, will bias estimates of !c.
Another way of stating this is that while class size may be given simply by the ratio of enrollment and the number of classes offered, as in (1), in reality both of these are affected by socioeconomic characteristics:
Ckl = Eki(Xijkl, Xk, Xl eijkl) (3)
nkl(Ekl, Xijkl, Xkl, XI, Eijkl)
Placing these variables iIn the numerator of this expression makes explicit the possible en-rollment/SES correlations illustrated in the previous section. That they also belong in the denominator is evident in Figure 1 which shows that not only does class size vary with en-rollment, but schools with identical enrollment levels often choose to offer different numbers of classes, a decision which may naturally reflect traits like income levels.
Both (2) and (3) make clear that reliably identifying class size effects will necessitate experimental or quasi-experimental evidence. The previous section suggested that a way of thinking about this requirement is that one must have situations where either: i) class size and enrollment are unrelated, or at a minimum, ii) enrollment and SES correlations
are less prevalent than in the aggregate sample.'" This section argues that the institutional characteristics of educational provision in the rural area of Bolivia make these approaches feasible, and presents two empirical strategies that implement them, one at a time.
Before proceeding to these identification issues, however, it is relevant to mention a measurement problem. Boozer and Rouse (1995) emphasize that calculating class size by equation (1), as is actually done in this study and is illustrated in Figure 1, can result in bias. They illustrate this possibility by noting that some school districts in the U.S. have compensatory policies that place worse-performing students in smaller classes, so that using actual class sizes rather than some school average is necessary for accurate inferences.
This measurement problem is fortunately not a major issue in the present setting. First, the SIMECAL system provides both measure (1), collected from school officials, and the actual number of pupils teachers declare are in their classes. Figure 7 shows that these two measures are in fact very similar: most observations are very close to a hypothetical 45 degree line that would indicate they are identical. This is particularly the case amcng the rural schools that are the focus of this study.
This reflects that in Bolivia, schools often have only the number of teachers they strictly need to cover the grade levels offered. In the extreme, schools in smaller communitWes will have only one class per grade level, and will rarely have a principal or any administrative staff.12 As in many low-income countries, therefore, making subtle adjustments to actual class sizes, or offering compensatory education, will rarely if ever be in public schools' choice set. Additionally, the focus here is on primary education, where class size tends to be ,a more
clearly defined concept than in later schooling stages.13
If based on this logic one ignores the measurement problem, then C need not have a j or class subscript, and (2) takes the form:
Tijk1 = O + cCCkl + ± 1A + Xjkl/ + XkklO + XUlX + fijkl, (4) where class size, conditional on grade level, will depend only on the school students are in. This will certainly be the case in small institutions which have one class per grade. With this measurement issue aside, the following sections present the mentioned empirical strategies.
4.1 Teacher allocation patterns as an instrumental variable
Following Angrist and Lavy (1999), a first approach exploits the fact that teachers are allocated in a centralized manner in Bolivia. Under prevailing practice, when a given c istrict 11 SES and class size could of course still be correlated through mechanisms other than those operating through enrollment.
12 There will generally be a "district principal" who serves several small schools fromn a larger toAn. As
stated, the system is still relatively centralized, and these districts have little autonomy.
13 The data consistency displayed in Figure 7 also matters to the extent one may be concerned that
administrative data in developing countries is not reliable. Anecdotal evidence indicates that edu ational reform efforts have resulted in more accurate reporting in Bolivia.
can demonstrate one of its schools has more than 30 students per teacher in a given grade, it can apply to the Ministry of Education for another teacher, thus lowering the class size at that school (for the given grade) significantly. For now, the discussion assumes a situation in which this rule binds without exception, that is, districts always request a teacher, and one is always granted, when they reach a class size of 30. Further below, this section presents evidence on the extent to which this procedure actually binds.
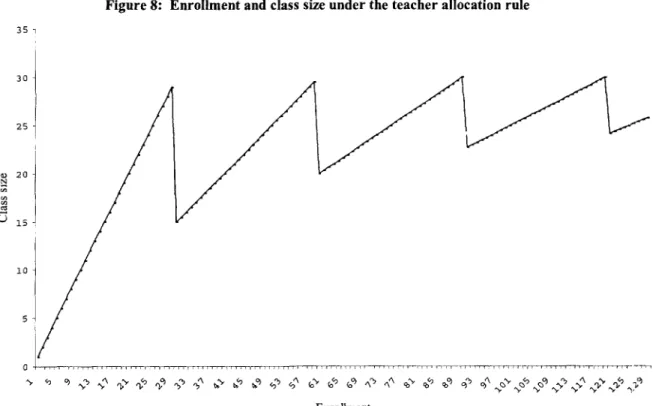
Mathematically, this practice determines that the number of classes a public school can offer, n*,, is a discontinuous function of its enrollment:
n*1 f f(Eki) k intEk<) . ( ~~Ekl- + 1+
Graphically, Figure 8 illustrates the impact of this regulation on the relation between en-rollment and class size. Up to 30 students, these two variables take on identical values; thereafter, (5) causes class size to fall discretely at enrollment intervals of 30 students.
In terms of an identification strategy, the relevant consequence is that if the teacher allocation procedure is always binding, equation (3) becomes
Ckl = Ekl (Xijkl, Xkl, Xi, Eijkl) (6)
nk,l
the key change being that neither X nor e now affect schools' choice of n. Graphically, this is seen comparing figures 1 and 8. When a rule like (5) applies, two schools with the same enrollment level will never have different class sizes.
This change does not succeeded, however, in eliminating X and e from the class size de-termination equation, since they still act through Ekl. Nevertheless, as long as achievement
and enrollment are "smooth" functions of these two variables, (5) still provides useful
varia-tion. The argument behind this, as put forth by Angrist and Lavy (1999), is an application of the quasi-experimental regression discontinuity design introduced by Campbell (1969), who analyzed how to identify the effect of a treatment variable (in this case, class size) as-signed on the basis of an observed continuous measure (in this case, enrollment), called the selection variable. Because the selection variable itself may be related to the outcome (e.g. through the enrollment/SES correlations described above), the treatment variable could be statistically related to the outcome even if the relationship is not causal.
The logic is that if enrollment is smoothly related to SES, observations in narrow intervals around discontinuities provide a quasi-experimental setting because the sample right above each "tooth" in Figure 8 should be very similar to the one right below. It is therefore plausible that any variation in their outcomes is caused by differences in the treatment variable. In terms of equation (4), using this rule involves utilizing (5) to instrument Ckt,
running a regression like:
where Ckl denotes instrumented class size, Ek,j is some "smooth" function of enrollment,
possibly ln(EkL) or enrollment itself, and the control variables have been combined into Xijki for simplicity.
To check how useful the mentioned teacher allocation procedure can be as an instru-mental variable, a simple first step is to observe whether average test scores, when plotted against enrollment, display an up and down "saw tooth" behavior inverse to thal which characterizes the class size function in Figure 8. In the case of Israel, for instance, Angrist and Lavy (1999) show that this is clearly the case, pointing out it is difficult to attribute such behavior to anything but the variation in class size induced by the class size ru]e they use in that context.
For the present data, this exercise is shown for the rural area in Figure 9. For reasons discussed later in this section, the teacher allocation procedure described is not binding in urban areas. The top portion of this illustration graphs average actual and predicted class sizes by enrollment levels, and the bottom plots averages of math and language scores, also by enrollment levels. The figure suggests several observations.
First, the actual does not always track the predicted class size. Rather than starting to assign new teachers at grade-specific enrollment levels of 30, the data suggest authorities seem to wait until about 38 students, which may reflect resource constraints. This also illustrates that the teacher allocation mechanism reflects practice rather than a legally binding rule. There are aspects that reflect a commitment to implicitly limiting class sizes, however. For instance, the Social Investment Fund, the agency in charge of building schools in the rural area, explicitly designs its classrooms for 30 students. This guideline, mandated by the Ministry of Education, is also observed by the main Non-Governmental Organizations active in school construction.
What is important for the purposes of this paper, is that at a given level (about 38 stu-dents) actual class sizes seem to drop for most schools, i.e., by enrollments of 40 most schools have been assigned a new teacher, creating the clear discontinuity observed in this range. The absence of a discontinuity would be evidence that teacher allocation is more endogenous than the straightforward application of a teacher allocation rule would suggest. The fact that not all new teachers are assigned at exactly the same enrollment level, nevertheless, makes it impossible to completely discount biases. Additionally, some further "spikes" observed at greater enrollment levels may also be a cause for concern.
There is another perhaps clearer discontinuity at about 65 students, but beyond enroll-ments of about 72 students the teacher allocation rule ceases to predict class size effectively.
The greater variability observed in part reflects smaller sample sizes in this data, but may also be due to the fact that towns with such enrollment levels begin to become more "ur-ban". Considering the rural area as a whole, nevertheless, the described teacher allooation procedure is a relevant practice which accounts for 40 to 50 percent of the variation in class sizes, an explanatory power similar to that observed in the Israeli case.
small relative to those used in other studies, the figure displays a suggestive pattern generally inverse to that observed for class size. In the first segment, that which covers enrollment levels from zero to about 38, there is a clear negative relation between test scores and class size. Much of this arises from the small rural schools that are the focus of the next identification strategy, so a more complete discussion of this evidence is postponed.
More importantly for the current research design, at almost the precise level where the teacher allocation rule causes class sizes to fall discretely, test scores jump abruptly. Al-though the behavior of scores between the two discontinuities is more erratic, the overall pattern is still suggestive of an inverse relation. Additionally, test scores jump again at about the enrollment level (66-68 students) where there is another discrete reduction in class sizes. Beyond this last enrollment level, test scores begin to decline again with enrollment, al-though not as clearly as in the previous segments. This may partially reflect enrollment/SES correlations that begin to become more important as towns become larger and more urban, an aspect further discussed below. A final point is that the behavior of both tests is rather similar, which is not always a feature of studies that cover more than one subject score.
As mentioned, this identification strategy focuses only on the rural area, Although excluding the urban realm eliminates a significant part of the sample, this restriction is necessary because the practices described do not bind in this case. This much is already evident in the descriptive statistics presented in Table 1, which show that the mean class size in urban public schools is close to 36 (with a standard deviation of 6), a level that is inconsistent with a similar rule's application. The mean class size in the rural area, in contrast, is 23 students, with a standard deviation of 8.
The are no immediately apparent reasons for this asymmetry in the allocation of teach-ers, or for the between-area differences in per pupil expenditures it implies."4 Nevertheless,
the following points are relevant to an explanation:
1) The existence of sparsely populated rural areas implies that educational authorities must necessarily be willing to tolerate lower class sizes in this segment in order to achieve given target national enrollment ratios. While this helps explain the urban-rural differences in average class sizes, it does not account for why the teacher allocation guidelines would be differentially enforced.
2) As indicated, Bolivia has an "open" public school system, so that admission to a par-ticular school involves no residential requirements. This makes urban enrollments hard to predict and may render any rule hard to apply, even if that is what the educational authorities wanted to do.
3) The fact that the mean urban class size is significantly larger than 30, however, calls into question whether authorities actually pursue this goal, which may in turn have to do with resource constraints that have different implications in each area.
4) Specifically, the kinds and costs of teachers the Ministry assigns to each area are
dif-14 As in many developing countries, the majority of Bolivia's education budget is devoted to salaries, so
ferent, which may explain its apparent greater willingness to spend on teachers and implicitly enforce an allocation rule in the rural area. Differences in the types of l ,achiers are relevant because there is a shortage of certified instructors. Because this sitLation is most acute in rural regions, regulations allow authorities to appoint "interin" teachers in these areas. These are individuals who do not have a teaching certificate, and will often not have finished high school. In many cases, they are natives of the conmunity they serve. All these traits determine they are also at the bottom of the national pay scale, and are therefore more available and less expensive than the certified instructors authorities more often assign to the urban area.15
Combined, these factors may explain why teacher allocation seems to be more systeriatic in the rural area, and why the average class size is lower in this realm.
In sum. this figure suggests than an instrumental variables approach like that suc-,gested b)y (7) may produce results different from those observed in conventional OLS specifieations. These are presented in Section 5 below, where the the allocation rule used is thalI which effectively binds, with a discontinuity at about 38 students.
4.2
Focusing on small towns
As Angrist and Lavy (1999) point out and Hoxby (1999) emphasizes, the IV approach suggested by (7) may be appropriate only at the discontinuLities induced by a given class size rule. Regarding the present data, this implies the strategy may only be valid wheni considering observations within some narrow interval of the enrollment levels thaL cause abrupt drops in class size, since it is only around such discontinuities that any "smooth" enrollment/class size link is really severed. Actually implementing this adjustment, however, is likely to cause the loss of many if not most observations in cross-sectional data sei,s.
Nevertheless, to the extent that the research focus is on rural schools, it may nct mnake sense to consider only the variation within such bands. Specifically, there may be valuable information in the observations up to the first "tooth" of the enrollment/class size retation,
when that arises from towns so small as to have a single public school with only one c':ass per grade. Such communities will be referred to as "small towns" in the subsequent disc ssion,
and their value in this setting arises from a number of observations:
1) Given the teacher allocation procedure and prevalent educational supply restrrctions, public schools in these locations have a monopoly on formal schooling, and parents essentially have no choice between institutions or classes. This reflects that private schools are very rare in the rural area and, when they exist, are almost always l,o)cated in large towns that can support a religious institution alongside one or more public ones.
15 There are also "interim" instructors in cities, but their prevalence is much low-er. This reflects -he fact that most teachers seem to prefer to live in cities, and that those that have degrees have greater c!joice on their geographical assignment.
2) The statement that parents cannot exercise choice must be qualified because they could always move in reaction to an observed class size. While this is possibly an important concern for Hoxby (1999) given the mobility and proximity that exists between U.S. school districts (particularly in a small state like Connecticut), and for Lavy (1999), given the population density and relatively small area of Israel, it may be less of an issue in rural Bolivia. In this case, migrating does not imply switching areas of residence while possibly keeping the same job, but may require attempting to sell land on which there are often no clear property rights, and moving to a relatively distant location, an aspect that is reinforced because schools are generally few and far apart. This motivation is similar to that used by Case and Deaton (1998), who exploit
Apartheid-imposed mobility restrictions to identify resource effects in South Africa.
3) Because schools in small towns clearly do not qualify for additional teachers, school offi-cials will have almost no latitude to alter class sizes or "campaign" for more instructors. This may be an important advantage relative to the previous strategy, particularly if one is concerned about possible manipulations of the teacher allocation rule around the discontinuity-inducing enrollment levels.
In light of these observations, the class size a student in a small town experiences will be almost solely determined by his or her cohort size. In terms of Angrist and Lavy (1999), this
is a situation where the assignment and treatment variables are one and the same, but may nevertheless have some relevant exogeneity characteristics. Formally, this approach entails
running an OLS regression of the form:
Tijkl = Ci + ICCkl + Xijkl 3X + 3E*Ek,J + Eijkl, where 0 < EkI < 31. (8)
where the focus on small rural locations leaves little room for biases arising from within or between-school differences in a given community. Following what would be a strict applica-tion of this rule, this specificaapplica-tion calls for placing the cutoff at 30 students, while Figure 9 could be interpreted as arguing for a higher cutoff, perhaps around 38 students. The results below use the lower benchmark, but were not found to be sensitive to this choice; if any-thing, the key coefficients are more significant with a higher cutoff point. The lower cutoff was used, however, because as discussed further it makes it more likely that small towns (with only one class per school and one school per town) are being selected.
This use of between-town variation, of course, does not eliminate all possible sources of bias. Even in this small town sample, larger locations will tend to have larger cohorts, enrollments, and class sizes. Additionally, these could systematically attract better or worse teachers than smaller ones. To express this point formally, note that under the above argu-ments, class size will be given not by (3) but rather by:
C l= '(XI 61). (9)
class and one school in each town indexed by 1. Class level characteristics, Xkl. have been eliminated for the same reason, whereas the absence of student and parental traits, kijkh reflects the assumption that parents can no longer influence achievement through their choice of school. The presence of Xi, however, indicates that inter-town heterogeneity coLNd still bias inferences if it is correlated with factors that affect achievement. This is anot.-ier way of stating that there could still be enrollment/SES/achievement correlations, eve.r] if the
enrollment variation arises from differences in towns' sizes rather than differences between schools. While this is certainly possible, the results below suggest that the biases that arise from this are probably less severe.
4.3
Combining
the allocation
rule and the focus on small towns
If the above arguments hold and the variation among small towns is meaningful, a logical extension is to combine the two previous research designs. In this case, the t;trategy focuses only on rural schools with enrollments less than or equal to 30 (those in small towns), on the one hand, and on those with enrollments within narrow bands of levels that trigger discontinuities in the enrollment/class size relation, on the other. This reflects that having small town schools as a base provides a sample size large enough to then restrict the remaining observations to those which provide "higher quality" variation. Specifically, the approach in this case is,
Tiikl = a + fC(Cki + Xi,kjlx + 3E Ek*j + eijkl, where 0 < EkI < 45 or (10)
63 < Ekl < 68
and the instrumental variables technique binds only for schools with enrollments greater than 30. In practice, the results were not found to be significantly sensitive to the exact placement of these cutoff points.
The next section presents results on these identification strategies. It also l'eatures brief evidence on a couple of additional methods that address sources of endogeneAty the two approaches discussed here do not. Because these are not central to the parer, the methodological details are briefly discussed within the results section itself.
5 Results
For comparison purposes, this section first presents results that apply to all schools considered, including those in the urban samples. The regressions then implement the iden-tification strategies described in the previous section, which, as stated, focus only cn rural area schools.
5.1
General results
To introduce results on class size and enrollment, Table 2 presents simple cross sectional specifications for the full sample and each type of school: urban private, urban public, and rural public. Panel A has class size as the key independent variable. In this case, column 1 suggests larger classes in fact produce higher test scores, a statistically significant result which is not surprising given the correlations discussed above. Such a positive point estimate is also observed among urban private schools in column 3. When column 2 focuses on the full sample and adds dummies for whether schools are in the private sector or the rural area, the coefficient on class size becomes negative and significant. The result is even greater in magnitude when the regression considers only public schools in columns 4 and 5. The signs of all coefficients are the same in panel B, except that the focus is on enrollment as the key independent variable. As expected, the results suggest enrollment positively affects achievement in the aggregate sample.
Before proceeding to the rural-only results, Table 3 makes the point that results in all areas behave in a manner consistent with Hanushek (1995). This table once again considers the full sample, urban private, urban public and rural public schools. For each of these groups, the first regression simply replicates the corresponding simple specification observed in Table 2. The second one adds a number of socioeconomic controls, which have the effect of lowering the coefficients on class size and rendering them insignificant at the 5 percent level. 16
The socioeconomic control variables, in contrast, almost always have effects in the ex-pected direction and are highly significant in the aggregate sample. Students who are native Spanish speakers have higher scores; working tends to lower performance, and mothers' schooling to improve it. Two characteristics, whether households have access to sewerage and phone connections, turn out to be highly significant, perhaps because they proxy for income and urban status.
5.2
Rural area results:
the teacher allocation
rule
With these introductory results as a benchmark, the remainder of the regressions focus on different subsets of rural schools only. Additionally, while the previous results covered only language test scores, the subsequent cover math as well. Introducing the use of the teacher allocation rule and following Angrist and Lavy (1999), Table 4 presents reduced form equations which use the predicted class size, computed using the class size function, as the key independent variable, where this was assumed to entail the introduction of another teacher when enrollment reaches 38 students. While this precise level is arbitrary and point estimates display some variation, none of the conclusions listed below are sensitive to placing
16 Although the analysis here centers on class size, using the same data Urquiola et al. (2000) find that in cross-sectional settings, most conventional educational inputs like teacher's experience and textbook availability, cannot be shown to have any systematic effects on test scores either.
the critical level at 37 or 39.
Column 1 contains a first stage regression, where the dependent variable is the actual class size. Not surprisingly, the coefficient of interest is highly significant, and even in this simple specification, R2 is above 0.5. If class-level observations are used instead, R2 is about 0.44, a level comparable to that found for Israel by Angrist and Lavy (1999), who also use data at this level of aggregation. Using class level observations produces class size effects which are greater in magnitude, for reasons discussed below. To take advantage of the more detailed data, however, almost all the results presented here are at the individual level, with standard errors adjusted for clustering at the class level.
Columns 3-6 present analogous specifications, except that the dependent variables are now language (columns 3 and 4) and math (columns 5 and 6) scores. The coefficients are significant in all cases, and their magnitude is always greater than that observed in the "simple" OLS regressions in Table 2. Importantly, adding socioeconomic controls does not alter the coefficients on class size as much as was the case before, and does not render them insignificant. An exception is the final specification for math scores, where the estinmate is only significant at the 10 percent level. In contrast, the socioeconomic controls are not as important in this setting, which in part may reflect smaller variances for these variables within the rural area.
Table 5 presents the actual instrumental variables results, based on the first stage regres-sion presented in Table 4. For comparison, columns 1-2 (language) and 5-6 (math) present simple OLS specifications. For each test score, the table features two IV regressions. one without control variables, and one that includes enrollment and socioeconomic characteris-tics. For both tests, and in the simplest univariate specifications, the coefficients on class size are negative and significant in both the OLS and IV regressions. When control variables are added, however, the significance in the OLS case is lost, whereas the IV coefficients not only remain significant but become greater in magnitude, suggesting larger classes result in lower achievement. Once again, for the case of math this is only true for the 10 percent level. Similar results emerge when other specifications of enrollment, such as its log, are used among the control variables.
As stated above, the use of the teacher allocation rule is based on the argument that it "separates" the effects of enrollment and other socioeconomic characteristics from those of class size, making it feasible to estimate the causal effect of the latter. If this strategy indeed identifies exogenous variation, these results confirm the assertion that simultaneous enrollment/class size and enrollment/SES correlations cause bias in the usual cross-sectional estimations, hiding a negative and significant class size effect.
5.3
Rural schools: focusing on small schools
In an earlier section, this paper argued that concentrating on "small" towns, those with a single school and 3rd grade enrollment below 30, might identify useful variation in class
size. In these cases, short of making what might be a rather costly move, parents cannot react to a class size level that arises from the size of their child's birth cohort, and schools are not large enough to be candidates for a supplementary teacher.
Table 6 presents results for this sample. Because this strategy does not rely on an instrumental variables technique, the table covers OLS results only. For each test, the first two columns present estimations on the whole rural sample as a benchmark, and the following two focus only on schools with enrollments less than or equal to 30. The coefficients on class size are uniformly significant in the "small town" sample, and in contrast to all other samples in OLS specifications, their magnitude is barely affected by the introduction of socioeconomic controls.
In short, the key finding here is that class size has a negative and significant effect among rural schools in small towns, and that this may be because enrollment/SES correlations are less important in this context. This may not be surprising to the extent that one would expect enrollment/achievement links to be less significant when they arise from differences in towns' population sizes rather than from parental choice. Additionally, of course, the magnitude of small towns' enrollment cohorts will not be determined just by their size, but also by a random element. This point is explored in greater detail in a subsequent section.
The sample considered in making this finding is, of course, different from the one used earlier, and even if the identification strategy does isolate useful variation in class size, these effects might be biased up or down relative to those that would prevail if such variation were identified for, say, a random sample of the urban population.
5.4
Rural schools: combining
small schools with discontinuities
A natural extension is to combine the two sources of variation used so far: that arising from the focus on "small" schools, and that related to the use of a class size rule. Because the former sample provides an adequate base from which to build, the latter can be restricted to only those schools within narrow intervals associated with discontinuities in the enroll-ment/class size relationship. In a sense, this adds only the "higher" quality variation from
the IV strategy to the data from the "small" schools approach.
To this end, Table 7 implements regression (10) for language and math scores. For comparison, in each case the first two columns present OLS regressions for this sample, with the remaining two focusing on IV specifications. In the latter, the coefficients on class size
become more negative and significant than those in Table 6, which applied to small schools only, or Table 5, which presented the IV results. One point these comparisons suggest is that the significant effects found among the small schools, a very particular set of institutions, might not necessarily be overestimates of those one would observe in larger institutions.
5.5
Possible sources of bias and further results
The results presented thus far consistently suggest that once strategies to address the endogeneity of class size are put into place, this variable is found to have negative effects on achievement. These approaches obviously do not substitute for experimental evidence, and will therefore still leave open routes for bias. This section discusses some of them and, where possible, presents some empirical exercises that provide information as to their importance.
5.5.1 Geographical influence areas and school quality
Up to this point, the discussion has assumed that rural schools are located in and draw students from towns. Among rural schools, however, the realm from which enrollment originates will often encompass a larger, sparsely populated agricultural area from which children walk to school each day. One reason this matters is that as the distance to school becomes greater, there may be households who deem their children's trip worthwhile only if the education offered is at least of a given quality. Additionally, even though schools tend to be far apart, one cannot rule out the existence of children who live at the margin of two schools' areas of influence, whose parents could therefore send them to the one they perceived to be better. This implies that even in rural areas with theoretically little scope for choice, schools' enrollment and class sizes, therefore, may actually be a function of their performance on standardized tests.
While this is a relevant issue, it is important to note that such an effect would tend to bias the estimated class size effects upward, making negative and significant results like those observed here harder to encounter. An indirect test of this issue involves augmenting the above regressions with some variable that might capture quality and "school effects" more generally. One possibility is to take into account the fact that schools that have a 6th
in addition to a 3rd grade might be of higher quality. This could be due to the fact that
the institution may be older and have more experience, or that the district principal or local teachers have been more effective in "lobbying" for the provision of additional instructors and infrastructure. This idea was implemented by adding a dummy for 6th grade availability to
some of the above regressions. While the coefficient on this variable is sometimes significant, it does not have a consistent sign and barely affects the key class size estimates.
5.5.2 Inter-town differences
Another way to deal with this problem is to focus only on the part of enrollment variation that is due to differences in cohort sizes between years, within towns. Despite the fact that this significantly restricts the variation in class sizes, it may allow further controls for any enrollment/SES correlations that remain in comparisons between small towns. For instance, it would seem unlikely that teachers with given characteristics would not want to live in small towns to teach 3rd grade, but would not mind teaching 6th grade in them.
students in 3rd and 6th grades will come from the same households, though the data does
not allow one to identify these links.
This approach is similar to that used by Hoxby (1999). The problem it poses in the present context is that repeated observations are not available for the same grade in the same town. Analogous variation, however, can still be obtained if one focuses on cross-cohort differences between the 3rd and 6th grade, both grade levels covered in the data.'
7 The main disadvantage of this approach comes from the possible presence of differential drop-out rates that can bias results in unpredictable ways. Towns with better schools, for instance, will be those in which children tend to remain in school and reach the sixth grade. All else equal, such schools will probably have higher scores than those in which students tend to drop out, but they will at the same time have larger class sizes. On the other hand and in comparison to "high drop out" areas, they will also be retaining a larger proportion of poorly performing students.
Implementing this strategy requires selecting only "small" towns that contain schools that offer both 3rd and 6th grade instruction, which unfortunately further restricts the sample.
Additionally, both the 3rd and the 6th grade must have less than 30 students. Table 8 presents
the results for this approach, focusing only on language scores and using observations at the class level. Columns 1-3 present regressions without socioeconomic controls, while columns 4-6 incorporate these. Within each group, the first regression contains only class size as the key independent variable. In order to capture constant differences between the two grades' average scores, the second adds a dummy indicating whether the observation is at the 6th
grade level. The coefficient on this dummy is uniformly positive but not significant. Finally, the third column within each group adds town dummies, with which the results rely only on within town, cross-cohort variation in class sizes. The final specifications do suggest negative and significant effects.
5.6
Interpretation
Perhaps due to the controversy that surrounds this input, most work on class size focuses on the direction and significance of its effects. From a policy perspective, of course, the magnitude of any potential gains from class size reduction is what matters. To address this issue, some papers use a measure called the effect size: the implied change in test scores that results from a given change in class size, divided by the standard deviation of the
score. Using a one standard deviation change in class size, the above tables have presented this statistic in brackets. Finn and Achilles (1990) point out that the effect size will not be independent of whether individual or class average observations are used for test scores. Because the variance in the former is naturally greater, studies which use individual level observations will tend to find smaller effects.
17 Forthcoming data will include also include 1st grade results. To the extent that these can be linked to
the schools from which these 3rd and 6th grade results were drawn, this will allow a further check on these
Table 9 summarizes the effects found in this paper, comparing them with some encoun-tered in previous research."8 The first two rows show the effect sizes found by Finn and Achi11Ws (199!) for the STAR experiment, and Angrist and Lavy (1999) for the case of Israel. Both of these refer to the proportion of a standard deviation change in test scores that would be caused by an eight pupil reduction in class size. Both results display the same orders of magnitude, although the Israel results are towards the lower limit of the STAR range.1 9
The remaining rows present the effect sizes found in this study for the two identification strategies, and for their combination. This study has used "one standard deviation" effect sizes which are not strictly comparable to the "eight student reduction" ones presented for Finn and Achilles (1990) and Angrist and Lavy (1999). Nevertheless, because one standard deviation corresponds to between eight and nine students in the rural data (see Table 1), the interpretation is similar. With this caveat, the table shows that the IV results produced here are slightly larger than those found by Finn and Achilles (1990) when the student distribution is the benchmark, but within their range when the class-level standard deviations are used instead. The small school estimates are not as large, and are therefore closer to those found for Israel.2 0
This table gives a general notion of how the estimates presented compare with others. A more intuitive interpretation is possible by comparing the suggested class size impact with that which parental education implies. To illustrate, suppose class sizes in rural Bolivia were reduced by half a standard deviation, from about 23 to 19 students. The impact on test scores Table 5 suggests is roughly similar to that suggested by the dummy for whether the
mother is a high school graduate.
This is a significant impact, an aspect consistent with Moesteller (1995), who emphasizes that even if effect sizes seem small, they can be equivalent to substantial movements along the test score distribution. For instance, a 0.30or effect size in the case of rural schools would mean that an eight student reduction in class size would be sufficient to move a student from the 25th percentile to the median of the language test score distribution for the entire sample.
A further consideration is that especially at the grade level considered here, higher test scores may reflect the acquisition of skills less "marginal" than those measured in developed countries. Specifically, adequate performance in the language test at the 3rd grade level may
reflect a Bolivian rural student is about to acquire the literacy skills requisite for effective citizenship in a Spanish-speaking society. This aspect also suggests some caution in reading the comparisons presented in Table 9.
18 This table is partially based on Angrist and Lavy's (1999) discussion of these topics.
'9Krueger (1999) presents generally similar results for the STAR data.
20 Akerhielm (1995) and Boozer and Rouse (1995) present higher grade results based on NELS for the U.S. Angrist and Lavy (1999) point out that the magnitude found by these authors is nevertheless also relatively close to theirs.