Schooling is Associated not only with Long-run Wages,
but also with Wage Risks and Disability Risks:
The Pakistani Experience
ASMA HYDER and JERE R. BEHRMAN*1. INTRODUCTION
Many studies document significantly positive associations between schooling attainment and wages in developing countries [see the reviews in Psacharopoulos (1985, 1994); Psacharopoulos and Patrinos (2004)]. Based in part on these associations, there has been widespread advocacy for increasing schooling in developing countries to increase productivity and income and, if targeted towards poorer households, reduce poverty and inequality.
But when individuals enter occupations subsequent to completing their schooling, they not only face an expected work-life path of wages, but also other occupational characteristics, including wage risks and disability risks, for which there may be compensating wages differentials. This has been recognized in some of the recent (as well as older) literature on schooling and labour markets in developed economies. Christiansen, et al. (2006), for example, estimated the risk-return trade-off for different schooling attainment and types of schooling based on the Danish Labour Force Survey and identified “efficient” and “inefficient” (inferior based only on risks and returns) schooling combinations. Tuor and Backes-Gellner (2010) used the Swiss Labour Force Survey to estimate risk and returns for different types of schooling paths—all leading to a tertiary degree—by distinguishing among a purely academic path, a purely vocational path and a mixed path with loops through both systems, with entrepreneurs separated from employees in order to examine whether for the same schooling the labour market outcomes differ between these two groups. Their empirical results suggest that mixed schooling paths are well-rewarded in the Swiss labour market and for entrepreneurs high returns are associated with high income variance. Diaz-Serrano and Hartog (2006) used the 1995 Spanish Encuesta de Estructura Salarial (Salary Structure Survey) of 1995 to estimate the earnings variance and skewness and found compensating wage differentials for schooling as a risky investment. There are studies which have employed cross sectional data for finding risk as the dispersion of earnings [for instance McGoldrick
Asma Hyder <[email protected]> is Assistant Professor, Karachi School for Business and Leadership, Pakistan. Jere R. Behrman <[email protected]> is William R. Kenan, Jr. Professor of Economics and Sociology and a Research Associate of the Population Studies Centre at the University of Pennsylvania, Philadelphia, USA.
(1995); McGoldrick and Robst (1996)]. Low, Meghir, and Pistaferri (2008) specify a structural life-cycle model of consumption, labour supply and job mobility in an economy with search frictions that allows them to distinguish among different sources of risks (shocks to productivity, job destruction, processes of job arrival when employed and unemployed and match level heterogeneity) and to estimate their effects and the impact of alternative governmental policies to mitigate risks.
However there is very little evidence in the literature on the associations between schooling attainment and these risks characteristics of occupational choices in developing country contexts, where labour markets may operate much differently than in more developed economies due to, for example, different degrees of mobility and labour market segmentation. The present paper contributes to the literature on developing country labour markets by estimating the associations between schooling and wage risks and between schooling and disability risks in addition to those between schooling and expected wages. These estimates are conditional on the maintained assumption that individuals enter broad occupational categories in specific geographical locations subsequent to their schooling and there is relatively little subsequent mobility. Data on workers in the most recently available six rounds of the Pakistan Labour Force Survey with 77,685 observations are used for the empirical analysis. The occupational and regional categories used are broad so that, in the context of Pakistan, the assumption of limited mobility seems warranted.
The rest of the paper is organized as follows. Section 2 describes the key data from the Labour Force Surveys used in this study. Section 3 discusses how wage risks and disability risks are defined. Section 4 presents the results. Section 5 concludes.
2. DATA
We use pooled data from the six most recent available cross-sectional nation-wide Labour Force Surveys of Pakistan for the years 2001-02, 2003-04, 2005-06, 2006-07, 2007-08 and 2008-09. The Labour Force Survey of Pakistan is conducted by the Federal Bureau of Statistics (FBS), Islamabad. The FBS1 collects data throughout the country from all rural/urban localities in four provinces of Pakistan based on the 1998 Population Census, excluding the Federally Administered Tribal Areas (FATA) and the military restricted areas. The population of these excluded areas constitutes about 2 percent of the total population.
The analysis includes 77,685 observations on individuals of working-age (10-65 years)2 involved in any economic activity in these six surveys for whom we have data on the critical variables for the analysis. The variables for each worker include wages, hours worked, work disability, occupation, residence (in urban or rural area and in one of the four provinces), schooling attainment, gender and age. Table 1 gives summary statistics
1The FBS uses a stratified two-stage random sample design for data collection. Each area is divided into urban and rural domains. The enumeration blocks for urban domains and village/mouzas/dehs for rural domains are considered as Primary Sampling Units (PSU). The listed households of sample PSUs are taken as Secondary Sampling Units (SSUs). A specified number of households (i.e., 12 from each urban sample PSU, 16 from each rural sample PSU) are selected with equal probability using a systematic sampling technique with a random start.
2The Labour Force Survey of Pakistan collects data on economic activity for those above 10 years of age. Only 1.4 percent of the observations in the data that we use for our analysis below is in the 10-14 age range. Our estimates do not change substantially if these individuals are excluded.
Table 1
Summary Statistics
Variables Categories Means/ (S.D)
Age (Years) 33.8
(11.6)
Ln Monthly Wages 8.26
(.78)
Ln Hourly Wage Rates 2.95
(.85)
Hours Worked Per Week 49.4
(12.2) Disability Risks 1.3 (11.9) Male 89.6% Rural 40.3% Province Punjab 44.3% Sindh 28.2% Khyber Pakhtunkhwa 14.7% Balochistan 12.8% Schooling Illiterate 22.0% Primary (7 grades) 15.7% Middle (9 grades) 11.3% Matric (11 grades) 19.5% Intermediate (13 grades) 11.3% Graduation (15-16 grades) 13.4%
Above Graduation (more than 16 grades) 6.8%
Occupations Managers 6.4%
Professionals 6.4%
Technicians and Associate Professionals 19.1%
Clerical Support workers 7.2%
Service and Sales Workers 15.4%
Skilled, Agricultural, Forestry and Fishery Workers
1.5%
Craft and Related Trade Workers 14.5%
Plant and Machine Operators, Assemblers 9.7%
Elementary Occupations 19.5%
Total Number of Observations= 77685
for these data. The mean age is 33.8 years. The sample is predominantly male (89.6 percent), reflecting the very limited female labour force participation rate in Pakistan. Durrant (2000) discuss that mostly females in Pakistan are not economically active and even if they are active their work is largely unpaid and hidden. Ahmed and Azim (2010) also conclude that probabilities of women in Pakistan to be economically active become low special after marriage and traditional culture is the main reason for low economic activity at women’s part. Occupation is defined according to the International Standard Classification of Occupations
(ISCO) at the level of nine categories. The highest proportions of workers are in elementary/unskilled occupations (19.5 percent), technicians and associate professionals (19.1 percent), service and sales workers (15.4 percent) and craft and related trade occupations (14.5 percent). There are seven schooling categories, with 22 percent illiterate having less than primary education and 11.3-19.5 percent in the five categories ranging from completed primary education (seven years) to graduation (15-16 years) and a smaller proportion (6.8 percent) having attained the post-graduate level.3
3. MEASUREMENT OF WAGES RISKS AND DISABILITY RISKS We assume that subsequent to schooling, working individuals enter into one of 144 labour market groups defined by occupation, gender, urban/rural, province and gender (144 = 9 occupational categories * 2 gender categories * 2 urban/rural categories * 4 provinces). We use these groups to define the wage risks and the disability risks that the individuals face upon entering into one of these groups subsequent to schooling. That is, we assume that the residuals in relations that we estimate below are, from the point of view of individuals, short-term random shocks, not persistent longer-run factors. To the extent that there are long-run persistent factors known by individuals, our procedures may result in overestimates of the actual risks, but with the time series of cross sections that we have we are not able to explore such a possibility.
Wage Risks: To estimate the wage risks we use the standard deviation of the residuals in a wages4 (or earnings) equation for each of the 144 groups defined above. To do so, we first estimate ln wages relations with right-side variables for nine occupational dichotomous variables, one gender dichotomous variable, one urban/rural dichotomous variable, three provincial dichotomous variables, age, age-square5 and
3According to the Pakistan Education Statistics Pakistan follows three tier education systems which include Elementary Education (8 years), Secondary Education (4 years) and Higher Education (4 years). There are two scenarios in case of higher education either go for two year graduation degree (BA/BSc) then later on two year masters degree (MA/MSc) or four year professional degree in Engineering, Computer sciences, Business Administration etc. In case of degree in Medical science there are 5 years. In case of PHD there are five more years of study after 4 years of higher education. According to the National Education Policy enrolment of students is the lowest in elementary level of education in Pakistan as compared to other reference countries including India, Bangladesh, Thailand, South Korea, Malaysia and Iran. Pakistan spends relatively less in education in terms of GDP (2.3 percent) as compared to the countries like Iran (4.7 percent), Malaysia (6.2), Thailand (4.2 percent), South Korea (4.6 percent), India (3.8 percent), and Bangladesh (2.5 percent). It further tells that on the Education Development Index, which combines all educational access measures Pakistan lies at the bottom with Bangladesh and is considerably below in comparison to Sri Lanka. A similar picture is presented by the gross enrolment ratios that combine all education sectors, and by the adult literacy rate measures. The overall Human Development Index (HDI) for Pakistan stands at 0.55, which is marginally better than for Bangladesh and Nepal but poorer than other countries in the region. Although Pakistan’s HDI has improved over the years but the rate of progress in other countries has been higher. Bangladesh, starting at a lower base has caught up, while other countries have further improved upon their relative advantage. These developments do not augur well for Pakistan’s competitive position in the international economy. As the Global Competitiveness Index (GCI) shows, Pakistan’s performance is weak, on the health and education related elements of competitiveness, when compared with its major competitors like India, China, Bangladesh, Sri Lanka and Malaysia.
4Wages used in the paper are real wages. The nominal wages provided in the Labour Force Surveys are deflated by the consumer price index provided by the Ministry of Finance, Government of Pakistan (Economic Survey of Pakistan 2009-10, Chapter 10).
5Age-sqaure is used as a proxy for experience; this proxy has been widely used in literature. [For example: Serrano, et al. (2003); Danny and Harmon (2007), Harmon, et al. (2001)].
interactions of all the other variables with age and age-squared to allow life-cycle wages patterns to vary with occupation, gender, urban/rural and province: 6
Ln (Wages) = α + βiXi + μi, μ ~ (0, σ2), … … … … (1) where X is a vector with the right-side variables described above. We then calculate the standard deviations of the residuals from the estimated ln wages relation for each of the 144 groups defined above and refer to these standard deviations as the “wages risks.” 7
Because wages are the product of average hourly wage rates and hours worked, we also follow a similar procedure for wage rates and hours worked by estimating:
Ln(Wage Rate) = a + biXi + ui, u ~ (0, σ2) … … … … (2)
Ln(Hours Worked) = ξ + λiXi + νi, ν ~ (0, σ2) … … … … (3) We then define “wage rate risks” and “hours worked risks” parallel to “wages risks”, defined above.
Table 2 presents OLS estimates of relations (1)-(3). The graphical presentation of life-time earnings profiles based on gender, provinces, urban/rural and occupations are presented in Figures 1–4. The estimated coefficients of occupational, regional, gender, provincial categories, age and age square confirm an inverted u-shaped life-time earning profile, as has usually been reported in the previous literature. The gender earning gap favoring males is evident from this regression analysis, with this gap increasing over the life cycle. Among the occupational categories, ‘Managers, senior officials and legislators’ remain the highest earnings category over the life cycle. The earnings of ‘Professionals’ increase sharply initially with age but there is steep decline as well for older ages. ‘Clerks’ is one occupational category whose mean earnings remain almost stable throughout the working life.
The first three columns of Table 3 present summaries of our estimated wages risks, wage rate risks, and hours worked risks by occupation, gender, urban/rural and province. The means for wages risks and wage rate risks are fairly stable for those with low levels of schooling but increase for those with the highest two or three schooling levels. In the case of gender, wages risks are very high for females as compared to their male counterparts, with both wage rates risks and hours worked risks higher. The higher wages risks for females may reflect that a large proportion of working women are in the informal sector without any legally-binding agreements between employers and employees.
6The extended form of this equation is:
ln(Wage si) = + 1jage + 2jagesq + 3jgender + 4jgender * age + 5jgender * agesq + 1jregion +
7jregion * age + 8jregion * agesq + 9ijage 4j=1 province + 1Dij 4j=1province * age + 11ij
4
j=1province * age sq + 12ij9j=1occupation + 13ij9j=1occupation * age + 13ij9j=1 occupation * agesq + j
7Wages risks , where i refers to the ith individual in the jth group and n is number of observations in each group.
Table 2
Regression Results for ln Monthly Wages, ln Hourly Wage Rate and ln Hours Worked per Week
ln Monthly Wages
ln Hourly Wage Rate
ln Hours Worked per Week
Variables Coefficient Estimate Standard Error Coefficient Estimate
Standard Error Coefficient Estimate Standard Error Age 0.14*** 0.005 0.15*** 0.006 –0.01*** 0.002 Age2 –0.001*** 0.00007 –0.001*** 0.00007 0.0001*** 0.00002 Occupation Professionals –0.34* 0.14 0.05 0.16 –0.39*** 0.05 Technicians –0.06 0.11 0.09 0.12 –0.15*** 0.04 Clerks 1.42*** 0.14 1.58*** 0.15 –0.15** 0.05 Services 0.177 0.11 0.20 0.12 –0.02 0.04 Skilled_Agri 0.45* 0.19 0.55** 0.20 –0.10 0.07 Craft 0.66*** 0.11 0.87*** 0.12 –0.21*** 0.04 Plant and Machine 1.54*** 0.13 1.81*** 0.13 –0.25*** 0.04 Elementary/Unskilled 0.77*** 0.11 0.83*** 0.11 –0.06 0.04 Occupations*Age Professionals*Age 0.02* 0.008 0.003 0.008 0.01*** 0.003 Technicians*Age –0.02** 0.006 –0.01* 0.007 –0.0005 0.002 Clerks*Age –0.09*** 0.008 –0.09*** 0.008 0.003 0.003 Services *Age –0.03*** 0.006 –0.04*** 0.006 0.005** 0.002 Skilled_Agri*Age –0.05*** 0.010 –0.06*** 0.01 0.005 0.003 Craft*age –0.06*** 0.006 –0.07*** 0.006 0.011*** 0.002 Plant & Machine*Age –0.11*** 0.007 –0.13*** 0.007 0.02*** 0.002 Elementary*Age –0.07*** 0.006 –0.08*** 0.006 0.003 0.002 Occupation*Age2 Professionals*Age2 –0.0003** 0.0001 –0.0001 0.0001 –0.0001*** 0.00003 Technicians*Age2 0.0001* 0.0001 0.0001 0.00009 0.00003 0.00003 Clerks*Age2 0.0009*** 0.0001 0.001*** 0.0001 –0.00001 0.00003 Services*Age2 0.0002* 0.0001 0.0002* 0.00008 –0.00003 0.00003 Skilled_Agri*Age2 0.0005*** 0.0001 0.0005*** 0.0001 –0.00005 0.00005 Craft*Age2 0.0006*** 0.0001 0.0007*** 0.00008 –0.0001*** 0.00003
Plant and Machine*Age2 0.001*** 0.0001 0.001*** 0.00009 –0.0002*** 0.00003
Elementary*Age2 0.0007*** 0.0001 0.0007*** 0.00008 –3.65E-06 0.00002 Region Rural 0.006 0.04 0.007 0.04 0.0008 0.01 Rural*Age –0.006* 0.002 –0.006* 0.002 –0.0002 0.0008 Rural*Age2 0.00004 0.00003 0.00004 0.00003 3.64E-06 0.00001 Gender Female –0.752*** 0.06 –0.50*** 0.07 –0.2*** 0.02 Female*Age 0.022*** 0.004 0.02*** 0.004 0.005*** 0.001 Female*Age2 –0.0003*** 0.00005 –0.0002*** 0.00006 –0.00007*** 0.00002 Province Sindh 0.045 0.045 0.02 0.05 0.02 0.02 KPK –0.032 0.062 –0.09 0.06 0.06* 0.02 Balochistan 0.41*** 0.069 0.4*** 0.07 –0.03 0.02 Province*Age Sindh*Age 0.0026 0.0028 0.004 0.003 –0.001 0.001 KPK*Age 0.0011 0.0035 0.007* 0.004 –0.006*** 0.001 Balochistan*Age –0.011* 0.004 –0.01* 0.005 –0.001 0.001 Province*Age2 Sindh*Age2 –0.00002 0.00003 –0.00004 0.00004 0.00002* 0.00001 KPK*Age2 0.00001 0.00005 –0.00008 0.00005 0.00009*** 0.00001 Balochistan*Age2 0.0001** 0.00005 0.0001 0.00006 0.00002 0.00002 Constant 5.87*** 0.11 0.26*** 0.11 4.16*** 0.03 F( 41, 77643) 1142.92 1215.54 491.51 Prob > F 0.0000 0.0000 0.0000 R-squared .3764 .3909 .2061 Adj R-squared .3760 .3907 .2056 N 77685 77685 77685 Notes: *t significant at p<.05. **t significant at p<.01. ***t significant at p<.001.
Fig. 1. Male- Female Life-Time Wage Earnings Profiles
Fig. 3. Life Time Wage Earnings Profiles in Different Provinces
Table 3
Summary Statistics for Wages Risks, Wage Rate Risks, Hours Worked Risks and Disability Risks
Variable Wages Risks Wage Rate Risks Hours Worked Risks Disability Risks8 Gender Male .57 (.09) .63 (.09) .22 (.04) 1.4 (12.3) Female .77 (.10) .76 (.08) .27 (.05) .45 (7.05) Region Rural .58 (.09) .65 (.08) .23 (.04) 1.7 (14.8) Urban .60 (.12) .65 (.11) .22 (.04) 1.02 (9.3) Province Punjab .63 (.11) .67 (.09) .24 (.04) 1.6 (12.0) Sindh .59 (.11) .64 (.11) .21 (.04) 1.17 (11.0) KPK .58 (.11) .64 (.10) .26 (.04) .96 (9.29) Balochistan .52 (.08) .57 (.08) .20 (.04) 0.93 (15.4) Schooling Illiterate .57 (.10) .62 (.08) .24 (.05) 1.78 (12.4) Primary (5 grades) .57 (.09) .62 (.08) .23 (.04) 2.12 (18.7) Middle (8 grades) .56 (.08) .61 (.07) .22 (.04) 1.56 (11.0) Matric (10 grades) .58 (.10) .63 (.09) .22 (.04) .97 (8.96) Intermediate (12 grades) .59 (.11) .64 (.11) .22 (.04) 0.83 (10.4) Graduation (14-16 grades) .67 (.13) .71 (.13) .23 (.04) 0.63 (7.64)
Above Graduation (more than 16 grades) .71
(.13) .75 (.13) .23 (.05) 0.45 (6.49) Occupations Managers .79 (.04) .84 (.05) .19 (.02) 0.69 (7.4) Professionals .82 (.06) .87 (.06) .26 (.04) 0.55 (7.44)
Technicians and Associate Professionals .61
(.10) .67 (.08) .25 (.03 0.63 (7.95)
Clerical Support Workers .51
(.05) .55 (.05) .17 (.03) 0.86 (11.29)
Service and Sales Workers .56
(.05) .62 (.04) .22 (.02) .80 (8.27) Skilled, Agricultural, Forestry and Fishery
Workers .52 (.09) .62 (.07) .23 (.04) 2.55 (14.7)
Craft and Related Trade Workers .58
(.08) .61 (.06) .19 (.04) 2.44 (13.84)
Plant and Machine Operators, Assemblers .50
(.03) .56 (.03) .23 (.02) 2.48 (20.13) Elementary Occupations .56 (.08) .63 (.06) .26 (.03) 1.41 (12.68) Number of Observations=77685
8The labour market diability risk rate is calculated as: number of injuries faced by every individual during one year/Total number of hours worked by every worker during one year*200,000; where 200,000 = base for 100 full-time equivalent workers (40 hours per week, 50 weeks per year).
Disability Risks: Work accidents are widespread. According to the International Labour Organisation (ILO, 2010),9there are 340 million occupational accidents and 160 million victims of work-related illnesses annually, overall in the world. Moreover in the Middle East and Asia ILO region that includes Pakistan (but excludes China and India), work-related accident fatality rates are four-fold more than those observed in industrialized countries.
For our empirical work we define “disability risks” to be the incidence of injuries or illness at the work-place for the same 144 groups defined above.10 The fourth column of Table 3 presents summaries of the estimated disability risks by occupation, schooling, gender, urban/rural and province. The disability risks tend to have patterns opposite to the wage risks for schooling, occupations and gender. Occupational disability rates are highest in ‘Skilled, Agricultural, Forestry and Fishery Workers’, ‘Craft and Related Trade Workers’ and ‘Plant/Machine Operators and Assemblers.’
Correlations Among Risks Measures: The more correlated are the risks measures, of course, the less is gained by including multiple risks measures in our analysis. On the other hand, the more correlated are the risks the harder it would be to identify the associations of schooling with any one particular type of risks rather than other highly-correlated types. Table 4 gives the correlations among our measures. Note that the wages risks measure and the wage rate risks measure are highly correlated, but—though both are significantly correlated with the hours worked risks—for neither of the two are the correlations with hours worked risks all that high. On the other hand disability risks are negatively and significantly correlated with both the wages risks and wage rate risks, though the absolute magnitudes of these correlations are small and the correlation with hours worked risks is insignificant.
Table 4
Correlations among Wages Risks and Disability Risks
Type of Risk Wages Risks Wage Rate Risks Hours Worked Risks Disability Risks Wages Risks 1 – – –
Wage Rate Risks 0.96*
(0.00)
1 – –
Hours Worked Risks 0.32*
(0.00) 0.38* (0.00) 1 – Disability Risks –.025* (.00) –.025* (0.00) –.008 (.014) 1 Note: *Significant at .01 level.
4. RESULTS
The primary results of interest for this study are estimates of associations between schooling attainment and wages, wage risks and disability risks. Therefore we estimate relations of the form of
9International Labour Organisation (2010), World Statistics: The Enormous Burden of Poor Working Condition. http://www.ilo.org/public/english/region/eurpro/moscow/areas/safety/statistic.htm Accessed on April, 8th 2011.
10
Yi= α + βiZi+ μi, μ ~ (0, σ2) … … … (4) Where Yiis a seven-element vector of labour market outcomes (mean wages, mean wage rates, mean hours worked, wages risks, wage rate risks, hours worked risks, and disability risks) for each individual based on his/her being in one of the 144 labour market categories as a function of the vector Z, which includes three dichotomous variables for provinces (with Punjab the omitted category), a dichotomous variable for female, a dichotomous variable for rural and seven dichotomous variables for different schooling levels.
The first three variables in Yi —mean wages, mean wage rates, and mean hours worked—have been included because these are the work life-cycle equivalents of the variables that are the outcomes of usual emphasis in studies on associations between schooling and labour market outcomes. In addition we include various risks variables that have been defined and described above.
Table 5 presents estimates for the first three variables in Yi. Ln mean wages are lower in Punjab than in the other three provinces, particularly than in Balochistan. This reflects that ln mean wage rates are higher in the three other provinces than in Punjab, indeed enough higher in Balochistan and in the Khyber Pakhtunkhwa to more than offset the significantly lower ln mean hours worked in these two provinces. The mean ln wages are 0.17 ln points lower in rural than in urban areas, primarily reflecting that the significantly lower ln wage rates are reinforced slightly by lower ln hours worked. The mean ln wages are 0.52 ln points lower for females than for males, reflecting a combination of 0.32 ln points lower ln wage rates and 0.20 lower ln points hours worked.11 The coefficient estimates for the schooling levels indicate significantpositive
Table 5
Regressions for Mean ln Wages, Mean ln Wage Rates and Mean ln Hours Worked
Mean ln Wages Mean ln Wage Rate Mean ln Hours Worked Coefficient Estimate Standard Error Coefficient Estimate Standard Error Coefficient Estimate Standard Error Province Sindh 0.12*** 0.002 0.12*** 0.002 0.006*** 0.0007 KPK 0.06*** 0.003 0.10*** 0.003 –0.03*** 0.0009 Balochistan 0.27*** 0.003 0.34*** 0.003 –0.06*** 0.0009 Region Rural –0.17*** 0.002 –0.15*** 0.002 –0.01*** 0.0006 Gender Female –0.52*** 0.004 –0.32*** 0.004 –0.20*** 0.001 Schooling Primary 0.06*** 0.003 0.07*** 0.002 –0.005*** 0.0009 Middle 0.10*** 0.003 0.11*** 0.004 –0.01*** 0.001 Matriculation 0.25*** 0.003 0.31*** 0.003 –0.06*** 0.0009 Intermediate 0.39*** 0.003 0.51*** 0.004 –0.11*** 0.001 Degree 0.60*** 0.004 0.74*** 0.004 –0.13*** 0.001 Above Degree 0.72*** 0.005 0.87*** 0.005 –0.14*** 0.001 Constant 8.06*** 0.002 2.65*** 0.002 3.96*** 0.0007 F( 11, 77673) 7566.36 8579.84 8350.88 Prob > F 0.0000 0.0000 0.0000 Adj R-squared 0.56 0.53 0.54 N 77685 77685 77685 11
associations between schooling and ln wages and more strongly with ln wage rates. The latter more than offset the increasing significantly negative association between schooling levels and mean ln hours worked, perhaps because those with higher full incomes use part of their incomes to purchase more leisure. The patterns in the coefficient estimates for schooling attainment, thus, are consistent with the usual emphasis on positive associations of schooling with wages and wage rates, with the latter more than offsetting possibly negative associations with hours worked.
Table 6 presents the estimates for the last four components of Yi, those related to wages risks (including the two components of wage rate risks and hours worked risks) and disability risks. For almost all of the alternative risks variables, risks are significantly greater in the Punjab than in the other three provinces, and least of all in Balochistan.12 The single exception to this statement is that the hours worked risks are greatest in the Khyber Pakhtunkhwa. The risks are significantly less in rural than in urban areas for wages, but are significantly greater in rural areas than in urban areas for wage rates, hours worked and disabilities. Thus in terms of geography, both with reference to provinces and rural/urban areas, there is a tendency ceteris paribus for lower wages to be associated with greater risks—the opposite of what one might expect if wages included compensating differentials for risks. Females experience significantly higher wages risks than males by about 0.16 ln points, reflecting primarily higher wage rate risks but also significantly higher hours worked risks. But females experience significantly lower disability risks.
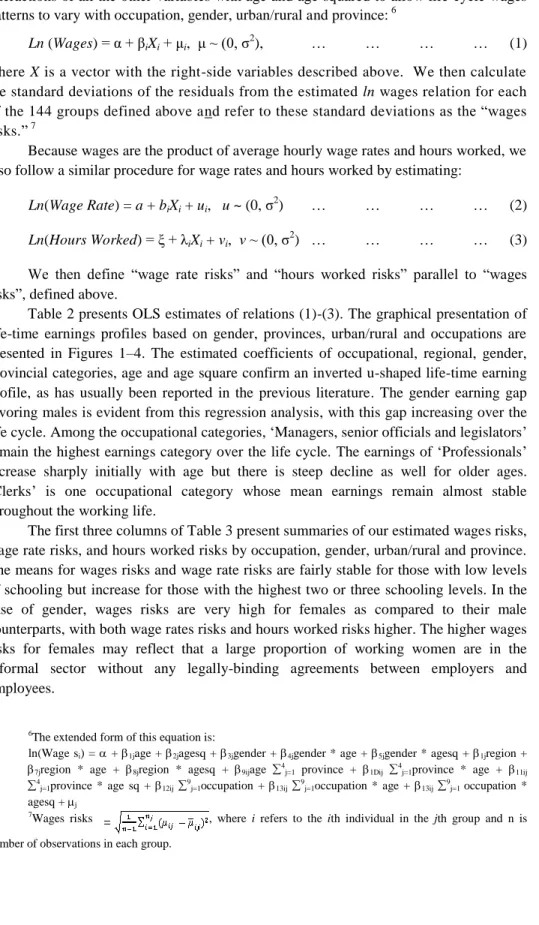
Of central interest for this paper are the associations between schooling and wages risks and disability risks, the estimated values of which are plotted in Figure 5. As compared with no schooling, having primary school does not significantly change the risk experience except for significantly slightly less hours worked risks. Having middle schooling, however, significantly reduces both wages risks (and both of its components) Fig. 5. Schooling Levels and Associated Mean ln Wages, Mean ln Wage Risks and
Mean Disability Risks (Males and Females)
Wages_Risks Disability_Risks W a g e s
Iliterate Primary Middle
Matric Inter Degree
Higher
12Punjab is the largest province of Pakistan, both in terms of population and economic activity, with a large proportion of the workforce engaged in agriculture-based employment. During the period under study there were considerable fluctuations in agricultural production (Economic Survey of Pakistan 2006-07), consistent with relatively high risks in this province. Siddiqui and Siddiqui (1998) and Ashraf and Ashraf (1993) present related results for earning equations.
Estimates of Associations of Schooling with Wages Risks and Disability Risks
Wages Risks Wage Rate Risks Hours Worked Risks Disability Risks
Coefficient Estimate Standard Error Coefficient Estimate Standard Error Coefficient Estimate Standard Error Coefficient Estimate Standard Error Province Sindh –0.03*** 0.0007 –0.03*** 0.0007 –0.02*** 0.0003 –0.31*** 0.10 KPK –0.04*** 0.0009 –0.04*** 0.0009 0.02*** 0.0004 –0.57*** 0.13 Balochistan –0.09*** 0.0009 –0.09*** 0.001 –0.04*** 0.0004 –0.73*** 0.14 Region Rural –0.0001* 0.0006 0.01*** 0.0006 0.01*** 0.0002 0.53*** 0.09 Gender Female 0.16*** 0.001 0.10*** 0.0009 0.04*** 0.0004 –0.81*** 0.14 Schooling Primary –0.0001 0.0008 –0.0007 0.0007 –0.009*** 0.0004 0.27* 0.14 Middle –0.003*** 0.0009 –0.003*** 0.001 –0.01*** 0.0005 –0.28* 0.16 Matriculation 0.006*** 0.0008 0.007*** 0.001 –0.01*** 0.0004 –0.77*** 0.13 Intermediate 0.02*** 0.001 0.02*** 0.001 –0.01*** 0.0005 –0.83*** 0.16 Degree 0.09*** 0.001 0.09*** 0.001 –0.01*** 0.0004 –0.96*** 0.15 Above Degree 0.12*** 0.001 0.12*** 0.001 –0.01*** 0.0006 –1.08*** 0.19 Constant 0.58*** 0.0007 0.64*** 0.0007 0.24*** 0.0003 1.88*** 0.11 F( 11, 77673) 5506.27 4190.13 3102.92 25.13 Prob > F 0.0000 0.0000 0.0000 0.0000 R–squared 0.4262 0.3330 0.3053 0.0035 Adj.R-Squared 0.4261 0.3330 0.3053 0.0035 N 77685 77685 77685 77685
Estimates of Association of Schooling with Mean ln Wage, Mean ln Wage Rate, Mean ln Hrs Worked, Mean ln Wage Risks), Mean ln WageRate Risks, Mean ln Hours Worked Risks, Mean Disability Risks [Note: Standard Errors in Parenthesis]
Mean ln
Wages
Mean ln Wage Rate Mean ln Hrs
Worked
Mean ln
Wages Risks
Mean ln Wage Rate Risks Mean ln Hours Worked Risks Mean Disability Risks Province Sindh 0.14*** (0.05) 0.09** (0.05) 0.06** (0.02) –0.04 (0.03) –0.05** (0.03) –0.03* (0.02) –0.20 (0.32) KPK 0.04 (0.05) 0.04 (0.05) 0.0001 (0.02) –0.07** (0.03) –0.07*** (0.03) 0.01 (0.01) –0.38 (0.30) Balochistan 0.32*** (0.05) 0.33*** (0.05) –0.01 (0.02) –0.13*** (0.03) –0.12*** (0.03) –0.06*** (0.02) –0.39 (0.32) Region Rural –0.10*** (0.04) –0.08** (0.04) –0.02 (0.02) 0.07** (0.02) 0.07*** (0.02) 0.02 (0.01) 0.69* (0.25) Gender Female –0.46*** (0.05) –0.40*** (0.05) –0.08*** (0.02) 0.12*** (0.03) 0.05* (0.03) 0.01 (0.02) –0.49 (0.31) Schooling Primary –0.21 (0.43) –0.16 (0.38) –0.05 (0.19) –0.35 (0.27) –0.11 (0.24) –0.28** (0.13) –2.78 (2.65) Middle 1.6** (0.61) 0.89 (0.55) 0.72** (0.26) –0.24 (0.37) –0.32 (0.34) –0.17 (0.18) 6.35* (3.69) Matric 0.22 (0.30) 0.18 (0.27) 0.04 (0.13) 0.13 (0.18) 0.14 (0.16) –0.12 (0.09) –2.36 (1.79) Intermediate 0.65* (0.37) 0.92*** (0.32) –0.28* (0.15) –0.83*** (0.22) –0.72*** (0.20) –0.23** (0.11) –1.63 (2.18) Graduate 1.08*** (0.27) 1.14*** (0.23) –0.07 (0.11) 0.39** (0.16) 0.48*** (0.14) –0.06 (0.08) –0.76 (1.58) Above Degree 2.21*** (0.21) 2.36*** (0.18) –0.15 (0.09) –0.08 (0.12) –0.03 (0.11) –0.19*** (0.06) –0.76 (1.22) Constant 7.17*** (0.09) 1.98*** (0.08) 3.84*** (0.05) 0.89*** (0.06) 0.83*** 0.05 0.37*** (90.03) 1.81** (0.72) N F(11, 94) Prob>F R-Square Adj. R-Square 106 69.30 0.00 0.89 0.87 106 103.65 0.00 0.92 0.91 106 15.55 0.00 .645 .603 106 11.29 0.00 0.56 0.51 106 9.60 0.00 0.52 0.47 106 6.34 0.00 0.43 0.36 106 3.84 0.00 0.31 0.23
and disability risks. Having still higher levels of schooling increasingly reduces disability risks, but increases wages risks (and even more wage rate risks that offsets slight declines in hours worked risks). Therefore the increased average wages and wage rates with more schooling noted in Table 5 may in part be due to compensating differentials for increased wages risks and wage rate risks—but there certainly is not evidence of compensating differentials for disability risks, which are negatively associated with schooling.
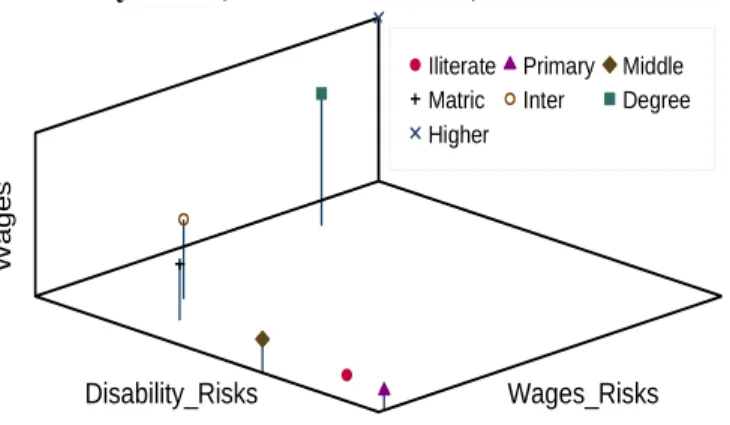
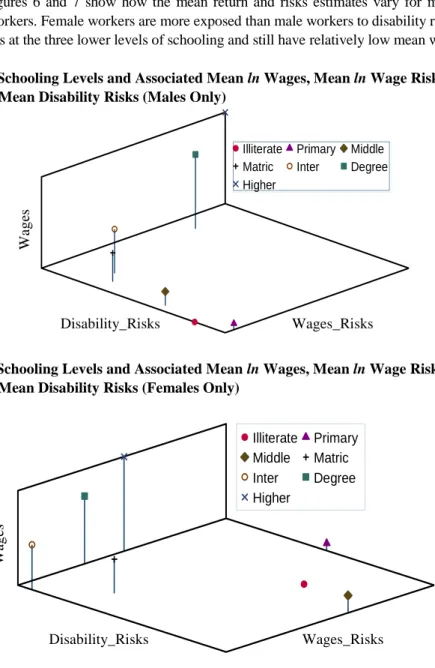
Figures 6 and 7 show how the mean return and risks estimates vary for male and female workers. Female workers are more exposed than male workers to disability risks and wage risks at the three lower levels of schooling and still have relatively low mean wages.
Fig. 6: Schooling Levels and Associated Mean ln Wages, Mean ln Wage Risks and Mean Disability Risks (Males Only)
Wages_Risks Disability_Risks W a g e s
Illiterate Primary Middle
Matric Inter Degree
Higher
Fig. 7. Schooling Levels and Associated Mean ln Wages, Mean ln Wage Risks and Mean Disability Risks (Females Only)
Wages_Risks
Disability_Risks
W a g e s Illiterate Primary Middle Matric Inter Degree HigherTable 7 presents alternative estimates in which the observations are the mean values for the subset of 106 of the 144 labour market categories for which there are sufficient numbers of observations (minimum number of observations in each category is
Disability_Risks Wages_Risks W ag es Disability_Risks Wages_Risks W ag es
at least 15), rather than the individuals, for the same specifications as in Tables 5 and 6. The estimates in Table 7 generally are consistent with the results in Tables 5 and 6 (i.e., positive associations of schooling with wages risks but negative association of schooling with disability risks), though with some minor differences and a tendency towards less precision.
5. CONCLUSION
Schooling is widely associated with wages in developing country labour markets. However other characteristics of these markets also may be importantly associated with schooling. Subject to the caveats about our assumptions above, we have examined what are the associations between schooling attainment and “wages risks” and “disability risks” in Pakistani labour markets. Our estimates suggest that more schooling is not only significantly positively associated with higher work life-cycle mean wages and wage rates, but also with higher wages risks and lower disability risks. These patterns also differ significantly by gender, moreover, with women with low schooling facing higher wages risks and lower disability risks than men with low schooling. Considering the wage level-schooling association alone, therefore, may be misleading regarding the associations of schooling with labour market outcomes and gender differentials in those associations.
REFERENCES
Ahmed, R. and P. Azim (2010) Youth Population and the Labour Market of Pakistan: A Micro Level Study. Pakistan Economic and Social Review 48:2, 183–208.
Albrecht, J., A. Bjorklund, and S. Vroman (2001) Is There a Glass Ceiling in Sweden?
Institute for the Study of Labour, Germany. (IZA Discussion Papers, No. 282)
Ashraf, J. and B. Ashraf (1993) An Analysis of the Male-Female Earnings Differential in Pakistan. The Pakistan Development Review 32:4, 895–904.
Arnould, Richard J. and Len M. Nichols (1983) Wage-Risk Premiums and Worker’s Compensation: A Refinement of Estimates of Compensating Wage Differentials.
Journal of Political Economy 91:2, 332–340.
Albrecht, J., A. Vuuren, and S. Vroman (2004) Decomposing the Gender Wage Gap in the Netherlands with Sample Selection Adjustments. Institute for the Study of Labour, Germany. (IZA Discussion Papers, No. 1400).
Ben-Porath, Yoram (1967) The Production of Human Capital and the Life Cycle of Earnings, Journal of Political Economy 75, 352–378.
Blinder, Alan S. and Y. Weiss (1976) Human Capital and Labour Supply: A Synthesis.
Journal of Political Economy 84, 449–472.
Christiansen, Charlotte, J. S. Joensen, and H. S. Nielsen (2006) The Risk-Return Trade-Off in Human Capital Investment. Institute for the Study of Labour (IZA) in its Series IZA. (Discussion Paper 1962).
Denny, K. and C. Hormon (2007) Education Policy Reform and the Return to Schooling from Instrumental Variables. The Institute for Fiscal Studies (Working Paper. 00/07). Diaz-Serrano, I, and J. Hartog (2006) Is there a Risk-Return Trade-Off in Educational
Choices? Evidence from Spain. Investigaciones Economicas 30:2, 353–380.
Dillingham, Alan E. (1985) The Influence of Risk Variable Definition on Value-of-Life Estimates. Economic Enquiry 24:2, 277–294.
Dorsey, Stuart, and N. Walzer (1983) Workers’ Compensation, Job Hazards, and Wages.
Industrial and Labor Relation Review 36:4, 642–654.
Dorman, P. and P. Hagstrom (1998) Wage Compensation for Dangerous Work Revisited. Industrial and Labor Relations Review 52:1, 116–135.
Dolado, J. J. and V. Llorens (2004) Gender Wage Gaps by Education in Spain: Glass Floors vs. Glass Ceilings. Madrid. (Working Paper, CEPRDP 4203).
Duncan, Greg J. and Bertil Holmlund (1983) Was Adam Smith Right After All? Another Test of the Theory of Compensating Wage Differentials. Journal of Labor Economics
1, 366–379.
Durrant, Valerie L. (2000) Adolescents Girls and Boys in Pakistan: Opportunities and Constraints in Transitions to Adulthood. Islamabad: Population Council. (Research Report No.12).
Harmon, C., V. Hogan, and I. Walker (2001) Dispersion in the Economic Return to Schooling. (Center for Economic Research Working Paper Series, 01/16).
Herzog, Henry W., Jr. and Alan M. Schlottmann (1990) Valuing Risk in the Workplace: Market Price Willingness to Pay, and the Optimal Provision of Safety. Review of Economics and Statistics 72:3, 463–470.
Hersch, J. (1998) Compensating Differentials for Gender-Specific Job Injury Risk. The American Economic Review 88:3, 598–607.
Heckman, James (1976) A Life-Cycle Model of Earnings, Learning, and Consumption.
Journal of Political Economy 84, 211–244.
Hyder, A. (2007) Wage Differentials, Rate of Return to Education, and Occupational Wage Share in Labour Market of Pakistan. Pakistan Institute of Economic Development, Islamabad. (Working Paper No. 2007: 17).
Khan, S. R. and M. Irfan (1985) Rate of Returns to Education and Determinants of Earnings in Pakistan. The Pakistan Development Review 34:(3&4).
Krueger, Alan B. and Lawrence H. Summers (1987) Reflections on Inter-Industry Wage Structure, In Kevin Lang and Jonathan S. Leonard (eds.) Unemployment and Structure of Labour Markets. New York: Basil Blackwell.
Low, H, Meghir, C. and L.Pistaferri (2008) Wage Risk and Employment Risk Over the Life Cycle, Bonn: Institute for the Study of Labour (IZA). (Working Paper No. 1700). McGoldrick, K. (1995) Do Women Receive Compensating Wages For Earnings Risk?
Southern Economic Journal 62:1, 210–222.
McGoldrick, Kim Marie, and John Robst (1996) Gender Differences in Over Education: A Test of the Theory of Differential Over Qualification. American Economic Review
86, 280–284.
Moore, Michael and W. Kip Viscusi (1990) Compensation Mechanisms for Job Risks: Wages, Workers’ Compensation and Productive Liability. Princeton: Princeton University Press.
Pereira, P. T. and P. S. Martins (2002) Is there a Return-risk Link in Education?
Economic Letters 75:1, 31–37.
Polachek, Solomon William (1981) Occupational Self-Selection: A Human Capital Approach to Sex Differences in Occupational Structure. The Review of Economics and Statistics 63:1, 60–69.
Psacharopoulos, George (1985) Returns to Education: A Further International Update and Implications. Journal of Human Resources 20:4, 583–604.
Psacharopoulos, George (1994) Returns to Investment in Education: A Global Update.
World Development 22, 1325–1344.
Psacharopoulos, George and Harry Patrinos (2004) Returns to Investment in Education: A Further Update. Education Economics 12:2, 111–134.
Robinson, James C. (1991) Toil and Toxics: Workplace Struggles and Political Strategies for Occupational Safety and Health. Berkeley: University of California Press.
Serrano, L. D., J. Hartog, and H. S. Neilson (2003) Compensating Wage Differentials for Schooling Risk in Denmark. (IZA Discussion Paper Series, 963).
Siddiqui, R. and R. Siddiqui (1998) A Decomposition of Male-Female Earnings Differentials. The Pakistan Development Review 37:4, 885–898.
Shabbir, Tayyab (1993) Productivity-Enhancing vs. Credentialist Effects of Schooling in Rural Pakistan. International Food Policy Research Institute.
Shabbir, Tayyab (1994) Mincerian Earning Functions for Pakistan. The Pakistan Development Review 33:1.
Tuor, S. N. and U. Backes-Gellner (2010) Risk-Return Trade-Offs to Different Educational Paths: Vocational, Academic and Mixed. International Journal of Manpower 31:5, 495–519.