ISSN 1585-0404
Introduction
In Egypt, peach crop presents an important economic value and exporting potential. According to (FAO, 2013) the area cultivated with peach in Egypt is 59960.72 feddans in which produced 281 814 tons/year. Peach gained its economic importance from these early and mid-season low chilling cultivars which introduced in last several years, mainly from the U.S.A by the Agriculture Development system (Shaltout, 1995). From these cultivars, the Desert red cultivar which is considered an early and low chilling one; it matures at third week of May under Egyptian conditions. It exhibited a high adaptation with the local environmental conditions.
Desert red peach tree cultivar suffers from some problems such as ; a-low fruit quality because of producing a large number of fruits that can set more than that is required to get commercial yield and thereby there is a negative impact on fruit size, and other fruit characteristics remain mediocre, particularly the chemical characteristics of fruits such as sugar concentration and acidity unless dormant pruning and fruit thinning were done, and b-doubles and deep sutures which recognized as physiological disorders related to water stress either resulting from drought or deficit irrigation especially during bud differentiation after harvest in the previous season (Kader 2002).These disorders render fruits
unmarketable, however double fruits can be separated by hand thinning and sorting, deep sutures are intractable to expose on small fruitlets (Handley and Johnson, 2000).
There are certain factors that may influence of on chemical and physical fruit quality and fruit growth like light distribution in peach tree canopy and competition between fruits. (Chartzoulakis et al., 1993). Using pruning for peach tree is important for light penetration and modifying the number of shoots bearing fruit within tree canopy which have a great effect on fruit growth and quality (Marini and Sowers, 1994). So, it can obtain fruits with higher fruit quality by increasing flux of light shined to the fruit (Shiukhy et al., 2014). Also light penetration is important to the maintenance of high quality fruit wood and development of flower buds (Erez and Flore, 1986).
We can overcome the adverse effects of high crop load (as small fruit size and poor quality, breakage of limbs, exhaustion of tree reserves, and reduced cold hardiness) by fruit thinning(Meitei et al., 2013). Fruit thinning is fundamental, horticultural practices for improving quality in terms of fruit size, increasing sugar concentration and reduction acidity fruit colour, shape, maximizing crop value, maintaining tree growth and structure (Byers et al., 2003) and for removing double fruits(Handley and Johnson 2000). Other advantages of this technique are well known viz.
Treatments for improving tree growth, yield and fruit
quality and for reducing double fruit and deep suture
incidence in “Desert red” peach trees
Zayan, M.A.
1, Mikhael, G. B.
2& Okba, S.K.
211Department of Horticulture, Faculty of Agriculture, University of Egypt, Kafr El-Sheikh, Egypt 2Horticultural Research Institute, ARC, Giza, Egypt
Summary: Five years old “Desert red” peach trees budded on Nemaguard rootstock and grown in sandy soil at commercial orchard Al-Nubaria city, El-Behira Governorate-Egypt were treated with some agricultural treatments involving thinning out pruning, fruit thinning and foliar application of potassium silicate (25% S +10% K2O) at 0.1% and super grow (20% N, 20% P2O5 and 20% K2O) at 0.3% in 2014 and 2015
seasons, to study their effects on yield and fruit quality and the relationship between nutrient balance and yield of “Desert red” peach trees. Beside, testing the influence of used treatments on two physiological disorder, double fruit and deep suture %. Also, economic evaluation of different treatments was done. All obtained data were statistically analyzed using a randomized complete block design. Depending on the obtained results in this study, it could be concluded that application of thinning out pruning 35%, fruit thinning by leaving 15 cm between fruits on one-year old shoot at 20 days after full bloom and foliar application of potassium silicate which sprayed five times during each growing season at fruit set, the second fruit development stage, the beginning of the fruit color change and twice after month from harvest, most profitable treatment for peach trees grown under conditions of this investigation. This treatment gave the best vegetative growth, yield, fruit quality, higher crop value with high net income /fed. from “Desert red” peach trees, in addition, reduced the percentage of double fruit and deep suture by more than 50% in both seasons, therefore, the study recommends this treatment for “Desert red” peach growers.
prevents alternate bearing and balances the fruit-to-shoot ratio, leading to an increase in assimilates to fruits and shoots so, peach fruit, thinning must be done every year (Costa et al., 1983). It is recommended to thin at stage I because it encourages cell division and expansion and leads to larger fruit size (Westwood et al., 1967).
Also, foliar fertilization can play important role in improving fruit quality by providing nutrients during a critical phase of restricted nutrient supply(Veberič et al., 2002b; Holb et al., 2009). The efficiency of foliar applied nutrients and their utilization is strongly depended on the demand of a tree in the given phenological state and that is nutrient specific (Weinbaum et al., 2002).From these elements, potassium which transports sugars from leaves to fruits so, it is very important during the fruit growth period (Weinbaum et al. 1994). In addition, the importance of potassium in improving quality (Ben et al (2009). Benlloch-Gonzalez et al. (2008) affirmed that potassium increases the ability of olive trees to withstand water stress. So, we try to test the role of K+ spray (especially if it applies after
harvest during bud induction, particularly in Egypt where the peach growers neglect the irrigation in these critical period. This water stress may induce double fruit incidence in the following season. There are other elements that can affect on the yield and quality as P and N. In peach, P applications have increased flower formation, whereas N was found to reduce it (Fukuda & Kondo, 1957). Arora et al. (1999) concluded that flowering intensity, fruit set, fruit weight and fruit yield were directly associated with leaf N content. Mineral nutrition is a pre-harvest factor that affects fruit quality and has to be performed very carefully since, after harvest, peach quality cannot be improved but only maintained (Crisosto et al., 1997; Holb et al., 2007).
Therefore, in this study, the goal was to study the effect of thinning out pruning, fruit thinning and foliar application of potassium silicate and super grow (20% N, 20% P2O5 and 20%
K2O )on yield and fruit quality and the relationship between
some nutrient balance and yield of “Desert red” peach trees. Beside, testing the influence of used treatments on both physiological disorders, double fruit and deep suture %.
Materials and methods
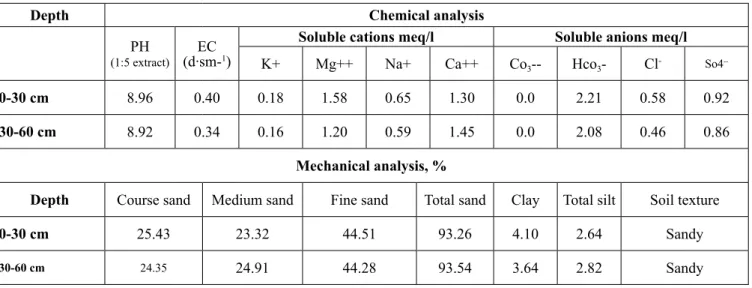
The present investigation was carried out two successive seasons 2014 and 2015 on five years old Desert red peach trees budded on Nemaguard rootstock and grown in sandy soil at commercial orchard, Al-Nubaria city, El-Behira Governorate-Egypt. The depth of water table was over 150 cm. The properties of the experimental soil are in Table 1.The trees were planted at 4×5 m apart (210 trees/Fed.).Trees were trained to open center vase and received the recommended agricultural practices. Drip irrigation was used for irrigation. Forty eight trees of similar size and shape were selected and arranged in a randomized complete block design. The chosen trees were grouped under eight treatments in each season. Each treatment was represented by three replicate, two trees
per each. Table (2) summarize the eight applied treatments. All obtained data were statistically analyzed using a randomized complete block design according to Snedecor and Cochran (1967).
The best date of foliar application after harvest has been determined based on anatomical study in the previous season of this investigation for determining the threshold of bud initiation (according to Johansen, 1940 and Sass, 1958). Flatting of doming meristem and receptacle primordial (R) was noticed in 30 june 2013, while sepal (S) and petal (Pe) primordial were Occurred in 15 July (As shown in Figs (1 & 2 & 3) ). Study these different stages of flower bud differentiation is an important factor in orchard management for example water stress in this time can be lead to decrease product and increase fruit disorder as double fruit and deep suture percent in next year (Handley and Scott Johnson, 2000).
Figure 1. Stage 1: undifferentiated meristematic apex (M) (sampled, June 15, 2013)
Figure 2. Stage 2: flatting of doming meristem-receptacle primordium (R) (sampled, June 30, 2013)
Figure 3. Stage 3: leaves primordium (L), sepal primordial(S)-petal primordial (Pe) (sampled, July 15, 2013)
Measurements and determinations
Light penetration within tree canopy and between rows Light intensity (Lux) was measured one time weekly between 9-10 a.m from February to June using Luxmeter (Pu-150) within the canopies of the trees adjacent to the south side from axis (marked positions) at 3 levels: 0.5, 1.0 and 1.5 m from the top of trees, then mean values were used for estimating light penetration at different distances as a percent of full illumination at the top of the tree according to Barritt et al. (1987).
Some vegetative growth parameters
Four main branches 2 years old on each tree in different directions were labeled. All shoots which were developed on these branches were counted and used for measuring Some vegetative growth parameters i.e. length and number of the new shoot were recorded at the end of each season, the
average length of nine shoots were recorded., then total shoot growth (average shoot length × number of shoots/one-year old branch). At mid July, Thirty mature mid – shoot leaves were sampled measuring leaf area by using leaf area meter model. Li 3100 area meter (LI-COR, Inc., Lincoln, Nebraska, USA). Leaves were dried and weighted to get leaf dry weight (g) and then, specific leaf weight (SLW) was calculated as (mg/cm2) (mean leaf dry weight/average leaf area) according
to (Ferre and Forshey 1988). Also, number of leaves per fruit (leaf/fruit ratio) was also estimated.
Chemical analysis
Leaf chlorophyll and mineral content
Fresh leaf samples were taken from each replicate to determine chlorophyll a, b and then total value was calculated according to Moran (1982). In mid July of both seasons, fifty mature mid shoot leaves per tree were sampled, Table 1:Some chemical and mechanical analysis of experimental soil.
Chemical analysis Depth
Soluble anions meq/l Soluble cations meq/l
EC (d∙sm-1)
PH
(1:5 extract) Hco Cl- So4
--3 -Co3 --Ca++ Na+ Mg++ K+ 0.92 0.58 2.21 0.0 1.30 0.65 1.58 0.18 0.40 8.96 0-30 cm 0.86 0.46 2.08 0.0 1.45 0.59 1.20 0.16 0.34 8.92 30-60 cm Mechanical analysis, % Soil texture Total silt Clay Total sand Fine sand Medium sand Course sand Depth Sandy 2.64 4.10 93.26 44.51 23.32 25.43 0-30 cm Sandy 2.82 3.64 93.54 44.28 24.91 24.35 30-60 cm
Table 2: Summary of used treatments
NO. Treatments Control (T1) T2 T3 T4 T5 T6 T7 T8
: - Thinning out 25% (p1) +fruit thinning 5 cm (FT1) at 30days after full bloom + no foliar spray (spraying water only) : - Thinning out 35%(p35) + FT1 5 cm at 30 days after full bloom + no foliar spray
: - p1 + FT2 15 cm at 20 days after full bloom + no foliar spray : - p2 + FT2 15 cm at 20 days after full bloom + no foliar spray
: - p1 + FT1 5 cm at 30 days after full bloom + foliar spray with two compounds (super grow 0.3% and potassium silicate 0.1%) : - p2+ FT1 5 cm at 30 days after full bloom + foliar spray with two compounds (super grow 0.3% and potassium silicate 0.1%) : - p1 + FT2 15 cm T at 20 days after full bloom + foliar spray with two compounds (super grow 0.3% and potassium silicate 0.1%) : - p2+ FT2 15 cm at 20 days after full bloom + foliar spray with two compounds (super grow 0.3% and potassium silicate 0.1%)
Where:
P1: Thinning out 25% (p) by removing 25% of one year old shoots per tree at dormant (20th and 25th November) in 2014 and 2015 seasons, respectively.) P2: Thinning out 35% (p) by removing 35% of one year old shoots per tree. (at dormant (20th and 25th November) in 2014 and 2015 seasons, respectively.) FT1: Hand fruit thinning 5 cm at 30 days after full bloom
FT2: Hand fruit thinning 15 cm at 20 days after full bloom
No foliar spray: NO foliar application of potassium silicate and super grow (sprayed with water only)
Foliar spray: Foliar application of potassium silicate (25% S +10% K2O)at 0.1% and super grow compound (20% N + 20% P2O5+20% K2O)at 0.3% sprayed five times during each growing season at fruit set, the second fruit Development stage, the beginning of the fruit color change and twice after month from harvest.
then washed three times with tap water, then washed again by distilled water. Samples were oven dried at 70 0C to
constant weight, ground, digested with sulpharic acid and hydrogen peroxide for the determination of N, P, K, Ca, Mg, Nitrogen percentage was estimated by micro – kjeldahl Gunning method (A.O.A.C., 1985). Phosphorus percentage was determined colorimetically by the hydroquinone method (Foster and Cornelia, 1967). Potassium concentration was estimated by flame photometer E. Elmodel (Jackson, 1967). Calcium, magnesium and manganese were determined by using perkin Elmer Atomic Absorption Spectrophotometer Model 2380 Al, according to (Jackson and Ulrich, 1959) and (Yoshida et al., 1972). All macro elements were expressed as percent of dry weight.
Yield values
Yield data were determined in terms of: Number and weight of fruit (kg) per tree and yield efficiency (YE) as fruit weight and number fruit per (cm2) of trunk cross section area
(TCSA) as kg/cm2, also kg.m-3 canopy volume and kg/m2 of
planting distance.
Fruit Quality
Physical fruit characteristics
Sample of 20 mature fruits were randomly harvested from each replicate tree at the harvest time (May) and used for determining average fruit weight (gm), size (cm3),
Length (cm), Diameter (cm), fruit shape (L/D),flesh weight, stone weight, flesh/stone ratio, skin and flesh firmness using pentameter pressure tester Lb/inch2. Color of the
fruit was quantified at tristimulus colorimetery data (l,a,b) using a Hunter colorimeter (Hunter lab. D 25L), color was represented by L* (lightness), a* (green-red) and b*(blue-yellow) scale readings. The hue angle (h0) was calculated
from arctangent b/a.the hue was represented as 00
=red-purple, 900=yellow, 1800=bluish-green
and 2700= blue. Chroma was calculated as
(a*2+b*2)1/2 (McGuire,1992 and Voss,1992).
Chemical fruit characteristics
10 fruits of each replicate were used to determine each of the following characters: total soluble solides of fruit juice (T.S.S %) using a hand refractometer, fruit acidity (%) as malic acid according to (A.O.A.C., 1985), skin anthocyanin content (mg/gms F.W) by using Carl-Zeiss Spectrophotometer according to (Husia et al., 1965) and Vitamin C content (ascorbic acid) was detemined as mg/100 ml/of juice by titrating 5 ml. of the
juice with 2-6 di chlorophenol indopheol blue dye (Cox and Pearson, 1962).
Percentage of double fruit and deep suture
Percentage of double fruit at thinning time was calculated on 9 shoots per tree final deep sutures percent was determined by evaluating every fruit harvested in the third week of May (Handly and Johnson, 2000).
Economic evaluation
Economic evaluation for different applied treatments was compared according on the current prices under conditions of this study.
Results and discussion
Light penetration within tree canopy
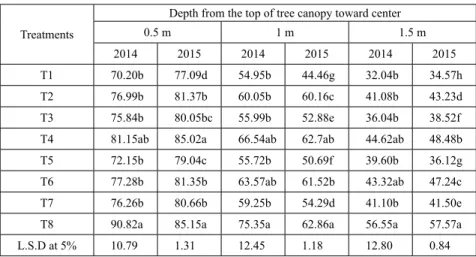
Data presented in Table 3 showed that the percentage of light penetration at different vertical depth from the top of tree canopy (0.5, 1.0 and 1.5 m) as affected by the conducted treatments in 2014 and 2015 seasons. The data revealed that increasing the depth from the top of desert red peach tree canopy toward center decreased the light penetration percentage . In most cases, the treatments including the high level of thinning out (P 35%) had a tendency to increase this percentage at different distances from the top of peach canopy. In this respect, higher values were obtained by the T8 and T4 treatments than other treatments encompassing control. The difference among treatments was significant. These results are in line with the findings of Mika (1986) on apple, indicated that light penetration had been enhanced by thinning out pruning. Also, Mikhael et al. (2012) on Desert red peach trees, proved that high level of thinning out improved the percentage of light penetration as compared to low levels.
Table 3: Light penetration within tree canopy
Depth from the top of tree canopy toward center
Treatments 0.5 m 1 m 1.5 m 2015 2014 2015 2014 2015 2014 34.57h 32.04b 44.46g 54.95b 77.09d 70.20b T1 43.23d 41.08b 60.16c 60.05b 81.37b 76.99b T2 38.52f 36.04b 52.88e 55.99b 80.05bc 75.84b T3 48.48b 44.62ab 62.7ab 66.54ab 85.02a 81.15ab T4 36.12g 39.60b 50.69f 55.72b 79.04c 72.15b T5 47.24c 43.32ab 61.52b 63.57ab 81.35b 77.28b T6 41.50e 41.10b 54.29d 59.25b 80.66b 76.26b T7 57.57a 56.55a 62.86a 75.35a 85.15a 90.82a T8 0.84 12.80 1.18 12.45 1.31 10.79 L.S.D at 5%
Some vegetative parameters
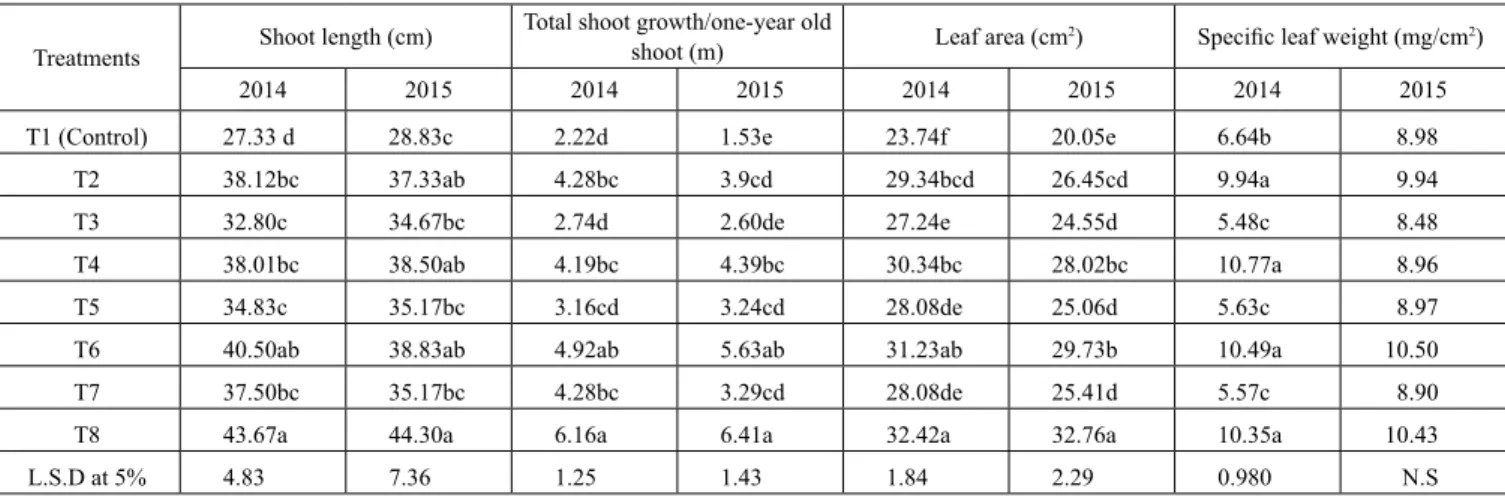
Pointing the specific effect of the conducted treatments on some vegetative growth parameters i.e. ( shoot length, total shoot growth/ one-year old shoot and leaf area) as shown in Table 4, in both seasons, the variation among the treatments was significant, the T8 and T6 treatments succeeded in enhancing these parameters value as compared with control. As for specific leaf weight, the difference among the evaluated treatments was significant in first season only and the highest values belonged to T8,T6,T4,T2 without significant difference among them in comparison with the rest treatments including the control. In general, the treatments involving high level of thinning out pruning resulted in significant increments in these considered parameters(shoot length, total shoot growth/ one-year old shoot, leaf area and specific leaf weight). This positive effect could be attributed to increase the
penetration of photosynthetic active radiation (Propiglia and Barden, 1981) and increase in shoot hormone levels (cytokinins, auxins and gibberellins) that can improve these parameters (Tworkoshi et al., 2006). These results are in harmony with those obtained by Zayan et al. (2002) on apple and Mikhael et al. (2012) on Desert red peach trees, they indicated that raising severity of thinning out improved leaf and shoot parameters. As for the effect of treatments on leaf/fruit ratio, in both seasons, control trees attained significantly lower value than T8 which presented higher effect than all rest treatments. Treatments including wider fruit thinning space( 15 cm distance) done early at 20 days after full bloom (DAFB) tended to increase this ratio in comparing with the other treatment with narrower space (5 cm distance) at 30 DAFB. These results agree with those obtained by Zayan et al. (2015) on Florida prince, revealed that higher levels of hand fruit thinning increased the leaf/ fruit ratio (Fig 4).
Table 4: Effect of different thinning out, fruit thinning and foliar spray treatments on some vegetative parameters of “ Desert Red “ peach trees in 2014 and 2015
Specific leaf weight (mg/cm2)
Leaf area (cm2)
Total shoot growth/one-year old shoot (m) Shoot length (cm) Treatments 2015 2014 2015 2014 2015 2014 2015 2014 8.98 6.64b 20.05e 23.74f 1.53e 2.22d 28.83c 27.33 d T1 (Control) 9.94 9.94a 26.45cd 29.34bcd 3.9cd 4.28bc 37.33ab 38.12bc T2 8.48 5.48c 24.55d 27.24e 2.60de 2.74d 34.67bc 32.80c T3 8.96 10.77a 28.02bc 30.34bc 4.39bc 4.19bc 38.50ab 38.01bc T4 8.97 5.63c 25.06d 28.08de 3.24cd 3.16cd 35.17bc 34.83c T5 10.50 10.49a 29.73b 31.23ab 5.63ab 4.92ab 38.83ab 40.50ab T6 8.90 5.57c 25.41d 28.08de 3.29cd 4.28bc 35.17bc 37.50bc T7 10.43 10.35a 32.76a 32.42a 6.41a 6.16a 44.30a 43.67a T8 N.S 0.980 2.29 1.84 1.43 1.25 7.36 4.83 L.S.D at 5%
Leaf chlorophyll and macro-elements content
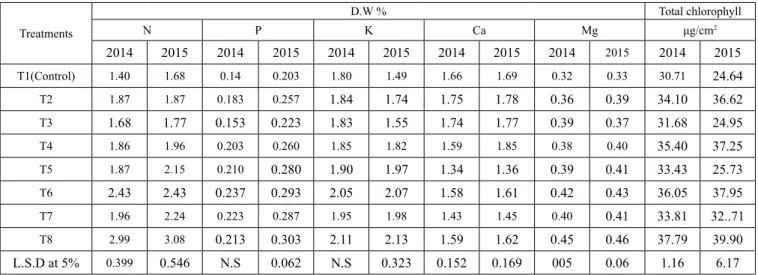
Significant variation was observed among all evaluated treatments in respect of total leaf chlorophyll value. The results depicted in Table (5) exhibited that leaf chlorophyll content was increased in severely-pruned trees (35%) in the T8,T6,T4 and T2 treatments as compared to the control which had light pruning degree (25%). The increase in leaf chlorophyll might be resulted from modifying the top/ root ratio which enhanced the nutrients absorption via the root and transfer them to the leaves which contribute in the formation of chlorophyll molecular (Jundi, 2003 ) or the nitrogen which sprayed to trees leaves participate in building new chlorophyll molecular which led to increase chlorophyll percentage in leaves. These conclusions were also reported by Dinkova (1997) working on “Strinava” plums, Al-Rawi et al. (2011) on apricot cv. Zaini and Zayan et al. (2015) on “Florida Prince” peach cultivar proved that the most pronounced effect in improving chlorophyll value was observed with the high levels of thinned out trees.
Leaf N content was significantly affected by all conducted treatments in both seasons, whereas the T8 treatment had a remarkably effect than all treatments including the control. Similar results were obtained by Abd El-Razek and. Saleh (2012) on Florida Prince peach and Mosa et al. (2015) on Anna apple.
As for leaf phosphorous and K content, it was insig-nificantly influenced by the different applied treatments in the first season. In the second season, there were significant effects among the evaluated treatments. The T8, T7, T6, and T5 treatments which received foliar application with nitrogen, phosphorous and K, recorded remarkably higher values than the control. The obtained results are in line with the results of Zayan et al. (2015) on Florida prince peach and Dbara et al. (2016) on peach cv. “Flordastar”, reported that potassium leaf content was high in foliar potassium spray (K+) treatments.
The results of both seasons in Table (5) revealed that the control, T2, T3 and T4 treatments recorded the lowest significant leaf Ca value in comparing the rest treatments in most cases. It was observed that calcium leaf content was lower with foliar application treatments (T5,T6,T7 and T8). These results are in harmony with those of Mosa et al. (2015) on Anna apple. As for leaf Mg %, in both seasons, the trees of the control and T3 had significantly lower effect than the T8 treatment, the latest presented the same effect as the T6,T7 in the first season as well as T5,T4,T2 In the second one. However, a tendency for higher Mg content was seen in the samples from foliar application treatments in most cases. These conclusions are in agreement with the results of Zayan et al. (2015) on peach .From the above mentioned results, the increase in the contents of N, P, K, and Mg in the Desert red peach leaves was due to the foliar application with potassium silicate (25% S +10% K2O)at 0.1% and super
grow compound (20% N + 20% p2O5+20% K2O) at 0.3%.
Regarding to leaf N/K ratio, the difference among treatments was significant only in the first season, the highest ratio belonged to T8 treatment in comparison to other treatments involving the control except T6. Similar results were obtained by Arora et al. (1999) on peach and . As for leaf N/Ca+Mg ratio, in both seasons, T8 recorded higher values than control and other treatments except T5 and T7 in the second season. The variation among the tested treatments was significant in both season (Fig 5).
Yield
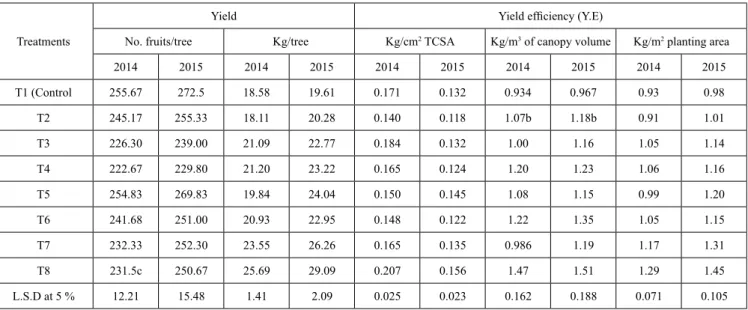
With regard to the influence of the evaluated treatments on desert red peach yield as number of fruits/tree, the data in both seasons in Table (6) indicated that the control and T5 trees carried significantly the highest number of fruits/ tree with respect to other treatments due to the low degree of fruit thinning, it was observed that increasing space of fruit thinning with severe pruning reduced significantly the number of fruits/tree. Similar results were obtained by Table 5: Effect of different thinning out, fruit thinning and foliar spray treatments on leaf chlorophyll and macronutrients content
of “ Desert Red “ peach trees in 2014 and 2015.
Total chlorophyll D.W % Treatments N P K Ca Mg μg/cm2 2015 2014 2015 2014 2015 2014 2015 2014 2015 2014 2015 2014 24.64 30.71 0.33 0.32 1.69 1.66 1.49 1.80 0.203 0.14 1.68 1.40 T1(Control) 36.62 34.10 0.39 0.36 1.78 1.75 1.74 1.84 0.257 0.183 1.87 1.87 T2 24.95 31.68 0.37 0.39 1.77 1.74 1.55 1.83 0.223 0.153 1.77 1.68 T3 37.25 35.40 0.40 0.38 1.85 1.59 1.82 1.85 0.260 0.203 1.96 1.86 T4 25.73 33.43 0.41 0.39 1.36 1.34 1.97 1.90 0.280 0.210 2.15 1.87 T5 37.95 36.05 0.43 0.42 1.61 1.58 2.07 2.05 0.293 0.237 2.43 2.43 T6 32..71 33.81 0.41 0.40 1.45 1.43 1.98 1.95 0.287 0.223 2.24 1.96 T7 39.90 37.79 0.46 0.45 1.62 1.59 2.13 2.11 0.303 0.213 3.08 2.99 T8 6.17 1.16 0.06 005 0.169 0.152 0.323 N.S 0.062 N.S 0.546 0.399 L.S.D at 5%
Abeer T. Mohsen (2010) on Flordaprince and Desert Red peaches cultivars, and Deshmukh et al. (2012) on peach cv. Flordasun. Mikhael et al. (2012) on Desert red peach trees, revealed that pruning treatment significantly reduced fruit number and the reduction was increased as the severity of pruning increased.
As for the yield as kg/tree, in both seasons, the highest significant yield was weighed with T8 treatment in comparison to the remaining treatments, followed by T7 treatment. The control and T2 treatments recorded the lowest yield without significant difference between them. These results are in harmony with those of Zayan et al. (2015) on peach cv Florida prince and El-Boray et al. (2013) who reported that hand blossom thinning(HBT) of Florida prince peach trees at 15 cm was the best treatment for yield per
feddan (6.08 tons for both seasons) as compared to control and the low or high level of HBT (at 10 and 20 cm).The resulted increase in yield as kg/tree could be attributed to the increase in fruit weight resulting from the effect of widening fruit thinning space with heavily pruning degree.
As for yield efficiency (Y.E), in both season, the T8 treatment gave higher Y.E value whether as kg/m3 of canopy
volume or kg/m2 planting area than control and other
treatments except T6 in the second season, as shown in Table 6.Concerning yield efficiency as Kg/cm2 TCSA, in the
first season T8 recorded higher value than other treatments including the control except T3, while in the second one, the control and T8 were statistically equal. The obtained results are in line with those of Osborne and Robinson (2008) on ‘Rising Star’ peach variety.
Fig 5: Effect of different thinning out, fruit thinning and foliar spray treatments on leaf N/K and N/Ca+Mg ratio of “ Desert Red “ peach leaves in 2014 and 2015.
Table 6: Effect of different thinning out, fruit thinning and foliar spray treatments on yield of “ Desert Red “ peach trees in 2014 and 2015.
Treatments
Yield Yield efficiency (Y.E)
No. fruits/tree Kg/tree Kg/cm2 TCSA Kg/m3 of canopy volume Kg/m2 planting area
2014 2015 2014 2015 2014 2015 2014 2015 2014 2015 T1 (Control 255.67 272.5 18.58 19.61 0.171 0.132 0.934 0.967 0.93 0.98 T2 245.17 255.33 18.11 20.28 0.140 0.118 1.07b 1.18b 0.91 1.01 T3 226.30 239.00 21.09 22.77 0.184 0.132 1.00 1.16 1.05 1.14 T4 222.67 229.80 21.20 23.22 0.165 0.124 1.20 1.23 1.06 1.16 T5 254.83 269.83 19.84 24.04 0.150 0.145 1.08 1.15 0.99 1.20 T6 241.68 251.00 20.93 22.95 0.148 0.122 1.22 1.35 1.05 1.15 T7 232.33 252.30 23.55 26.26 0.165 0.135 0.986 1.19 1.17 1.31 T8 231.5c 250.67 25.69 29.09 0.207 0.156 1.47 1.51 1.29 1.45 L.S.D at 5 % 12.21 15.48 1.41 2.09 0.025 0.023 0.162 0.188 0.071 0.105
Fruit quality
Fruit physical characters
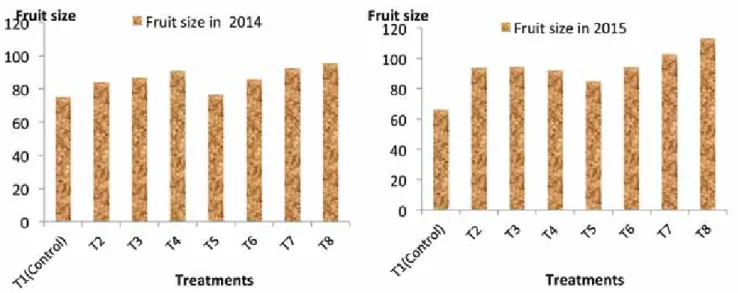
The data concerning the effect of different tested treatments on fruit weight and size of “Desert red“ peach presented in Table (7) and Fig (6) cleared that early heavily-thinning (15 distance between fruits at 20 DAFB), severe pruning and foliar application presented the superior effect in this respect, in both seasons. The highest value always belonged the T8 treatment, followed by T7. Meanwhile, the control and T5 gave the lowest value in the first season, while the T1 (control) treatment only recorded the least weight and size in the second one. The increase in fruit weight and size as a consequence of high level of fruit thinning which in turn led to improve leaf/fruit ratio. Thus increasing the availability of photosynthates and nutrients to the remaining fruits thereby increasing the weight and size of individual fruits. Also, the increase in weight could be due to utilization
of whole food materials among the fewer fruits recorded under severe pruned trees. In addition the role of potassium in encouraging translocation complex sugars, may cause modifying in osmotic pressure of the fruits and increase both weight and size. Similar results were obtained by Sarkadi (2012) on “Spring Lady” and “Maja” peach trees, El-Boray et al. (2013) and Zayan et al. (2015) on Florida prince peach, they concluded that fruit weight and size were improved when the distance between the fruits on the mixed branch was increased.
Regarding to fruit firmness, conversely, the treatments that received narrower fruit thinning at 5 cm between fruits which done after 30 DAFB(days after full bloom) gave higher values than those contained wider fruit thinning space (15 cm) conducted after 20 DAFB. In this respect, the control, T2, T5 and T6 increased fruit firmness comparing with the remaining treatments. The reduction in fruit firmness resulted from larger fruit size which in turn decreases the strength of cell wall. Data in Fig (6 )support this explanation
Fig 6: Effect of different thinning out, fruit thinning and foliar spray treatments on fruit size of “ Desert Red “ peach trees in 2014 and 2015.
Table 7: Effect of different thinning out, fruit thinning and foliar spray treatments on some fruit physical properties of “ Desert Red “ peach trees in 2014 and 2015
Fruit firmness Ib/in2
Fruit shape (L/D) Fruit diameter (cm) Fruit length (cm) Fruit weight (g) Treatments 2014 2015 2014 2015 2014 2015 2014 2015 2014 2015 15.12 16.63 1.22 1.17 5.53 5.17 6.72 6.06 71.95 72.67 T1(Control) 14.42 15.34 0.965 1.03 6.11 5.30 5.88 5.47 79.38 74.03 T2 12.74 13.33 1.04b 1.07 5.78 5.29 5.99 5.65 95.31 93.19 T3 12.65 12.31 0.922 0.975 6.15 5.44 5.68 5.29 101.02c 95.28 T4 15.11 16.25 1.05 1.09 5.79 5.18 6.07 5.69 89.42 77.96 T5 15.11 15.77 0.949 0.986 6.14 5.37 5.82 5.29 91.54 86.62 T6 12.51 12.28 0.964 1.04 6.1 5.26 5.88 5.49 104.05 101.38 T7 11.97 11.64 0.821 0.955 6.57 5.49 5.39 5.24 116.02 110.96 T8 1.71 1.73 0.101 0.102 0.423 N.S 0.484 0.399 6.96 7.16 L.S.D at 5%
meaning that fruit size and fruit firmness are negatively and significantly correlated in both seasons at level 0.05, the value of Correlation coefficient (r) was -0.927 and -0.726 in 2014 and 2015 season, consecutively (p value 0.707). The present results are in close conformity with the findings of Abeer T. Mohsen, (2010) on “Florda prince and Desert Red” Peaches, Deshmukh et al. (2012) and Meitei et al. (2013), on peach cv. Flordasun, El-Boray et al. (2013) on “Florida prince “peach, they indicated that increasing the distance between fruits by early fruit thinning reduced fruit firmness.
As for fruit dimension, in both seasons, the highest fruit length (L) was obtained by control which had light pruning (25%) in comparison with all rest treatments except T3 and T5 (25%) in the first season. This might be due to the fact that under light pruning there was less light penetration and auxin level causes organ cells on the dark side to elongate under light pruning. The average of fruit diameter (D) was significantly affected in the second season only. The heavily- pruned trees (35%) in T8 treatment had the highest significant effect comparing with the other treatments except,T4 and T6 treatments which had the same degree of pruning. Also, it was observed that there was a progressive increase in fruit diameter with the increasing fruit thinning space, severity of pruning and early fruit thinning at 20 days after full bloom. As for L/D ratio, it takes similar trend as observed in fruit length. These results are in harmony with those obtained by Olmstead et al. (2011), on different varieties (‘Flordaprince’, ‘Tropicbeauty’ and ‘UFBeauty’), Deshmukh et al. (2012), on peach cv. Flordasun and Mikhael et al. (2012) on Desert red peach.
Chemical fruit properties
Data in Table (8) showed that the significant variation was observed among all evaluated treatments in both seasons. Fruit soluble solids content (SSC) and SSC/Acid ratio were higher in fruits received early heavily-thinned trees (T8, T7,T4 and T3) as compared to late lightly-thinned one (the control, T2, T5, T6). In most cases, increasing fruit thinning space between fruits on one-year old shoot from 5 cm to 15 cm apart and doing it early at 20 DAFB with applying
foliar spray enhanced these parameters. Improvement the soluble solids content could be attributed to increasing leaf/fruit ratio,leading to more accumulation of sugars in the developing fruits. In addition, the pivotal importance of potassium in quality formation stems from its role in enhancing synthesis of photosynthates and their transport to fruit (Rania . A. Taha et al., 2014).
In regard to fruit acidity, it was significantly affected only in the second season It was observed that fruit acidity % tended to be lower for trees treated with fruit thinning 20 DAFB at 15 cm between fruits(T8,T7,T4 and T3). Reduction
in acidity might be attributed to the increase in fruit size, this conclusion find support in the data presented in Fig (6). Similar results were obtained by Abeer T. Mohsen, (2010) on Florida prince and Desert red cultivar and El-Boray et al. (2013) on Florida prince peach cultivar. In contrary, those treatments (T8,T7,T4 and T3) had significant effect on
fruit vitamin c content than other treatments(the control, T2,T5,T6) which recorded the least value in this respect without significant difference among them. Increasing in ascorbic acid might be due to the increase in leaf /fruit ratio (as shown in Fig 4). The obtained results agree with the findings of Deshmukh et al. (2012) on peach cv. Flordasun, mentioned that the ascorbic acid content was recorded the highest value with 55:1 leaf fruit ratio treatment followed by 45:1 while the lowest content was recorded in control. Fruit color
Hunter color values (L, a, b, Hue and chroma)
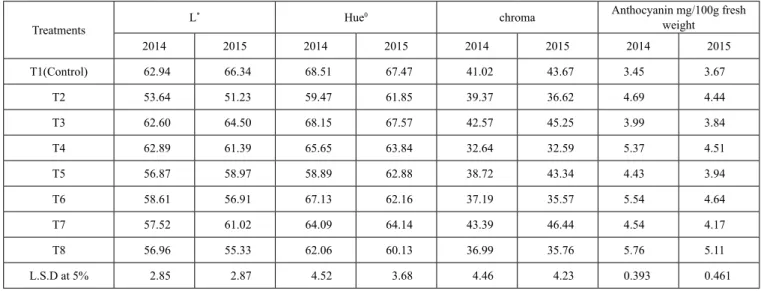
Color parameters of Desert red peach samples are shown in Table 9. Lightness of desert red peach was affected significantly by all tested treatments in both seasons. Lower lightness value (fruit became darker)was lesser with the T2,T8, T5,T6 as well as T4 treatments in the second season only
than the control which showed similar effect as T3. It was
clear that darker fruit were obtained by increasing pruning severity in most cases. As for a * values(redness), In most cases, the T8,T7 gave higher increase than control which had the same effect as the T3,T4 and T6 treatments in the two
experimental seasons. With regard to color reflectance for Table 8: Effect of different thinning out, fruit thinning and foliar spray treatments on some fruit chemical properties
of “ Desert Red “ peach trees in 2014 and 2015
Vitamin c (mg/100 ml juice) SSC/Acid ratio Acidity % SSC % Treatments 2015 2014 2015 2014 2015 2014 2015 2014 5.75 5.72 7.54 10.48 1.29 0.938 9.47 9.73 T1(Control) 7.03 5.87 8.12 11.93 1.19 0.889 9.63 9.80 T2 7.87 6.93 13.41 13.67 0.809 0.826 10.70 11.14 T3 8.37 7.18 15.73 13.62 0.790 0.820 11.60 11.13 T4 6.47 5.42 8.25 11.00 1.22 0.916 9.73 10.00 T5 6.29 6.32 8.17 11.99 1.21 0.887 9.67 10.60 T6 8.67 6.99 17.70 16.20 0.659 0.720 11.63 11.50 T7 8.87 8.41 18.91 17.42 0.637 0.703 11.90 12.06 T8 1.35 1.33 4.12 3.91 0.292 N.S 1.39 0.933 L.S.D at 5%
yellowness (b* value), fruits from control trees enhanced this value in comparison to T2,T4,T6,T8 treatments during both seasons. Moreover, there were no significant difference among the control, T3 and T7 treatments .It was observed that increasing thinning out pruning severity degree from 25% to 35% registered lowest hue angle(fruit became more red and less yellow) and reduced chroma (brightness or color intensity).Accordingly, heavily-pruned trees(35%) in the T8,T4,T2,T6 treatments resulted in lower values than control in this respect in most cases. The improvement in color values could be attributed to the important role of pruning in increasing the degree of light penetration which in turn accelerate higher accumulation of pigments responsible for the fruit color. Similar results were obtained by Lewallen (2000) ‘Norman’ and ‘Cresthaven’ peach, found that position of the fruit on the tree also affected fruit quality characteristics; peaches from the medium pruning intensity and outer canopy were redder and darker than those from the lower canopy . Furthermore, Mikhael et al. (2012) on Desert red peach cultivar who revealed that increasing pruning intensity degree increased the percentage of skin red color. Anthocyanin
The data of the two experimental seasons concerning fruit anthocyanin content, in Table (9) cleared that it was significantly varied by different tested treatments. Fruits from trees treated with thinning out pruning 35% + fruit thinning 15 cm at 20 days after full bloom + foliar spray with two compounds (super grow 0.3% and potassium silicate 0.1% (T8) produced maximum value in comparison with all other treatments including the control except T6,T4 in the first season.. Increasing anthocyanin content could be explained by the degree of pruning which allows fruits to be exposed to large amount of light, causing the accumulation of color
compounds. In addition the role of potassium in enhancing anthocyanin accumulation and red coloration by encouraging translocation complex sugars that important for anthocyanin synthesis to fruits (Ritenour and Khemira, 1997), also the effect of heavily-fruit thinning in increasing L/F ratio may be effective in anthocyanin concentration in peach fruits .These conclusions find support in the results of Samira, M. Mohamed et al., 2014) and Zayan et al. (2015) on Florida prince peach cultivar, they reported that anthocyanin content of Florida Prince’ peach fruits enhanced by increasing severity of pruning treatments. Moreover, Deshmukh et al. (2012) revealed that increasing the leaf/fruit ratio to some extent (45:1) improved anthocyanin content of “Flordasun “peach fruit.
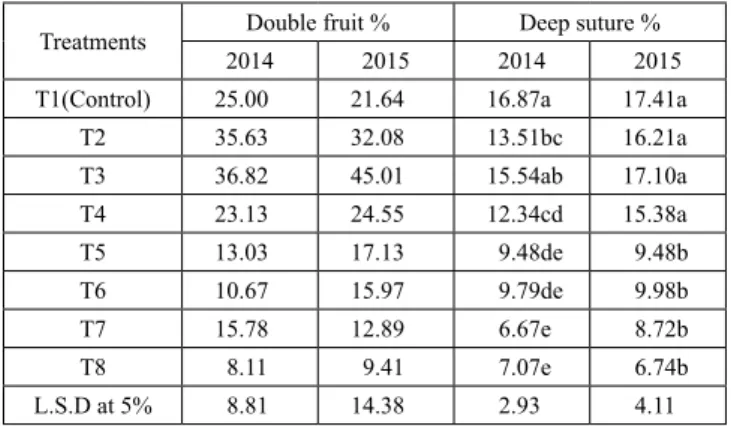
Physiological disorders; Double fruit and deep sutures % The data presented in Table (10) demonstrated that there were significant difference among the evaluated treatments on the percentage of double fruit and deep sutures disorders. In addition, there was a noticeable trend that foliar application treatments reduced the incidence of double fruit and deep suture, this reduction reached the least values with the T8,T7,T6and T5 treatments in most cases during both seasons. The reduction in double fruit and deep sutures % might be attributed to potassium’s role in drought tolerance by improving water-use efficiency, leaf water content and reducing transpiration rates (Arquero et al., 2006). These data support the fact that high temperatures and water stress during the early stages of the morphological pistil differentiation have a limiting factor for double fruit disorder incidence.( Handley and Johnson (2000) and Engin & Unal (2005). Both disorders in Desert red peach variety could be managed by the balanced irrigation regime, particularly at the time of bud differentiation.
Table9: Effect of different thinning out, fruit thinning and foliar spray treatments on fruit color of “ Desert Red “ peach trees in 2014 and 2015. Anthocyanin mg/100g fresh weight chroma Hue0 L* Treatments 2015 2014 2015 2014 2015 2014 2015 2014 3.67 3.45 43.67 41.02 67.47 68.51 66.34 62.94 T1(Control) 4.44 4.69 36.62 39.37 61.85 59.47 51.23 53.64 T2 3.84 3.99 45.25 42.57 67.57 68.15 64.50 62.60 T3 4.51 5.37 32.59 32.64 63.84 65.65 61.39 62.89 T4 3.94 4.43 43.34 38.72 62.88 58.89 58.97 56.87 T5 4.64 5.54 35.57 37.19 62.16 67.13 56.91 58.61 T6 4.17 4.54 46.44 43.39 64.14 64.09 61.02 57.52 T7 5.11 5.76 35.76 36.99 60.13 62.06 55.33 56.96 T8 0.461 0.393 4.23 4.46 3.68 4.52 2.87 2.85 L.S.D at 5%
Table (10): Effect of different thinning out, fruit thinning and foliar spray treatments on two physiological disorders; Double fruit and deep sutures %
of “Desert Red “ peach trees in 2014 and 2015. Deep suture % Double fruit % Treatments 2015 2014 2015 2014 17.41a 16.87a 21.64 25.00 T1(Control) 16.21a 13.51bc 32.08 35.63 T2 17.10a 15.54ab 45.01 36.82 T3 15.38a 12.34cd 24.55 23.13 T4 9.48b 9.48de 17.13 13.03 T5 9.98b 9.79de 15.97 10.67 T6 8.72b 6.67e 12.89 15.78 T7 6.74b 7.07e 9.41 8.11 T8 4.11 2.93 14.38 8.81 L.S.D at 5% Economic evaluation
Economic evaluation of the tested treatments in this study was done to put light on the best treatment obtained to be recommended for peach growers. The evaluation depended on estimating the total costs, crop value and net income per feddan, as shown in Tables (11 & 12). Total costs
include prices of (potassium sulphate, ammonium nitrate, phosphoric acid, magnesium sulphate, chelates nutrients, potassium silicate, pesticides, harvest cost, maintenance and fuel irrigation machine, thinning out and fruit thinning costs). The results showed that, total costs/fed for the control, T2, T3 and T4 treatments (2354.38 L.E) were similar and lower than the total costs in the T5, T6,T7 and T8 treatments (2665.63 L.E) which were the same due to the cost of foliar application with potassium silicate and super grow substances.. Concerning crop value /fed., the highest record was obtained from trees treated with thinning out 35% + Fruit thinning at 15 cm at 20 days after full bloom + foliar spray with two compounds (super grow 0.3% and potassium silicate 0.1% (T8). This value reached (34619.44 & 38596.92 L.E/Fed.) while the lowest record resulted from the treatment No. 1 (the control) (15608.47 & 18.527.92L.E/Fed) in both seasons, respectively. Concerning, net income /fed., the treatment No. 8 gave the higher return (35104.23& 40100.51 L.E/Fed) whereas the lowest return resulted from the control treatment (13255.09 & 16173.54L.E) in 2014 and 2015 seasons, respectively. Thus, it could be concluded that the greatest return came from treatment No. 8 which improved fruit qualities, increased net income per/fed (Table 12). Table 11: The current prices of all production materials used under this study
Material Price (L.E)
• 1 L potassium silicate (4 L/fed)
• 100g of super grow compound (1.312 kg/fed) • Labor costs
• Costs of maintenance and fuel irrigation machine
• Pesticides costs including (Sidial, mineral oil, Oxy chloro copper, Malathion chelated fertilizers Costs
• costs of fertilizers including ( potassium sulphate + ammonium nitrate + phosphoric acid + Magnisium sulphate) • 1 ton fruit yield of T8 and T7
• 1 ton fruit yield of control • 1 ton fruit yield of T4
• 1 ton fruit yield of T3, T5 and T6
45 10 630 114.8 310 91.56 768.02 7000 4000 (2014) & 4500 (2015) 6000 5000
Table 12: Economic evaluation of the evaluated treatments (L.E/Fed) in 2014 and 2015.
Net income/ fed Crop value/fed Total costs/fed Calculated Cost/fed Treatments 2015 2014 2015 2014 Other costs Used treatments 16173.54 13255.09 18.527.92 15608.47 2354.38 1724.38 630 T1 (Control 18937.75 16657.96 21292.13 19012.34 2354.38 1724.38 630 T2 21554.59 19786.52 23908.97 22140.90 2354.38 1724.38 630 T3 26898.75 24355.74 29253.13 26710.12 2354.38 1724.38 630 T4 22583.08 18166.25 25248.71 20831.88 2665.63 1724.38 941.25 T5 21436.83 19308.01 24102.46 21973.64 2665.63 1724.38 941.25 T6 35931.29 31953.81 38596.92 34619.44 2665.63 1724.38 941.25 T7 40100.51 35104.23 42766.14 37769.866 2665.63 1724.38 941.25 T8
Conclusion
Based on the obtained results in this study, it could be concluded that application of thinning out pruning 35%, fruit thinning by leaving 15 cm between fruits on one-year old shoot at 20 days after full bloom and foliar application of potassium silicate and super grow compound which sprayed five times during each growing season at fruit set, the second fruit development stage, the beginning of the fruit color change and twice after month from harvest was the most profitable treatment for peach trees grown under conditions of this investigation. This treatment (T8) is recommended for peach growers to obtain the best vegetative growth, maximum fruit yield with good quality fruits, higher crop value with high net income /fed. from Desert red peach trees, in addition, reducing the percentage of double fruit and deep suture disorders by more than 50% in both seasons.
References
Abd El-Megeed, N.A.M. (2001): Effect of hand and chemical
thinning on yield, fruit quality, storage and marketability of some peach varieties. Ph. D. Thesis, Alex. Univ. Alex. Egypt.
Abd El-Razek, E. and M.M.S. Saleh. (2012): Improve productivity and fruit quality of Florida prince peach trees using foliar and soil applications of amino acids. Middle-East J. Sci. Res., 12 (8): 1165-1172.
Abeer T. Mohsen. (2010): Thinning Time and Fruit Spacing
Infuence on Maturity, Yield and Fruit Quality of Peaches. Journal of Horticultural Science & Ornamental Plants 2 (3): 79-87.
Al-Rawi, A.W., A. M. Helmi, N. A. Jasim and F. F. Jomaa. (2011).
Effect of winter pruning and Enfaton on yield and carbohydrates content of branches of apricot. The Iraqi Journal of Agricultural Sciences 42 (2): 35-70.
A.O.A.C. (1985): Association of Official Agriculture Chemistry, Official Methods of Analysis. Washington, D.C., U.S.A.
Arora R.L., S. Tripathi and S. Ranjeet. (1999): Effect of nitrogen on leaf mineral nutrient status, growth and fruiting in peach. Indian Journal of Horticulture Vol. 56 (4): 286-294.
Arquero, O., D. Barranco and M. Benlloch. (2006): Potassium
starvation increases stomatal conductance in olive trees HORTSCIENCE, 41 (2): 433–436. 2006.
Barritt, B. H., C.R. Rom, K.R. Guelich, S.R. Drake and M.R. Dilly. (1987): Canopy position and light effects on spure, leaf and fruit characteristics of “Delicious” apple. HortScience, 22: 402-405.
Ben M. M., M. Ghrab, M. Ghanem and O. Elloumi (2009):
Effects of Potassium foliar spray on olive, peach and plum. Part 2: peach and plum experiments. Research findings: Optimizing crop nutrition. 19: 14-17.
Benlloch-Gonzalez M., O. Arquero, J.M. Fournier, D. Barranco and M. Benlloch. (2008): K+ starvation inhibits
water-stress-induced stomatal closure. J Plant Physiol 165: 623-630.
Byers, R.E., G. Costa and G. Vizzotto (2003): Flower and fruit thinning of peach and other Prunus. Hort. Rev. 28:285-292.
Costa, G., C. Giulivo and A. Ramina (1983): Effects of the
different flower/vegetative buds ratio on the peach fruit abscission and growth. Acta Hortic 139: 149–160.
Cox, H.F. and D. Pearson. (1962): The chemical analysis of foods, 136-144. Chem. Publishing Co.Inc. New York, N.Y.
Crisosto C.H., R.S. Johnson, T. Dejong and K.R. Day. (1997): Orchard factors affecting postharvest stone fruit quality. HortScience, 32: 820–823.
Dbare, S., T. Gader and M. B. Mimoun (2016): Improving yield
and fruit quality of peach cv. ‘Flordastar’ by potassium foliar spray associated to regulated deficit irrigation. Journal of new sciences, Agriculture and Biotechnology, 28 (10): 1631-1637.
Deshmukh, N.A., R.K. Patel, B.C. Deka, A.K. Jha and P. Lyngdoh (2012): Leaf to fruit ratio affects fruit yield and quality of low chilling peach cv. ‘Flordasun’. Indian Journal of Hill Farming, 25 (1): 31-34.
Dinkova, S. (1997): Effect of pruning intensity on the pigment content and leaf size of plum Rasteniev. Dni Nauki, 32 (5): 255-256.
El-Boray, M.S., A.M. Shalan and Z.M. Khouri (2013): Effect of
different thinning techniques on fruit set, leaf area, yield and fruit quality parameters of Prunus persico, L. Batsch cv. Floridaprince. Trends Hortic. Res., Vol. (3): 1-13.
Engin, H. and A. Unal (2005): The effect of irrigation, gibberellic acid and nitrogen on the occurrence of double fruit in ‘Van’ sweet cherry. Acta Horticulturae (ISHS) 795: 645-651.
Erez, A. and J.A. Flore (1986): The quantitative effect of solar radiation on ‘Redhaven’ peach fruit skin color. HortScience 21: 1424-1426.
FAO (2013): Food and Agriculture Organization of the United
Nations Internet site. Agricultural statistics. www.fao.org. Spt.
Ferre, D.C. and C.G. Forshey (1988): Influence of pruning and
urea spray on growth and fruiting of square bound Delicious apple trees. J. Amer. Soc. Hort. Sci. 113 (5): 699-703.
Foster D.S. and Cornelia T. S. (1967): Colormetric methods of
analysis. D.Van Nestrant Company Inc. (551-552).
Fukuda, A. and G. Kondo (1957): Growth and yield as related to the concentrations of nitrogen, phosphoric acid, and potassium in sand culture. Studies Inst. Hort. Kyoto Univ., 8: 16–23.
Handley, D. F. and R. S. Johnson (2000): Late summer irrigation of water-stressed peach trees reduces fruit doubles and deep Sutures. Hortscience 35 (4): 771.
Holb, I.J., Gonda, I., Vago, I., Nagy, P.T. (2009): Seasonal
dynamics of nitrogen, phosphorus, and potassium contents of leaf and soil in environmental friendly apple orchards. Communications in Soil Science and Plant Analysis, 40: 694-705.
Husia, C. L.; B. S. Luh and C. D. Chichester (1965): Anthocyanin in free stone peach. J. Food Science, 30: 5-12.
Chartzoulakis, K.; I. Therios and B. Noitsakis (1993): Effects of shading on gas exchange, specific leaf weight and chlorophyll content in four kiwifruit cultivars under field conditions. J. Hortic. Sci., 68 (4): 605–611.
Jackson, M.L. (1967): Soil chemical analysis. Prentice Hall Inc. Engle wood cliffs, N.S.
Johansen, S. (1940): Plant microtechnique. Mc Graw-Hill Book
Company, New York.
Jackson, M.L. and A. Ulrish (1959): Analytical methods for plant analysis. Coll. of Agric. Exp. State Bull. 766: 35 pp.
Jundi, H. M. (2003): Physiology of tree fruits. Arabic home for putolishing. Cairo.
Kader, A. (2002): Postharvest technology of horticultural crops. Publication 3311. USA, University of California Agricultural and Natural Resources.
Lewallen, K. A. S. (2000): Effects of light availability and canopy position on peach fruit quality. MSC the Faculty of the Virginia Polytechnic Institute and State University, Blacksburg, Virginia.
Marini, R.P. and D.L. Sowers (1994): Peach fruit weight is
influenced by crop density and fruiting shoot length but not position on the shoot, J. Am. Soc. Hortic. Sci. 119 (2): 180–184.
McGuire, R.G. (1992): Reporting of objective color measurements. HortScience 27: 1254–1255.
Meitei, S. B., R. K. Patel, B.C. Deka, N. A. Deshmukh and A. Singh (2013): Effect of chemical thinning on yield and quality of peach cv. Flordasun. African Journal of Agricultural Research Vol. 8 (27): 3558-3565.
Mika, A. (1986): Physiological responses of fruit trees to pruning. Hort. Rev., 8: 337-378.
Mikhael, G.B., A.K. Omar and M.A. Gabr (2012): Yield and
fruit quality of “Dessert Red” peach trees as influenced by planting density and pruning severity. J. Biol. Chem. Environ. Sci., 7 (2): 123-144.
Moran, R. (1982): Formulae for determination of chlorophyllous pigments extracted with N, N. Dimethyl formamide. Plant physiol, 69: 1376-1381.
Mosa, W. F., N. A. Abd EL-Megeed and L. S. Paszt (2015): The
effect of the Foliar application of potassium, calcium, boron and humic acid on vegetative growth, fruit set, leaf mineral, yield and fruit quality of ‘Anna’ apple trees. AJEA, 8 (4): 224-234.
Olmstead, M., G. England and R. Atwood (2011): Optimizing
Fruit Spacing in Florida Peach Production.Proc. Fla. State Hort. Soc. 124: 41–44.
Osborne, J.L. and T. Robinson (2008): Chemical peach thinning: Understanding the relationship between crop load and crop value. New York Fruit Quarterly, 16: 19–23.
Porpiglia, P. J. and J.A. Barden (1981): Effect of pruning on
penetration of photosynthetically active radiation and leaf physiology on apple trees. J. Amer. Soc. Hort. Sci., 106 (6): 752-754.
Rania A. Taha, H.S.A. Hassan and E.A. Shaaban (2014): Effect
of different potassium fertilizer forms on yield, fruit quality and leaf mineral content of Zebda mango trees. Middle-East J. Sci. Res., 21 (1): 123-129.
Ritenour, M. and H. Khemira (1997): Red colour development
of apple, a literature review. Washington State University, Tree fruit research & Extension center.Pages:1-10.Available at (http:// postharvest. tfrec.wsu.edu/REP2007A.pdf.)
Samira, M. Mohamed, T.A. Fayed, A.M. Hussein and Safaa M. Maged (2014): Effect of some pruning applications on leaf to fruit ratio, yield and fruit quality of ‘Florda Prince’ peach trees. J. Hort. Sci. & Ornamen. Plants, 6 (1): 18-26.
Sarkadi, B. I. (2012): Study upon the impact of chemical thinning with ethephon on the quality of two peach varieties cultivated in the Western part of Romania. Int. Res. J. Agric. Sci. Soil Sci., Vol. 2 (9): 413-420.
Sass, J.E. (1958): Elements of botanical microtechnique, vol 2. Mac Graw-Hill Book Company, New York.
Schnabel, G., Layne, R.D., Holb, I.J. (2007): Micronised and
non-micronised sulphur applications control peach scab equally well with negligible differences in fruit quality. Annals of Applied Biology 150 (2): 131-139.
Shaltout, A.D. (1995): Introduction and production of some low-medium chill peach cultivars in the sub-tropical climate of Egypt. Assiut. J. Agric. Sci., 26 (1): 195-206.
Shiukhy, S., M. R. Sarjaz and V. Chalavi (2014): Evaluation of chlorophylls activity, carotenoids content and total anthocyanin changes of fruit in different aspects and fruit location within orange tree canopy. J Nov. Appl Sci., 3 (S2): 1578-1583.
Snedecor, G.A. and W.G. Cochran (1967): Statistical Methods. 6th
Ed. Lowastate. Univ., Lowa, U.S.A.
Tworkoshi, T., S. Miller and R. Scorza (2006): Relationship
of pruning and growth morphology with hormone ratio in shoots of pill and standard peach trees. J. Plant Growth Regul., 25: 145-155.
Veberič, R., D. Vodnik and F. Stampar (2005): Influence of foliar-applied phosphorus and potassium on photosynthesis and transpiration of ‘Golden Delicious’ apple leaves (Malus domestica
Borkh.): Acta Agriculturae Slovenica, 85 (1): 143–155.
Veberič, R., F. Štampar and D. Vodnik (2002b): Influence of the foliar application of phosphorus and potassium on the photosynthetic intensity in apple trees (Malus domestica Borkh.): Acta Horticulturae, 594: 165-170.
Weinbaum, S.A., F.J.A. Niederholzer, S. Pochner, R.C. Rosecrance, R.M. Carlson, A.C. Whittlesey and T.T. Muraoka (1994): Nutrient uptake by cropping and defruited field grown “French” prune trees. J Amer Soc. Hort. Sci., 119: 925-938.
Weinbaum, S.A., P.H. Brown and R.S. Johnson (2002):
Application of selected macronutrients (N, K) in deciduous orchards: physiological and agrotechnical perspectives. Acta horticulturae 594: 59-64.
Westwood, M. N., L.P. Batjerand and H.D. Billingsley (1967):
Cell size, cell number, and fruit density of apples as related to fruit size, position in cluster, and thinning method. Am. Soc. Hort. Sci. 91, 51–62.
Yoshida, S., D.A. Forno, J.H. Cock and K.A. Gomez (1972):
Laboratory manual for physiological studies of rice. The International Rice Research Institute Los Banas . Philippines.
Zayan, M.A., E. Morsy, H.M. Ayaad and M.A. Gabr (2002):
Influence of pruning treatments on growth, leaf constituents, flowering, yield and fruit quality of “ Anna” apple trees. 2nd Inter. Conf. Hort. Sci.Kafr Elsheikh, Tanta Univ., Egypt, pp.1203-1223.
Zayan,M.A., S.M. Zeerban, G.B Mikhael and H.M. Abo Ogiela (2015): Improving productivity and fruit quality of Florida prince peach trees by using some agriculture treatments.