DISCUSSION PAPER SERIES
Forschungsinstitut zur Zukunft der Arbeit Institute for the Study of Labor
Do NEETs Need Grit?
IZA DP No. 8740December 2014 Silvia Mendolia Ian Walker
Do NEETs Need Grit?
Silvia Mendolia
University of Wollongong and IZAIan Walker
Lancaster University and IZADiscussion Paper No. 8740
December 2014
IZA P.O. Box 7240 53072 Bonn Germany Phone: +49-228-3894-0 Fax: +49-228-3894-180 E-mail: [email protected]Anyopinions expressed here are those of the author(s) and not those of IZA. Research published in this series may include views on policy, but the institute itself takes no institutional policy positions. The IZA research network is committed to the IZA Guiding Principles of Research Integrity.
The Institute for the Study of Labor (IZA) in Bonn is a local and virtual international research center and a place of communication between science, politics and business. IZA is an independent nonprofit organization supported by Deutsche Post Foundation. The center is associated with the University of Bonn and offers a stimulating research environment through its international network, workshops and conferences, data service, project support, research visits and doctoral program. IZA engages in (i) original and internationally competitive research in all fields of labor economics, (ii) development of policy concepts, and (iii) dissemination of research results and concepts to the interested public. IZA Discussion Papers often represent preliminary work and are circulated to encourage discussion. Citation of such a paper should account for its provisional character. A revised version may be available directly from the author.
IZA Discussion Paper No. 8740 December 2014
ABSTRACT
Do NEETs Need Grit?
This paper investigates the relationship between personality traits in adolescence and education and labour market choices. In particular, we investigate the impact of grit (a tendency and ability to sustain interest in long term goals - perseverance) on the risk of youths being NEET – “Not in Education, Employment or Training”. Thus, our focus is on early drop-out from the labour market and education at age 18-20. Individuals with high levels of grit are less likely to be out of education or employment, while low self-esteem and external locus of control increase the chances of experiencing these conditions. We use propensity score matching to control for a rich set of adolescent and family characteristics and our results show that personality traits do affect education and employment choices. We test the robustness of our results using the methodology proposed by Altonji et al. (2005) that consists of making hypotheses about the correlation between the unobservables and observables that determine the outcomes and the unobservables that influence personality.
JEL Classification: I10, I21
Keywords: personality, NEET, grit, locus of control, self-esteem
Corresponding author: Silvia Mendolia
School of Economics, Faculty of Business Building 40, Room 215
University of Wollongong Wollongong, NSW 2522 Australia
3
1. Introduction
The objective of this paper is to analyse the role of personality traits on education and labour market choices. In particular, we study the effect of grit, self-esteem and locus of control at age 15-16, on the risk of dropping out from education and labour market at 18-20 years of age.
We contribute to the existing literature on the effect of personality traits in two ways. We focus on the role of several personality traits and, in particular, on the role of “grit” – by which we mean the tendency to sustain interest in, and effort toward, very long-term goals (Duckworth et al., 2007). While grit has been a feature of recent work in research by educational psychologists, the existing economics literature on non-cognitive skills has neglected the role of this important trait. Several studies have shown that personality traits are stable during adult life (Cobb-Clark and Schurer, 2012 and 2013) but are relatively malleable over the early lifecycle and can be affected by policy interventions aimed at suppressing harmful traits early in life (see Carneiro and Heckman, 2003 for a discussion). The existing literature relies mostly on relatively dated data (for example NLSY1979 for Heckman et al., 2006 and Cebi, 2007; NELS1988 for Coleman and Deleire, 2003; UK NCDS1958 for Carneiro et al., 2007), or does not have a specific focus on personality traits in adolescents (Chamorro et al., 2003; Delaney et al., 2013). Thus, here we provide evidence from a dataset based on a large cohort of English teenagers born in 1990 and followed for seven years, starting in 2004. Furthermore, we analyse the effect of non-cognitive skills on the chances of dropping out of education and employment (being NEET, Not in Education, Employment or Training). The analysis of this condition is particularly relevant for the British population: OECD figures suggest that the UK ranks 26th out of 33 OECD countries, with a percentage of young people classified as NEET around 9.5%, well above the EU average of 6.1% (OECD 2012). The existing literature has analysed the effect of non-cognitive skills on
4
education and labour market outcomes, but has focused on very different indicators, such as, for example, years of schooling, college graduation (Heckman et al. 2006; Coleman and Deleire, 2003; Cebi, 2007), occupational attainment and wages (Duncan and Duniform, 1998; Groves, 2005; Nyuns and Pons, 2005; Cobb-Clark and Tan, 2011; Drago, 2011).
Young people who spend some time being NEET have been shown to have worse short and medium term economic outcomes than those who enter work or who remain in fulltime education (Crawford et al., 2010; Gregg, 2001; Mroz & Savage, 2006; Machin & Manning, 1999). They also are more likely to remain NEET in subsequent periods if they experience this condition for one year when they are 17-18 (Crawford et al., 2010). Research by Crawford et al. (2010) shows that the longer a young person spends being NEET the higher the risk of them having poor labour market outcomes in the longer term and that, if young people find work after being NEET, they were more likely to get a job without any training rather than a job with training. This analysis is particularly relevant to recent policy changes aimed at ensuring that all young people in England continue in education or training leading to an accredited qualification at the end of the academic year in which they turn 17 (from 2013) and to age 18 (from 2015).
Finally, we use propensity score matching (PSM) to investigate this relationship between personality traits and the risk of dropping out from education and employment, and we examine the robustness of our results using the methodology proposed by Altonji et al. (2005) - the AET method. This method uses the information on observable differences between youths with and without a particular personality trait to provide information regarding the likely magnitude and direction of selection along unobserved characteristics.
OLS is widely regarded as providing an estimate of an upper bound on the causal effect. Propensity Score Matching focuses on treatments and controls that are observably comparable and therefore provides closer estimates to the causal effect than OLS. AET could
5
tighten the PSM bound further by exploring the effect of varying the correlation between the unobservables that determine the treatment and those that determine the outcome.
2. Overview of the existing literature
The relationship between personality traits and education and employment has received increased interest from economists in recent years. Research in personality psychology has focused on the widely shared taxonomy of traits, known as the Big Five, including five factors (Openness to Experience, Conscientiousness, Extraversion, Agreeableness, and Neuroticism or Emotional Stability) that represent many different personality traits.
Many studies in personality psychology have also demonstrated that some personality traits, such as Conscientiousness and Openess to Experience have a positive effect on educational outcomes, through various mechanisms, such as better study behaviours, concentration and effort. Facets of emotional stability, such as self-esteem and locus of control, have also been shown to have significant effect on labour market success. Almlund et al. (2011) provides an excellent review of the major findings from studies conducted in economics and psychology.
Literature in psychology and sociology has analysed the role of internal locus of control, openness to experience, and conscientiousness in promoting better academic performance, increased years of schooling and greater chances to go to university (see for example Goldberg et al., 1998, and Wang et al., 1999 for reviews). However, most of these studies tend to use small or unrepresentative samples and focus on correlation between personality and educational outcomes rather than on understanding the causal relationship.
6
Duckworth and Seligam, 2005, Ross and Broh, 2000, and Poropat, 2009 conduct meta-analyses that aim to overcome the former shortcoming, but not the latter.
A growing body of economics literature has analysed the impact of personality traits on educational attainment, with a particular focus on high school dropouts. Results generally suggest that traits as conscientiousness and internal locus of control improve educational outcomes, even if some differences have been found across outcomes or socio-economic groups (Lundberg, 2013). For example, Coleman and Deleire (2003) show that teenagers with internal locus of control are more likely to make educational investments such as completing high school and attending a four-year college. On the other hand, Cebi (2007) replicates the Coleman and Deleire (2003) study using NLSY and suggest that locus of control is not a significant determinant of high school completion and college attendance, once cognitive ability is taken into account. Baron and Cobb-Clark (2010) use data on a recent cohort of Australian youths to show that people with internal locus of control are more likely to complete high school and go to university and they do not find any significant relationship between family welfare history and young person’s locus of control.
A more limited literature in economics has looked at the impact of personality traits on unemployment experience. For example, Caliendo et al. (2014) show that people with a more internal locus of control will look for jobs more intensely and will have a higher reservation wage. Similarly, a study by McGee and McGee (2011) shows that people with a higher locus of control believe that search effort has a higher return, but locus of control seems to affect beliefs (and not productivity) and therefore does not affect re-employment wages. Macmillan (2013) uses the British Cohort Study to analyse intergenerational transmission of disadvantage and show that non-cognitive skills (and in particular extroversion, hyperactivity and conscientiousness, measured at age 5 and 10) play an important role in predicting future spells of unemployment.
7
One of the most notable examples of the relevance of non-cognitive skills in the economics literature is provided by Heckman and Rubinstein (2001) who analyse the performance of Graduate Equivalence Diplomas (GED) recipients and conclude that their lower achievements in the labour market and the higher prevalence of criminal or risky behaviours can be attributed to the lack of non-cognitive skills such as discipline, patience or motivation. Heckman, et al. (2006) use data from the US NLSY1979 and show that locus of control and self-esteem affect schooling decisions, wages, occupational choices, and health-risky behaviours. Heckman and Masterov (2007) and Heckman et al. (2010) analyse the effect of the famous Perry Preschool program and emphasized the importance of investing in promoting positive non-cognitive skills from a very early age.
A separate strand of literature in psychology has analysed the role of “grit”, defined as perseverance with respect to long-term goals, in predicting a variety of success outcomes, including educational attainment. Thus work shows that continuous and focused application of talent over time is crucial for achievement of difficult goals (Duckworth et al., 2007; Eskreis-Winkler et al., in press). Research in this area has shown, for example, that grit predicts: graduation from Chicago public high schools, (Eskreis-Winkler et al., in press), achieving outstanding results at the National Spelling Bee competition (Duckworth et al., 2007), as well as retention and performance in several different professions, such as teachers, (Duckworth, Quinn, & Seligman, 2009, Robertson-Kraft & Duckworth, 2014) sales agents (Eskreis-Winkler et al., in press), or members of Special Forces (Eskreis-Winkler et al., in press).
Our own analysis is important because we try to establish a connection between several personality traits, including grit, and the risk of dropping out from education and employment (becoming NEET) for English teenagers. The economics literature on the determinants of NEET status is very limited, despite a great deal of policy attention and
8
investments to address this phenomenon. Cornaglia et al. (2012) show that poor mental health increases the probability of being NEET by around 3 p.p, after controlling for exam performance at age 16. Carneiro et al. (2007) use data from the NCDS to show that social skills have an important role in determining school attainment and labour market outcomes more generally. Britton et al. (2011) discuss different definitions of youth unemployment and NEET, and identify a group of characteristics measured at age 14 that may be used to predict the risk of becoming NEET such as low test scores, and poor socio-economic background. High school results appear to be stronger predictors of NEET status than socio-economic status (see also Crawford et al., 2010). However, none of these studies has looked at the importance of personality traits in predicting (and avoiding) NEET status.
3. Data
This paper uses data from the Longitudinal Study of Young People in England (LSYPE). This is a large-scale cohort survey of English adolescents, selected to be representative of young people in England but at the same time as oversampling specific groups. Adolescents were interviewed for the first time when they were in school year 9 in 2004 at the age of 14. LSYPE children can be linked to the National Pupil Database (NPD), a pupil-level administrative database that matches pupil and school characteristics data to pupil attainment and contains detailed information on test scores for all the LSYPE children. We use this data to obtain information about LSYPE children’s results in test scores at age 16 (Key Stage 4 or GCSE). The study is managed by the UK Department of Education and covers a wide range of topics, including academic achievements, family relationships, attitudes toward school, family and labour market, and some more sensitive or challenging issues, such as risky health behaviours (smoking, alcohol drinking, drug taking), personal relationships, etc.
9
In the first wave around 15,500 young people were interviewed. In the first four waves, parents/guardians were also interviewed. Our final sample includes around 6,000 observations of children with non-missing information on personality traits, test scores, and other essential information on the child’s birth and family background (the selected observations were not significantly different from the original data in terms of their observable characteristics).
3.1 Outcomes
We investigate the effect of personality traits on the chances of dropping out from education of employment (being NEET). In particular, at each wave, the youths in LSYPE are asked to report their main activity. We use this information collected at wave 4, 5, 6 and 7 (age 17-18 to 20-21) and follow the definition of NEET reported in the LSYPE documentation. In particular, a young person is defined NEET if they are: unemployed (and looking for work), looking after the family, having a break from study and work (excluding people who are waiting for exam results, have applied for a university course, are waiting to participate in government training programs or travelling).
We consider three different NEET outcomes:
• Having been NEET at least once in the 4 waves
• Having been NEET for two or more years (core NEET) • Number of years spent being NEET
3.2 Personality traits
Personality is very complex and factor analysis has been widely utilised in personality psychology to identify a number of common factors derived from a variety of questions (Cobb-Clark et al., 2014; Piatek and Pinger 2010; and Almlund et al., 2011). LSYPE does not include information about the “Big Five” personality traits that have been the focus of some
10
recent research (see Almlund et al., 2011 for a review of possible alternatives), but it does include a series of questions on perseverance, locus of control, self-esteem, and long term goals and interests and attitudes towards school work.
Grit is the tendency to sustain interest in and effort toward very long-term goals (Duckworth et al., 2007). Individuals who are gritty are able to maintain focus and effort towards challenges, despite difficulties and failures, and are more likely to be high achievers. Research in the field of psychology, especially led by Angela Duckworth and her colleagues, has analysed the predictive power of grit and has showed that grit predicts high achievement and performance in several different fields, including education and labour market (see for example Duckworth, Quinn, an Seligman, 2009; Eskreis-Winkler et al., 2014; Robertson-Kraft and Duckworth, 2014). LSYPE includes seven questions on working attitudes and long term objectives (see the Appendix for details). We follow Duckworth et al., 2007 and use these questions to calculate a “Grit scale”, where the maximum score is 4 (extremely gritty) and the lowest score is 1 (not at all gritty). We also construct a binary indicator, and define an individual as “gritty” if her/his score is in the top quartile of the grit scale.
Locus of control refers to the extent to which individuals believe that they can affect and control events happening in their own life (Rotter, 1966). People with external locus of control believe that their actions and behaviours do not have an effect on future life outcomes, while individuals with internal locus of control generally believe that life events are mostly caused by their own decisions and behaviours.
We measure locus of control using children’s responses to six questions (see the Appendix for details). We follow the previous literature in the field (see for example Cobb-Clark et al., 2014 and Piatek and Pinger 2010) and use factor analysis to create indices of internal and external locus of control. Children are classified as external if they have a score in the top quartile of the distribution of the external index, derived from factor analysis (see
11
Schurer, 2014). We also examine the robustness of this definition, by classifying children as external if they have a score in the top third or half of the distribution of the external index (see Caliendo et al., 2014). Self-esteem refers to an individual emotional evaluation of her/his own value. LSYPE includes two questions on self-esteem (see Appendix for details) asked at waves 2 and 4. We construct an indicator of low self-esteem equal to 1 if they have placed themselves in the most distressed category for one of the two questions at least once between the two waves (around 26% of the children in the sample)1.
3.3 Other explanatory variables
We estimate three versions of our model, progressively increasing the set of independent variables. All of the variables we control for are, arguably, pre-determined variables – that is, not themselves influenced by personality traits. Our first most parsimonious model only includes at-birth characteristics such as: birth-weight; whether the child was premature; ethnic background; sex of the child; and family characteristics such as marital status and age of the mother at birth. In the second model we include other family’s characteristics (measured at wave 1) such as: child’s or parent’s disability, maternal education and employment status, whether the child lives in a single parent family, grandparents’ education, family income and older siblings. In the last version of the model, we also control for test scores at age 16. At the end of Key Stage 4 (from 13 to 16 years old), pupils take the national public General Certificate in Secondary Education (GCSE) in most subjects studied – often in as many as 10 subjects. GCSE grades range from A* to G. Our independent variables is a binary variable indicating having 5 GCSE passes including Mathematics and English which is usually required for students following an academic track for progression beyond age 16.
1 Alternative/more restrictive indicators of low self-esteem were constructed to test the robustness of our
12
Table 1 - Descriptive statistics of outcome variables by personality traits Whole sample External locus of
Control
Low self-esteem High level of grit Has been NEET
at least once (w4 to w7)
15% 24% 23% 8%
Has been NEET for 2 or more years
4.7% 9% 6.5% 1.4%
No. years NEET
0 84.5% 76% 77% 92%
1 11% 15% 16.5% 6.5%
2 3% 6% 4.3% 0.8%
3 1% 2.4% 1.7% 0.5%
4 0.5% 0.6% 0.5% 0.2%
Table 1 presents descriptive statistics on the outcome variables, broken down by personality traits. Individuals who have external locus of control or low self-esteem seem a lot more likely to end up being NEET (and being in this condition for a longer period of time), while grit seems to have a protective effect.
Table 2 analyses other characteristics of youths who are NEET at age 17-20 in our sample: these young people are more likely to have performed poorly in their GCSE exams and to come from families in low socio-economic background (lower family income, lower maternal education and employment, higher incidence of single or very young parents).
13
Table 2 – Descriptive statistics of other independent variables by NEET status Never been
NEET
Has been NEET at least once (w4 to w7)
Has been NEET for 2 or more years
N. GCSE with A*-C 7.4 3.5 2.4
Household income <11,400£
20% 31% 34%
Household income betw. 11,400 and 31,200£
42% 50% 54%
Household income >31,200£
38% 19% 12%
Mother has university degree
16% 6% 5%
Mother has other higher education
15% 10% 6%
Mother senior high school graduate
16% 11% 9%
Mother junior high school graduate
30% 32% 29%
Mother has qualifications level 1 or below
8% 13% 18%
Mother has other qualification
3% 5% 5%
Mother has no qualifications
12% 23% 28%
Single mother household at birth
17% 32% 33%
Mother younger than 20 y.o. at birth 5% 10% 13% Male 52% 56% 55% Black 5% 4% 4% Asian 9% 6% 6% Mixed 6% 6% 5%
Mother was unemployed at wave 1
1% 2% 4%
Mother was out of the labour force at wave 1
14
4. Estimation
Our basic specification is firstly estimated using Ordinary Least Squares to control for observable confounders. However, this method is well known to lead to biased estimates of the causal effects because of neglected heterogeneity. The linear model can be written as:
Yi = α + Pi’ β + Xi’ γ + εi (1)
where Yi represents NEET outcomes (chances of being NEET at least once between wave 4 and wave 7; having been NEET for at least two years; number of years in NEET condition), Pi’ is a vector of psychological traits (binary indicators of grit, external locus of control, low self-esteem) and Xi’ is a vector of child’s and family’s characteristics. Our data does not contain any quasi-experimental variation across the sample that might allow us to address the selection on unobservables problem. Therefore, we try to tighten the upper bound provided by OLS estimation through the estimation of three different specifications of our model, gradually including a more detailed set of independent variables. Estimation by OLS could be biased if we are not controlling for variables that actually play an important role in determining NEET status (the so-called omitted variable bias), or because of reverse causality (i.e change in personality because of NEET status). However, the previous literature has shown that personality traits tend to be quite stable after childhood (Cobb-Clark and Schurer, 2012 and 2013) and most of the questions we use to construct our indexes of personality traits have been asked at least one year before recording NEET status.
Standard OLS regression controlling linearly for the observable characteristics and personality traits may be biased if the true model were not linear in terms of the observed variables and if the effect of personality traits on NEET outcomes is not homogeneous (ie the same for all individuals). If this is the case, OLS will not, in general, recover the Average Treatment on Treated (ATT) effect. Both these biases are exacerbated if some children fall outside the so-called common support of the observables – that is, if we cannot find in our sample some children with a particular personality trait that are comparable to other children in the sample of those without that particular
15
trait. If that is the case, OLS would be comparing non comparable children using linear extrapolation. Therefore, we also estimate using propensity score matching that limits inference to samples where we can find overlap in the distribution of covariates across the treatment and does not rely on any assumptions about the functional form.
As with OLS, PSM relies on conditional independence that implies no selection on the unobservables conditional on the observables. On the other hand, PSM attaches weights to the observations in the control group, so that the distribution of their observable characteristics is realigned to the treatment group. Thus, it is preferred to OLS because of its more convincing comparison of treated and control units. Lastly, there is some (debated) evidence suggesting that it contributes to a reduction in selection bias (see Dehejia and Wahba 2002, Dehejia 2005, and Smith and Todd 2004). For all these reasons, matching provides a convincing way to select the observations on which other estimation methods can be based.
Propensity Score Matching has also been used in various recent papers investigating the determinants of child well-being (see for example Ruhm, 2008, Berger et al., 2005, and Goodman and Sianesi, 2005) and the effect of personality traits (Caliendo et al., 2014; Mendolia and Walker, 2014). The idea of propensity score matching is to match children with different personality traits (for example, with and without a high level of grit) who are as comparable as possible in all other observable characteristics. More specifically, we first estimate the conditional probability of having a specific personality trait, such as being gritty, for each child, given our covariates (the so-called propensity scores). Then, each treated child is matched with a comparison child (i.e. without the specific personality trait) with the closest propensity score. In other words, estimated propensity scores are used to create a matched control group. Non-matched individuals are dropped from the analysis. Our analysis is performed using the STATA routine psmatch2 and appropriate tests have
16
been run, in order to compare covariate distributions across our matched groups to ensure that adequate balance has been obtained (results available in Appendix Table A1)2.
Lastly, we examine the robustness of our results using the methodology proposed by Altonji et al. (2005) (AET) that uses the selection on observable traits to provide information about the potential for selection on unobservable characteristics. According to this approach, the part of an outcome (Yi) that is related to the observables has the same relationship with personality traits as the part related to the unobservables. This method requires some stringent assumptions (see Altonji et al., 2005 for the details and Chatterji et al., 2011 and Johnston et al., 2013 for applications of the methodology) but has the advantage of not relying on exclusion restrictions for identification. According to the AET approach, we estimate a bivariate probit model with a constrained correlation coefficient. Identification comes from this restriction as well as from functional form (Altonji et al., 2005). Following the AET approach, if the observable determinants of an outcome are a random set of the complete set of determinants, then selection on unobservable characteristics will be the same as the selection on observable characteristics. Altonji et al. (2005) show that we can estimate the following bivariate probit model:
Y = 1(α + βP + X’ γ + ε >0) (2)
P=1(Z’ θ + u >0) (3)
�𝑢𝜀� ∼ 𝑁 �00� �1𝜌 𝜌1� (4)
In this model, we use the degree of selection on the observables as a guide to identify the parameter ρ. The idea that “selection on the observables is the same as the selection on unobservables” is formalised as:
2 Our approach is similar to Goodman and Sianesi (2005) and we use propensity score matching with the nearest
neighbour method with replacement (as it has been shown to reduce bias relative to matching without replacement, see Dehejia and Wahba, 2002) and then used the common option, so that off-support observations are automatically dropped. Similar results were obtained with other matching methods.
17
𝐶𝑜𝑣 (𝑃,𝜀)
𝑉𝑎𝑟 (𝜀)
=
𝐶𝑜𝑣 (𝑃,𝑋′𝛾)
𝑉𝑎𝑟 (𝑋′𝛾)
As explained in Altonji et al. (2005), this condition holds under the following assumptions : the elements of X are chosen randomly from the full set of variables that determine Y; and the number of observed and unobserved factors is large enough so that no element dominates the distribution of the outcome. These assumptions are very strong but, as argued in Altonji et al. (2005), weaker than the standard OLS assumption that Cov(X, ε) = 0. Following Altonji et al. (2005), we present estimates that maximise the likelihood imposing 𝜌= 𝐶𝑜𝑣 (𝑃′𝛽,𝑃′𝛾)
𝑉𝑎𝑟 (𝑃′𝛾) which is equivalent to condition (5).
Altonji et al. (2005) argue that if the observable determinants of Y are a random sample of the complete set of determinants, selection on observable characteristics would be equal to selection on unobservable characteristics. In practice, the estimates obtained under this set of assumptions could be treated as a lower bound on the true effect, as there are various reasons to believe that the relationship between the unobservables and any potentially endogenous treatment will be weaker than the relationship between the observables and the treatment. For example, as noted in Altonji et al. (2005), the set of covariates X has probably been selected with the idea of reducing bias, rather than selected at random.
5. Results
The results from the estimation of the effect of personality traits on chances of dropping out of education and employment are presented in Tables 3, 4, 5, and 6. As already explained, we present results from different specifications of our model, progressively increasing the set of independent variables. Model 3 includes the same variables of Model 2, but also includes a binary variable, indicating whether the youths have achieved 5 or more GCSE with a grade between A* and C. Results from this specification are therefore conditioned on GCSE achievements. We believe it is important to show the stability of our main findings from Model 2 when controlling for GCSE
18
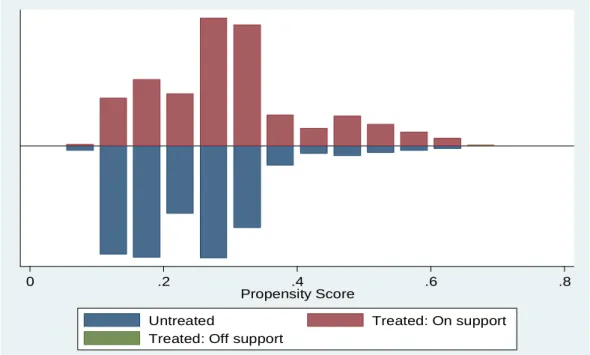
achievements, as the previous literature has shown that high school attainments are among the main determinants of NEET status. Figures 1 and 2 show the distribution of propensity scores across treatment and control groups. Both graphs show that there is sufficient overlap between the treatment and control groups.
Figure 1 - Histogram of propensity scores of treatment vs. control group
Figure 2 - Kernel graphs of propensity score for treated and control group
0 .2 .4 .6 .8
Propensity Score
Untreated Treated: On support Treated: Off support
0 2 4 6 kd e n si ty _ p sco re 0 .2 .4 .6 .8 x
19
Table 3 presents results from OLS and Probit models, where all three personality traits are included in the estimation at the same time. Personality traits have a strong effect on the chances of being NEET, and remaining in this condition for a relatively longer period of time. In particular, the strongest negative effect comes from low self-esteem. Having low self-esteem increases the chances of being NEET at least once in the survey by almost 9 percentage points (p.p) in Model 2 and 8 p.p in Model 3. On the other hand, grit has a strong protective effect, as gritty individuals are far less likely to have ever been NEET (- 7 p.p. in Model 2 and -5 p.p. in Model 3) and to remain in this condition for a long time. Interestingly, individuals with external locus of control and low self-esteem are more likely to be NEET for at least two years (“core NEET”) by about 2 p.p. and the protective effect of grit is even higher (-2.5 p.p.). The magnitude of these effects is relevant, especially considering that the proportion of youths who remain NEET for two or more years is quite low in our sample (see Table 1). Results from the estimation with Propensity Score Matching are presented in Table 4 and confirm OLS findings. Grit strongly decreases the chances of being NEET by 10 p.p., and almost 7 p.p when we control for GCSE results in Model 3. On the other hand, youths with external locus of control and low self-esteem face higher risks of being NEET and remaining in this condition for a long period of time. The effect of self-esteem is particularly noticeable, as the size of the effect is very stable (+9 p.p in chances of being NEET and +2 p.p. in chances of being “core NEET”) even when we control for GCSE attainments. Results from balancing tests for PSM model are reported and discussed in Appendix Table A1.
One possible explanation for the negative effects of low self-esteem is that youths with this trait tend to be unhappy with themselves and their value, and have a general negative opinion of themselves. Low self-esteem may have an impact on many different aspects of individuals’ life, such as aspirations and effort to achieve the potential, and this may in turn affect the ability to make decisions about the future, and choices about education and labour market participation.
20
Table 3 Effect of personality traits on NEET status – OLS and Probit Estimation Results
Model 1 Model 2 Model 3
NEET Core NEET No. years
NEET
NEET Core NEET No. years
NEET NEET Core NEET No. years NEET OLS External 0.079 0.044 0.142 0.048 0.031 0.092 0.018 0.020 0.047 Locus of (0.010)*** (0.006)*** (0.017)*** (0.011)*** (0.0069)*** (0.018)*** (0.011)*** (0.006)*** (0.019)** Control Gritty -0.082 -0.035 -0.131 -0.072 -0.032 -0.114 -0.053 -0.026 -0.085 (0.010)*** (0.006)*** (0.017)*** (0.011)*** (0.006)*** (0.018)*** (0.011)*** (0.006)*** (0.018)*** Low Self- 0.082 0.019 0.111 0.087 0.018 0.113 0.0824 0.018 0.107 Esteem (0.010)*** (0.006)*** (0.016)*** (0.011)*** (0.006)*** (0.018)*** (0.011)*** (0.006)*** (0.017)*** F stat (p-value) 34.42 0.000 16.50 0.000 31.38 0.000 22.88 0.000 11.32 0.000 21.78 0.000 30.06 0.000 12.47 0.000 27.22 0.000 N. observations 6,474 6,474 6,474 5,224 5,224 5,224 5,180 5,180 5,180
Probit (Marginal Effects)
External 0.075 0.037 0.041 0.019 0.012 0.009 Locus of (0.011)*** (0.007)*** (0.011)*** (0.006)*** (0.010)*** (0.004)*** Control Gritty -0.086 -0.036 -0.076 -0.028 -0.059 -0.021 (0.0089)*** (0.004)*** (0.009)*** (0.004)*** (0.009)*** (0.004)*** Low Self- 0.082 0.017 0.085 0.013 0.078 0.011 Esteem (0.011)*** (0.006)*** (0.012)*** (0.005)*** (0.011)*** (0.004)*** N. observations 6,474 6,474 5,224 5,224 5,180 5,180
Note: Standard errors are in brackets. * indicates that the underlying coefficient is significant at 10% level, ** at 5% and ***at 1%. Additional variables included in the analysis are listed at p. 9-10.
21 Table 4 Effect of personality traits on NEET status – PSM Estimation Results
Model 1 Model 2 Model 3
NEET Core NEET No years
NEET
NEET Core NEET No years
NEET NEET Core NEET No years NEET External locus 0.089 0.038 0.153 0.091 0.041 0.146 0.044 0.025 0.078 of control (0.024)*** (0.014)*** (0.039)*** (0.017)*** (0.011)*** (0.029)*** (0.018)*** (0.011)*** (0.031)*** Gritty -0.105 -0.043 -0.162 -0.100 -0.042 -0.161 -0.067 -0.022 -0.096 (0.025)*** (0.013)*** (0.036)*** (0.013)*** (0.007)*** (0.021)*** (0.012)*** (0.006)*** (0.019) Low Self- 0.097 0.024 0.140 0.094 0.019 0.114 0.095 0.024 0.128 Esteem (0.022)*** (0.012)* (0.035)*** (0.013)*** (0.008)*** (0.023)*** (0.013)*** (0.008)*** (0.022)***
Note: Std errors are in brackets. * indicates that the underlying coefficient is significant at 10% level, ** at 5% and ***1%. Additional variables included are listed at p. 12.
Table 5 Effect of personality traits on NEET status – PSM Estimation Results by gender
Model 2 Model 3
NEET Core NEET N. years NEET NEET Core NEET N. years NEET
Girls External locus 0.079 0.043 0.128 0.052 0.033 0.100 of Control (0.025)** (0.015)** (0.043)** (0.027)** (0.016)** (0.45** Gritty -0.092 -0.035 -0.150 -0.082 -0.022 -0.118 (0.017)*** (0.009)*** (0.028)*** (0.017)*** (0.008)*** (0.026)*** Low Self- 0.102 0.0251 0.134 0.0763 0.011 .096 Esteem (0.017)** (0.010)** (0.028)*** (0.017)** (0.010) (0.028)*** Boys External locus 0.069 0.049 0.138 0.025 0.019 0.042 of Control (0.024)*** (0.014)*** (0.040)*** (0.026) (0.016) (0.045) Gritty -0.080 -0.039 -0.132 -0.068 -0.029 -0.106 (0.019)*** (0.011)*** (0.031)*** (0.019)*** (0.009)*** (0.029)***
Low Self- Esteem 0.107 0.044 0.176 0.127 0.040 0.193
(0.021)*** (0.013)*** (0.034)*** (0.021)*** (0.0128)*** (0.034)***
F stat (p-value)
22
Similarly, individuals with external locus of control tend to think that their choices have less impact on their future, which they believe are mostly driven by luck and external circumstances. As a consequence, these youths are less likely to make constructive decisions about their future and to put lots of effort in achieving goals.
Lastly, grittier individuals have higher levels of perseverance towards long term goals and they are able to maintain focus on long-term challenges and objectives and sustain commitment to their ambition (Duckworth et al., 2007). As already shown by the literature in psychology, led by Angela Duckworth and her colleagues, this trait seems even more important than talent to achieve ambitious career goals, and our results confirm the consistent positive effect in reducing chances of dropping out of education and labour market. Our findings are also consistent with previous literature from psychology and economics. For example, Almlund et al., 2011 discuss findings from various studies showing that self-esteem and locus of control have very strong associations with educational attainment and labour market performance.
In Table 5, we split the results by gender. Interestingly, the positive effect of grit is very consistent and positive for both girls and boys, while the negative effect of low self-esteem seems more prominent for boys. This is particularly interesting, as the prevalence of low self-esteem is lower among boys in our sample (34% of girls experience this condition vs 21% of boys) and at the same time, grit is more common among girls (31% of girls are very gritty vs 24% of boys).
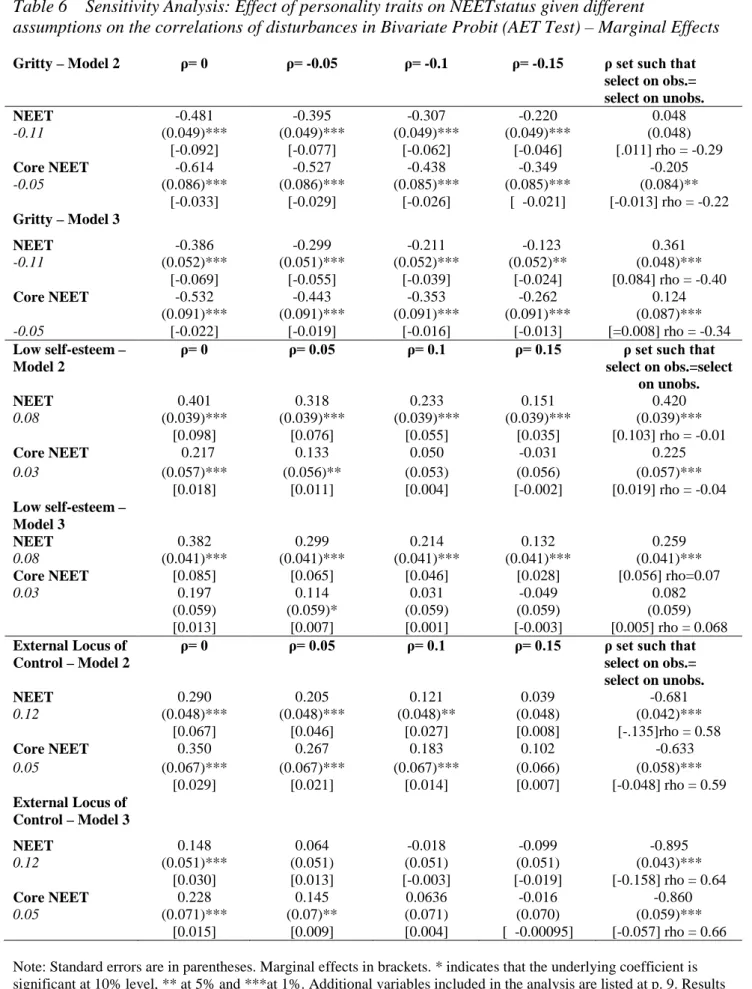
Lastly, in Table 6 we present results from the empirical strategy proposed by Altonji et al. (2005) and applied by Chatterji et al. (2011), which does not rely on untestable identifying assumptions. The first part of the AET method consists in varying the level of correlation between unobservables determining personality traits and NEET outcomes and determining whether the effect of personality is sensitive to these variations. The first column in Table 6 column reports estimates identical to a standard univariate probit (imposing no correlations between the
23
unobservables determining outcomes and personality traits3), while the other columns report estimates of the effect of grit, external locus of control and low self-esteem on NEET outcomes from bivariate probit models imposing increasingly stronger levels of correlations between error terms. The true level of correlation between the errors is unknown. However, we follow Johnston et al. (2013) and we use the correlations between the outcomes and each specific personality traits in a linear model without other covariates (reported in the first column of Table 6) as a guide in varying ρ. For example, it is reasonable to assume that unobserved factors will affect grit and NEET outcomes in opposite directions. The coefficient of high grit in a linear model where we regress the probability of being NEET on it, with no other covariates is equal to -0.11 and therefore we vary ρ between 0 and – 0.15.
The results presented in Table 6 generally confirm the findings obtained with OLS and PSM and presented in Tables 4 and 5. The effect of grit on the chances of being NEET for at least two years remains negative and significant when increasingly negative levels of correlations are imposed, especially in Model 2. The last column of Table 6 shows results from the second part of the AET method, i.e. the bivariate probit model, estimated with the stringent condition that selection on observables is equal to selection on unobservables. The positive effects of grit on chances of being NEET for at least two years persist when selection on observables is set equal to selection on unobservables.
Similarly, results from the AET test confirm that youths with low self-esteem face increased chances of being NEET and remaining in this condition for at least two years. Results are not sensitive to increasing level of positive correlation between the error terms and the coefficient of low self-esteem remains positive and significant when selection on observable is set equal to selection on unobservables.
3
The results are slightly different from the ones from a probit model reported in Table 3 because in the AET test we consider one personality trait at a time, in order to construct the bivariate probit model.
24
Table 6 Sensitivity Analysis: Effect of personality traits on NEETstatus given different
assumptions on the correlations of disturbances in Bivariate Probit (AET Test) – Marginal Effects
Gritty – Model 2 ρ= 0 ρ= -0.05 ρ= -0.1 ρ= -0.15 ρ set such that
select on obs.= select on unobs. NEET -0.481 -0.395 -0.307 -0.220 0.048 -0.11 (0.049)*** (0.049)*** (0.049)*** (0.049)*** (0.048) [-0.092] [-0.077] [-0.062] [-0.046] [.011] rho = -0.29 Core NEET -0.614 -0.527 -0.438 -0.349 -0.205 -0.05 (0.086)*** (0.086)*** (0.085)*** (0.085)*** (0.084)** [-0.033] [-0.029] [-0.026] [ -0.021] [-0.013] rho = -0.22 Gritty – Model 3 NEET -0.386 -0.299 -0.211 -0.123 0.361 -0.11 (0.052)*** (0.051)*** (0.052)*** (0.052)** (0.048)*** [-0.069] [-0.055] [-0.039] [-0.024] [0.084] rho = -0.40 Core NEET -0.532 -0.443 -0.353 -0.262 0.124 (0.091)*** (0.091)*** (0.091)*** (0.091)*** (0.087)*** -0.05 [-0.022] [-0.019] [-0.016] [-0.013] [=0.008] rho = -0.34 Low self-esteem – Model 2
ρ= 0 ρ= 0.05 ρ= 0.1 ρ= 0.15 ρ set such that
select on obs.=select on unobs. NEET 0.401 0.318 0.233 0.151 0.420 0.08 (0.039)*** (0.039)*** (0.039)*** (0.039)*** (0.039)*** [0.098] [0.076] [0.055] [0.035] [0.103] rho = -0.01 Core NEET 0.217 0.133 0.050 -0.031 0.225 0.03 (0.057)*** (0.056)** (0.053) (0.056) (0.057)*** [0.018] [0.011] [0.004] [-0.002] [0.019] rho = -0.04 Low self-esteem – Model 3 NEET 0.382 0.299 0.214 0.132 0.259 0.08 (0.041)*** (0.041)*** (0.041)*** (0.041)*** (0.041)***
Core NEET [0.085] [0.065] [0.046] [0.028] [0.056] rho=0.07
0.03 0.197 0.114 0.031 -0.049 0.082
(0.059) (0.059)* (0.059) (0.059) (0.059)
[0.013] [0.007] [0.001] [-0.003] [0.005] rho = 0.068
External Locus of Control – Model 2
ρ= 0 ρ= 0.05 ρ= 0.1 ρ= 0.15 ρ set such that
select on obs.= select on unobs. NEET 0.290 0.205 0.121 0.039 -0.681 0.12 (0.048)*** (0.048)*** (0.048)** (0.048) (0.042)*** [0.067] [0.046] [0.027] [0.008] [-.135]rho = 0.58 Core NEET 0.350 0.267 0.183 0.102 -0.633 0.05 (0.067)*** (0.067)*** (0.067)*** (0.066) (0.058)*** [0.029] [0.021] [0.014] [0.007] [-0.048] rho = 0.59 External Locus of Control – Model 3 NEET 0.148 0.064 -0.018 -0.099 -0.895 0.12 (0.051)*** (0.051) (0.051) (0.051) (0.043)*** [0.030] [0.013] [-0.003] [-0.019] [-0.158] rho = 0.64 Core NEET 0.228 0.145 0.0636 -0.016 -0.860 0.05 (0.071)*** (0.07)** (0.071) (0.070) (0.059)*** [0.015] [0.009] [0.004] [ -0.00095] [-0.057] rho = 0.66 Note: Standard errors are in parentheses. Marginal effects in brackets. * indicates that the underlying coefficient is significant at 10% level, ** at 5% and ***at 1%. Additional variables included in the analysis are listed at p. 9. Results from an OLS regression of NEET outcomes on personality traits with no additional covariates are reported in the first column in italic.
25
Lastly, we vary the level of positive correlation between the error terms in the estimation of the effect of external locus of control. The effect of external locus of control on the chances of being NEET is relatively sensible to the imposed increasing level of correlation, especially in Model 3 (where we also control for previous GCSE attainments). When ρ is set equal to 0.15, the estimated effect of external locus of control on NEET outcomes becomes statistically insignificant. When selection on observables is set equal to selection on unobservables, the effect of external locus of control seems particularly sensitive to high levels of positive correlation (rho = 0.6) and changes sign.
In general, we believe that results from the AET test confirm our original hypothesis of significant effects of personality traits (and in particular grit and self-esteem) on decisions to drop out of education and labour market.
As shown in Appendix Table A2, the effects of personality traits are higher than the effect of other important variables, such as maternal education and employment status, or growing up in a single parent household. The results from Appendix Table A2 are consistent with our expectations and with previous literature on NEET. The most important determinant of NEET status is GCSE attainment. Youths that have achieved at least 5 GCSE with grades from A* to C are less likely to being NEET for one or more years in our sample. Generally, youths from high income and high education families are less likely to be NEET. Boys face higher risks than girls, and so do children who come from single parent households or whose mothers are unemployed or out of the labour force. Ethnic minorities seem less likely to become NEET.
6. Conclusion and Discussion
This study has analysed the effect of grit, low self-esteem and external locus of control on the risk of dropping out from education and labour market for English youths. We used the Longitudinal Study of Young People in England which is a rich source of information on English teenagers and can be linked to the National Pupil Database in order to get detailed information on
26
school outcomes. We find that personality traits have a strong and relevant effect on chances of being out of education or employment between ages 18 and 21. The size of the effect is notable and is higher than other important variables, such as maternal education or employment status, or growing up in a single parent household.
Our analysis is performed using Ordinary Least Squares, Propensity Score Matching and the methodology proposed by Altonji et al. (2005) which relies on using the selection on observable traits to provide information about the selection on unobservable characteristics. We use the extensive information available in LSYPE and increase our set of independent variables, in order to control for a wide set of factors affecting both NEET outcomes and personality traits. Our results are stable over the three different specifications of our model. Further, Propensity Score Matching allows us to compare a group of children who did not have specific personality traits with youths with similar observable characteristics who have those characteristics.
The paper provides further evidence of the positive effects of grit on long term life outcomes and on the negative effect of low self-esteem and external locus of control. In particular, we show that grit significantly decreases the chances of dropping out of education or the labour market, while youths with low self-esteem and external locus of control are more likely to experience these conditions.
A variety of interventions have been suggested that exploit the early malleability of personality to improve long term outcomes. The World Bank has recently promoted the STEP Skills Measurement Program, in collaborations with Angela Duckworth and other researchers in the field of psychology, with the objective of improving ways to measure and analyse the importance of socio-emotional skills among youth and adults. Recent research in the area has confirmed the positive effect of interventions aimed at teaching school children the importance of effort, perseverance and motivation to increase school results, especially for disadvantaged children (Blackwell et al., 2007 and Duckworth et al., 2013).
27
In the United States, programs such as the “Academic Youth Development”, “Brainology Online”, or “Character Growth Card” have been developed and implemented, with the purpose of changing high school students’ mindsets, and teaching that intelligence or skills are not fixed, but, rather, can be improved through effort and dedication (Dweck, 2007).
A UK example of a personality-targeted intervention is SEAL (Social and Emotional Aspects of Learning), a voluntary program designed to develop the social and emotional skills of all school pupils in the areas of self-awareness, managing feelings, empathy, motivation and social skills. SEAL is currently being implemented in around 90% of primary schools and 70% of secondary schools. Various evaluations of SEAL have been conducted. Hallam, Rhamie and Shaw (2006) concluded that primary SEAL “had a major impact on children’s well-being, confidence, social and communication skills, relationships, including bullying, playtime behaviour, pro-social behaviour and attitudes towards schools”. The evaluations of a number of existing policies have shown that changing personality is possible and interventions are useful, especially when they target young children and adolescents. We believe that our analysis shows some of the long term benefits of programs focused on suppressing harmful traits (such as low self-esteem or external locus of control) and promoting positive attitudes, such as perseverance towards long term goals, determination and motivation. The benefits of this kind of program may span a wide range of achievements, which might have important long lasting consequences on individuals’ lives and society as a whole.
Our results here strongly suggest that there is a potential for policies that exploit possible changes in personality to promote positive choices and achievements in early adulthood – outcomes that are important determinants of long run living standards.
28
References
Almlund, M., Lee Duckworth, A., Heckman, J.J., Kautz T. (2011). Personality Psychology and Economics. In Handbook of the Economics of Education. Vol. 4, ed. Hanushek E.A., Machin S. Woessmann L., 1-181. Amsterdam: Elsevier.
Altonji, J.G., Elder, T., Taber, C. (2005). Selection on Observed and Unobserved Variables: Assessing the Effectiveness of Catholic Schools. Journal of Political Economy, 113, 151-184.
Baron, J. D., Cobb-Clark, D. (2010). Are Young People’s Educational Outcomes Linked to their Sense of Control? IZA Working Paper no. 4907.
Berger, L.M., Hill, J., Waldfogel, J. (2005). Maternity Leave, Early Maternal Employment and Child Health and Development in the US. Economic Journal, 115, 29-47.
Britton, J., Gregg, P., Macmillan, L., Mitchell, S., (2011). The Early Bird… Preventing Young People from becoming a NEET statistic. Report commissioned by Praxis.
Caliendo, M., Cobb-Clark, D., Uhlendorff, A. (2014). Locus of Control and Job Search Strategies. Review of Economics and Statistics, forthcoming.
Carneiro, P., Heckman, J. J. (2003). Human Capital Policy. In J. J. Heckman, A. B. Krueger, & B. M. Friedman (Eds.), Inequality in America: What role for human capital policies? Cambridge, Mass: MIT Press.
Carneiro, P., Crawford, C., Goodman, A. (2007). The Impact of Early Cognitive and Non-Cognitive Skills on Later Outcomes, CEE DP 92.
Cebi, M. (2007). Locus of Control and Human Capital Investment Revisited. Journal of Human Resources, 42, 919–932.
Chamorro-Premuzic, T., Furnham, A. (2003). Personality Predicts Academic Performance: Evidence from Two Longitudinal University Samples. Journal of Research in Personality, 37, 319-38.
Chatterji, P., Alegria, M., Takeuchi, D., 2011. Psychiatric Disorders and Labor Market Outcomes: Evidence from the National Comorbidity Survey-Replication. Journal of Health Economics, 30, 858–868.
Cobb-Clark, D., Kassenboehmer, S.C., Schurer, S. (2014). Healthy Habits: The Connection between Diet, Exercise, and Locus of Control. Journal of Economic Behavior and Organization, 98, 1-28.
Cobb-Clark, D., Schurer, S. (2012). The Stability of the Big-Five Personality Traits. Economics Letters,
115, 11-15.
Cobb-Clark D., Schurer S. (2013). Two Economists' Musings on the Stability of Locus of Control. The Economic Journal, 123, 358-400.
Cobb-Clark D., Tan M. (2011). Noncognitive Skills, Occupational Attainment, and Relative Wages. Labour Economics 18, 1-13.
Coleman, M., DeLeire, T. (2003). An Economic Model of Locus of Control and the Human Capital Investment Decision. The Journal of Human Resources, 38, 701-721.
Cornaglia, F., Cricvellaro, E., McNally, S. (2012) Mental Health and Education Decisions. London School of Economics. Centre for the Economics of Education. DP 136.
29
Crawford, C., Duckworth, K., Vignoles, A., Wyness, G. (2010) Young People’s Education and Labour Market Choices Aged 16/17 to 18/19. Department of Education. Research Report DFE-RR182.
Dehejia, R.H., Wahba, S. (2002). Propensity Score-Matching Methods for Non-Experimental Causal Studies. The Review of Economics and Statistics, 84, 151–61.
Dehejia, R.H. 2005. Practical Propensity Score Matching: a Reply to Smith and Todd. Journal of Econometrics,125, 355-364.
Delaney, L., Harmon, C., Ryan, M. (2013). The Role of Noncognitive Traits in Undergraduate Study Behaviours. Economics of Education Review, 32, 181-195.
Drago, F. (2011), Self-Esteem and Earnings. Journal of Economic Psychology 32, 480-488.
Duncan G.J., Dunifon R.(1998) Soft-Skills and Long-Run Labor Market Success. Research in Labor Economics. S. W. Polachek, ed. Stamford, CT, JAI Press. 17, 123-149.
Duckworth, A. L., Kirby, T., Gollwitzer A., Oettingen G., (2013) From Fantasy to Action. Mental Contrasting With Implementation Intentions (MCII) Improves Academic Performance in Children, Social Psychological and Personality Science, 4, 745-753.
Duckworth, A. L., Peterson, C., Matthews, M. D., & Kelly, D. R. (2007). Grit: Perseverance and passion for long-term goals. Journal of Personality and Social Psychology, 92, 1101.
Duckworth, A. L., Quinn, P. D., & Seligman, M. E. P. (2009). Positive predictors of teacher effectiveness. Journal of Positive Psychology, 4, 540-547.
Duckworth, K., Schoon, I. (2010). Progress and Attainment During Primary School: the Roles of Literacy, Numeracy and Self-Regulation. Longitudinal and Life Course Studies, 1, 223-240. Duckworth, A., Seligman, M. (2005). Self-Discipline Outdoes IQ in Predicting Academic
Performance of Adolescents, Psychological Science, 16, 939-944.
Eskreis-Winkler, L., Duckworth, A. L., Shulman, E., & Beale, S. (2014). The grit effect: Predicting retention in the military, the workplace, school and marriage. Frontiers in Psychology, doi: 10.3389/fpsyg.2014.00036.
Goldberg, L.R., Sweeney, D. Merenda, P.F., & Hughes, J.E. (1998). Demographic variables and personality: The effects of gender, age, education, and ethnic/racial status on self-descriptions of personality attributes. Personality and Individual Differences, 24, 393-403. Goodman A., Sianesi B. (2005). Early Education and Children’s Outcomes: How Long Do the
Impacts Last? Fiscal Studies, 26, 513-548.
Gregg, P. (2001), The Impact of Youth Unemployment on Adult Unemployment in the NCDS. The Economic Journal, 111, 626–653.
Groves, M.O. (2005), How important is your personality? Labor market returns to personality for women in the US and UK. Journal of Economc Psychology 6, 827-841.
Hallam, S., Rhamie, J., Shaw, J. (2006). Evaluation of the Primary Behaviour and Attendance Pilot. Research Report RR717. Nottingham: DfES Publications
Heckman, J J., Masterov, D. (2007). The Productivity Argument for Investing in Young Children. Review of Agricultural Economics, 29, 446–93.
Heckman, J. J., Moon, S. H., Pinto, R., Savelyev, P. A., Yavitz, A. (2010). The Rate of Return to the HighScope Perry Preschool Program. Journal of Public Economics, 9, 114–128.
30
Heckman J.J., Rubinstein Y.(2001).The Importance of Noncognitive Skills: Lessons from the GED Testing Program. American Economic Review, 91, 145–149
Heckman J.J., Stixrud, J., Urzua, S. 2006. The Effects of Cognitive and Noncognitive Abilities on Labor Market Outcomes and Social Behavior. Journal of Labor Economics 24: 411-482. Johnston, D., Schurer, S., Shields, M. (2013). Exploring the intergenerational persistence of
mental health: Evidence from three generations. Journal of Health Economics, 32, 1077– 1089.
Lundberg, S. (2013). The College Type: Personality and Educational Inequality. Journal of Labor Economics, 31: 421-441.
Machin, S. & A. Manning (1999), The causes and consequences of long-term unemployment in Europe, Handbook of Labor Economics, Vol. 3, Part 3, pp. 3085-3139.
Macmillan, L. (2013). The role of non-cognitive and cognitive skills, behavioural and educational outcomes in accounting for the intergenerational transmission of worklessness. Institute of Education. University of London. Department of Quantitative Social Science. Working Paper 13-01.
McGee, A., McGee, P. (2011) Search, Effort, and Locus of Control. IZA Discussion Paper 5948. Mroz, T. & T. Savage (2006), The Long-Term Effects of Youth Unemployment, Journal of Human
Resources, 41, 259-293.
Nyhus E.K., Pons E. (2005), The Effects of Personality on Earnings. Journal of Economic Psychology, 26, 363-384.
OECD (2012) Education at A Glance, OECD.
Piatek R., Pinger P. 2010. Maintaining (Locus of) Control? Assessing the Impact of Locus of Control on Education Decisions and Wages. IZA Discussion Paper 5289.
Poropat, A.E., (2009). A Meta-Analysis of the Five-Factor Model of Personality and Academic Performance. Psychological Bullettin, 135, 322–338.
Robertson-Kraft, C., & Duckworth, A. L. (2014). True grit: Trait-level perseverance and passion for long-term goals predicts effectiveness and retention among novice teachers. Teachers College Record, 116, 1-27.
Ross, C. E., Broh, B.A. (2000). The roles of self-esteem and the sense of personal control in the academic achievement process. Sociology of Education, 73, 270- 284.
Rotter, J. (1966). Generalized Expectancies for Internal Versus External Control of Reinforcement, Psychological Monographs, 80, 1-28.
Ruhm C.J. (2008). Maternal Employment and Adolescent Development. Labour Economics, 15, 958-983.
Schurer, S. (2014). Bouncing back from health shocks: Locus of control, labour supply, and mortality. IZA Discussion Paper 8203.
Smith J., Todd P., 2004. Does Matching Overcome Lalonde’s Critique of Nonexperimental Estimators. Journal of Econometrics 125: 305-353.
Wang, L.-Y., Kick, E., Fraser, J., Burns, T.J. (1999). Status Attainment in America: The Roles of Locus of Control and Self-Esteem in Educational and Occupational Outcomes. Sociological Spectrum, 19, 281- 298.
31 Appendix
Grit– Questions in LSYPE
1. Doing well at school means a lot to me (wave 2) 2. At school, I work as hard as I can (wave 2)
3. Working hard at school now will help me to get on later in life (wave 2) 4. If you work hard at something, you will usually succeed (wave 2) 5. Studying to get a qualification is important to me (wave 7)
6. Having a job that leads somewhere is important (wave 7)
7. I don’t really think much about what I might be doing in a few years (wave 7)
Possible answers: Strongly agree, Agree, Disagree, Strongly disagree. The grit scale is calculated following Duckworth et al. (2007) as follows:
For questions 1,2,3,4, 5, 6, we assign the following points: 1 = strongly disagree, 2= disagree, 3= agree, 4= strongly agree
For question 7, we assign the following points: 1 = strongly agree , 2= agree, 3= disagree, 4= strongly disagree
Then, we add up all the points and divide by 7. The maximum score on the scale is 4 (extremely gritty) and the lowest score on the scale is 1 (not gritty at all).
Locus of control – Questions in LSYPE (wave 2) 1. I can pretty much decide what happens in my life 2. If someone is not a success in life, it is usually his fault 3. How well you get in this world is mostly a matter of luck 4. Even if I do well at school, I will have a hard time 5. People like me do not have much of a chance
6. If you work hard at something, you will usually succeed
Possible answers: Strongly agree, Agree, Disagree, Strongly disagree Self-esteem – Questions in LSYPE (repeated at wave 2 and wave 4) 1. How useful you have felt recently?
2. How much you have been thinking of yourself as a worthless person recently?
32
Table A1 shows results from balance tests of the estimation performed with Model 3 on the effect of grit on the chances of being NEET in at least one wave, in the period w4-w7. The output shows values of each variable for the matched sample. In each row, it shows the mean of the variable for the treatment group and the mean for the control group. It also shows the “%bias,” which is the standardized bias. This “bias” is defined as the difference of the mean values of the treatment group and the (not matched / matched) non treatment group, divided by the square root of the average sample variance in the treatment group and the not matched non treatment group. The table also shows the % reduction in bias, which is how much of this bias was eliminated by matching. In this example, there are few variables exhibiting negative values for this column (meaning that the bias increased as a result of matching) and these are mostly cases in which the bias was already very low before matching. To assess balance, one should look at both the bias and the mean differences between treatment and control in the matched sample. In our example, the bias is significantly reduced after matching (the mean goes from 7.22 to 2.46). The last two columns present results from a t-test on the hypothesis that the mean value of each variable is the same in the treatment group and the non-treatment group after matching. If p>0.1, the null hypothesis cannot be rejected on the 10% significance level. The null hypothesis that the mean values of the two groups do not differ after matching cannot be rejected for most of the variables included in our analysis. By matching, the differences between treatment group and non-treatment group are reduced considerably.
A summary of the distribution of the absolute bias shows that before matching: Mean = 7.22 SD=8.99 and after matching: Mean = 2.46; SD=1.91
33
Table A1 Balance tests for Propensity Score Matching (Estimation of the effect of grit on being NEET – Model 3)
Variable Mean -
Treated
Mean Control % Bias % Fall in
Bias
t p
Has 5+ GCSE with grade A*-C
.6748 .68997 -3.1 91.3 -0.99 0.322
HH yearly income >31,200£
35339 .36043 -1.5 62.2 -0.45 0.655
HH yearly income betw. 11,400£ and 31,200£
.42493 .40163 4.7 5.6 1.44 0.151
Birth weight 3.2889 3.2976 -1.5 83.5 -0.45 0.651
Premature birth .10298 .1084 -1.8 -143.1 -0.54 0.592
Has older siblings .8065 .79675 0.9 89.8 0.29 0.772
Grandparents went to university
.09973 .1019 -0.7 84.9 -0.22 0.827
Child has disabilty .12846 .129 -0.2 96.7 -0.05 0.961
Main parent has disability .20054 .21138 -2.7 -35.4 -0.81 0.416
Mother has a university degree
.15501 .15447 0.2 98.0 0.05 0.964
Mother has other higher education
15014 .17019 -5.7 -221.6 -1.66 0.097
Mother senior high school graduate
.1355 .12466 3.1 24.5 0.98 0.328
Mother junior high school graduate
.29485 .29973 -1.1 57.3 -0.32 0.746
Mother has qualifications level 1 or below
.08618 .07425 4.2 -78.1 1.33 0.183
Mother has other qualification
.02764 .03035 -1.6 -59.7 -0.49 0.624
Male .44878 .42873 4.0 75.2 1.23 0.220
Single parent at birth .19675 .20108 -1.1 60.1 -0.33 0.742
Mother younger than 20 at birth
.05854 .05095 3.2 -218.3 1.01 0.311
Black 08943 .06992 8.1 65.1 2.19 0.029
Asian .15014 .15989 -3.1 87.1 -0.82 0.413
Mixed .06721 .0607 2.6 -26.0 0.81 0.420
Mother was unemployed at wave 1
.01138 .01084 0.5 -3014.5 0.16 0.875
Mother was out of the labour force at wave 1
.24444 .24065 0.9 59.4 0.27 0.788
34
Table A2 Effect of other independent variables on NEET Status and subjects’ choice - OLS Estimation Results from Model 3
NEET Core NEET NEET Years
Has 5+ GCSE with grade A*-C -0.155 -0.049 -0.230
(0.011)*** (0.006)*** (0.017)*** HH income >31,200£ -0.031 -0.011 -0.041 (0.015)** (0.009) (0.024)* Income betw. 11,400£ - 31,200£ -0.009 0.001 -0.003 (0.013) (0.008) (0.021) Birth weight -0.008 -0.001 -0.021 (0.009) (0.006) (0.015) Premature birth -0.033 -0.006 -0.050 (0.017)* (0.010) (0.028)*
Has older siblings 0.025 0.008 0.037
(0.005)*** (0.003)*** (0.008)*** Grandparents went to university -0.010 -0.006 -0.018
(0.017) (0.010) (0.027)
Child has disabilty 0.024 0.002 0.032
(0.014)* (0.008) (0.022)
Main parent has disability 0.022 -0.002 0.013
(0.012)* (0.007) (0.020)
Mother –University degree -0.046 -0.021 -0.087
(0.020)** (0.012)* (0.032)***
Mother – Other Higher Education -0.047 -0.034 -0.105 (0.019)** (0.011)*** (0.031)***
Mother senior high school gr. -0.057 -0.031 -0.107
(0.018)*** (0.011)*** (0.030)***
Mother junior high school gr. -0.028 -0.023 -0.066
(0.016)* (0.010)** (0.026)**
Mother has low qualification -0.007 0.006 -0.009
(0.020) (0.012) (0.033)
Mother has other qualification -0.002 -0.015 -0.032
(0.030) (0.018) (0.048)
Male 0.022 0.002 0.026
(0.010)** (0.006) (0.016)*
Single parent at birth 0.050 0.008 0.060
(0.013)*** (0.008) (0.022)***
Mother younger than 20 at birth 0.027 0.022 0.051
(0.021) (0.013)* (0.034) Black -0.054 -0.016 -0.074 (0.022)** (0.013) (0.036)** Asian -0.071 -0.027 -0.108 (0.018)*** (0.011)** (0.029)*** Mixed -0.019 -0.013 -0.048 (0.020) (0.012) (0.033)
Mother unemployed at wave 1 0.011 0.101 0.155
(0.044) (0.027)*** (0.072)**
Mother out of the labour force at 0.041 0.026 0.084
Wave 1 (0.012)*** (0.007)*** (0.020)***
Single mother at wave 1 0.032 0.017 0.057
(0.014)** (0.008)** (0.022)***
Constant 0.246 0.080 0.402
(0.037)*** (0.022)*** (0.060)***
R2 0.14 0.06 0.12
N 5,180 5,180 5,180
Note: Standard errors are in brackets. * indicates that the underlying coefficient is significant at 10% level, ** at 5% and ***at 1%