University of Leeds Press
Micro-hydro power in Dorset: A re-assessment
of potential installed capacity
Harry J.R. Driscoll
School of Earth & Environment, University of Leeds, Leeds, W. Yorkshire LS2 9JT; Tel: 0113 3436461
Abstract
Faced with the twin threats of human-induced climate change and concerns over security of supply, the UK must find new and sustainable sources of energy to fuel the ever-increasing demand. The UK government’s recently published Energy Strategy – ‘The Energy Challenge’ – outlines a shift in policy away from imports and traditional fossil fuels towards locally produced and renewable sources of energy. Along with a series of new nuclear power stations and several large-scale renewable energy projects, the government highlights micro-generation as a key contributor to future energy supply. Micro-hydro power is one of a number of different micro-generation options, and although the technology has been around for many years, its true potential has yet to be realised. This study estimates the potential for micro-hydro power in the county of Dorset based on the latest available technology and shows that this Figure is much greater than was previously estimated. If these findings are scaled up for the whole of the UK, the total contribution from micro-hydro is still relatively small, yet current literature suggests that integration with other small-scale technologies such as solar power and micro-wind, in combination with large-scale renewable projects and a policy to reduce energy demand, could lead the UK to realistically achieving a sustainable future with regards to energy. The paper also calls for standardised definitions for small-scale hydropower and provides an insight into the various methodologies for estimating potential, giving an account of the errors and uncertainties associated with these methods.
52 ISSN 1744-2893 (Online)
1 Introduction 1.1 Energy use
Worldwide energy use is constantly increasing as rapid population growth and economic development fuel demand (IEA, 2006). Demand for primary energy increased by 80% in 3 decades from 5,000 million tonnes of oil equivalent (Mtoe) in 1970 to 9,100Mtoe in 2001 (Hillman, 2004), and that trend is continuing with demand reaching 10,624Mtoe in 2005 and 10,879Mtoe in 2005 (BP, 2007). As a result carbon dioxide (CO2) emissions from the combustion of fuel have also increased dramatically from 15,661 million tonnes of carbon dioxide (Mt CO2) in 1973 to 26,583Mt CO2 in 2004 (IEA, 2006).
1.2 The United Kingdom
The United Kingdom (UK) is indicative of this trend as the requirement for energy continues to rise as people use more and more electronic devices, drive more cars and generally lead more energy-intensive lifestyles (DTI, 2006a). This insatiable desire for energy is now starting to cause concern, and the problem is essentially two-fold.
Firstly, traditional energy sources such as coal and oil are heavily polluting, releasing large quantities of CO2 into the atmosphere upon combustion; coal the most polluting of these fuels at 0.08 kilograms of carbon per kilowatt hour (kgC kWh-1) (Hillman, 2004) or approximately 0.298 kilograms of carbon dioxide per kilowatt hour (kgCO2 kWh-1) (Batey and Pout, 2005), closely followed by oil at 0.07kgC kWh-1 (Hillman, 2004), approximately 0.265kgCO2 kWh-1 (Batey and Pout, 2005). This CO2 then accumulates in the atmosphere, trapping outgoing terrestrial radiation, accentuating the natural greenhouse effect and contributing to global warming (Houghton et al.., 2001).
Secondly, in order to reduce emissions of CO2, there was a major switch to natural gas, which emits a much lower 0.05kgC kWh-1 (Hillman, 2004) or 0.191kgCO2 kWh-1 (Batey and Pout, 2005) in the UK, with supplies initially coming from the North Sea (Everett, 2003; Spooner, 1995). However, as these reserves have been depleted, the country has become increasingly reliant upon imported gas (IEA, 2006), often sourced from volatile parts of the globe (DTI, 2006a) raising questions about the reliability of this fuel as a major source of energy in the future.
This combination of the threat of man-made climate change and concerns over security of supply have led the UK government to publish a review outlining its future strategy for energy (DTI, 2006a). This report focuses on the importance of obtaining energy from low-carbon, local sources and, along with nuclear power and large-scale renewables, highlights micro-generation as a key part of future energy supply (DTI, 2006a).
1.3 Micro-hydro power
Micro-hydro power is identified as one of these micro-generation options (DTI, 2005b) and it is this particular source of energy that is the focus of this study.
1.3.1 The UK
According to Reynolds (1983), there were once somewhere in the region of 30,000 mills in operation in the UK and although the majority of these are no longer operational, many structures still remain (Mills Archive, 2007), and these sites can therefore potentially be used for modern hydroelectric installations (HydroGeneration Ltd, 2003).
1.3.2 Dorset
Some estimates suggest there were once as many as 250 working mills at one time in the county of Dorset and up to 400 different mill locations over time (Ludgate, 1963). However, in 1989 the University of Salford Civil Engineering Department was commissioned by what was then called the Department of
Energy to carry out a nationwide assessment of hydropower titled ‘Small-scale Hydroelectric Potential in the UK’, and although this was a comprehensive study covering both ‘run-of-river’ and water authority sites across England, Wales, Scotland and Northern Ireland (ETSU, 1989), in Dorset only two sites – Durweston Mill (65kW) and Fiddleford Mill (43kW) – were identified as being potential sites for hydropower (CSE, 2005). A number of other sites were identified, but these were rejected by the parameters of the study. These included rejecting all sites with a potential of less than 25kW or less than 50kW with no onsite demand, a head of less than 2m, or restrictions to access (ETSU, 1989). These parameters were set initially to limit the scope of the study due to time and cost constraints (ETSU, 1989) but also because at the time it was commissioned, the technology to develop these sites was not readily available and this meant that the sites were neither practically nor economically viable.
1.4 Rationale for this study
In the 18 years since the study was published the technology has improved rapidly, to the point where sites with a potential of as small as 200W or a head as low as 1m (Fuentes, 2004) are now worth developing. Quite simply, the Salford study, whilst hugely influential at the time, is now out of date, yet it remains the main point of reference for UK hydropower potential and is still used when setting county targets for renewable energy (CSE, 2005).
1.5 Aims
This study aims to update current knowledge to give a more realistic assessment of the potential for micro-hydro power in the county of Dorset based on the latest technology available and also aims to ascertain whether this potential is greater than previously estimated.
1.6 Research Questions
The report will attempt to answer the following research questions:
1. Where will the UK obtain its energy from in the future and what are the prospective sources? 2. What energy options are available in Dorset and which of these are most suitable?
3. What is the role of these various alternatives in contributing to the county’s renewable energy targets?
4. What is the potential for micro-hydro and how does this compare to previous assessments? 1.7 Hypothesis
The report will also test the following hypothesis:
H0 The potential for micro-hydro power in Dorset is not significantly greater than previously estimated. H1 The potential for micro-hydro power in Dorset is significantly greater than previously estimated.
2 Energy 2.1 Preamble
Defined as the capacity to do work (Boyle, 2003), energy forms a key part of everyday life. Energy is required to switch on lights; drive cars; make products and heat homes and workplaces (DTI, 2004). As a country’s economy grows, demand for energy increases as the number of appliances owned increases and more functionality is demanded from new products (DTI, 2004).
2.2 Consumption
A Department of Trade and Industry (DTI) report on Energy Consumption in the UK found that consumption in 2001 (the latest year considered) was higher than in any other year over the last thirty
years (DTI, 2004). The study concluded that overall energy consumption in the UK had increased by 13 per cent since 1970 and by 11 per cent since 1990 (DTI, 2004).
0.0 20.0 40.0 60.0 80.0 100.0 120.0 140.0 160.0 180.0 1980 1981 1982 1983 1984 1985 1986 1987 1988 1989 1990 1991 1992 1993 1994 1995 1996 1997 1998 1999 2000 2001 Year Domestic Industry Services Transport
Figure 2.1 Final energy consumption by sector (DTI, 2002)
Figure 2.1 shows final energy consumption by sector. As the graph illustrates, the two sectors with the greatest demand for energy are the domestic and transport sectors – each responsible for about one third of final energy consumption, with industry and services accounting for the other third between them. 2.3 Sources 36% 36% 19% 8% 1% Oil Natural Gas Coal Nuclear Energy Hydro electric
Figure 2.2 shows primary energy consumption by fuel for 2006. The pie chart shows clearly the heavy dependence upon fossil fuels: over 90 percent of UK primary energy coming from coal, oil and gas. 2.4 Uses 1% 3% 18% 27% 1% 2% 15% 1% 2% 2% 1% 27% Agriculture Mining and quarrying Manufacturing
Electricity, gas and water supply Construction
Wholesale and retail trade Transport and communication Other business services Public administration
Education, health and social work Other services
Domestic
Figure 2.3 Direct use of energy from carbon fuels in 2004 (DTI, 2005a)
1% 3% 17% 17% 16% 1% 1% 3% 12% 2% 1% 2% 1% 23% Agriculture Mining and quarrying Manufacturing
Electricity, gas and water supply of which - transformation losses by major producers
- distribution losses of electricity supply Construction
Wholesale and retail trade Transport and communication Other business services Public administration
Education, health and social work Other services
Domestic
Figure 2.4 Direct use of energy including electricity in 2004 (DTI, 2005a)
Figure 2.3 shows the direct use of energy from carbon fuels and Figure. 2.4 direct use of energy including electricity. Both Figures again illustrate the impact of the domestic sector on energy use but Figure. 2.3 also highlights the dependence of the electricity, gas and water supply services upon
carbon-based fuels.
Figure 2.5 The UK energy system (DTI, 2006a)
Figure 2.5 outlines the structure of the UK energy system and shows the main inputs – coal, oil gas, renewables and nuclear, and outputs – transport, heat and power (DTI, 2006a). The Figure indicates that the transport sector relies totally upon the input of oil to operate, whilst heat and power is provided from a variety of sources. The chart shows clearly the heavy reliance of all sectors upon fossil fuels with zero/low CO2 sources only contributing to 25 percent of electricity generation. What the chart does show however is that both heat and power can be provided by electricity, which can in turn be generated from zero or low carbon sources.
2.5 Electricity 2.5.1 Uses 8% 8% 28% 28% 24% 3% 1%
Fuel industry use
Transmission and distribution losses Domestic
Industry
Commercial and Public Administration Transport (including associated buildings Agriculture Oil Gas Coal Renewables Nuclear Electricity
Gasoline or Diesel Transport
Heat
(homes and business)
Power services (homes and business) 37%
34%
20% 5%
Figure 2.6 Breakdown of UK electricity use in 2000 (DTI, 2001)
Figure 2.6 shows that, as with energy use, the domestic sector is again the largest user of electricity, joint first with industry who both account for just under one third of UK electricity use.
2.5.2 Sources Coal 34% Oil 1% Gas 37% Nuclear 20% Renewables 5% Other 3%
Figure 2.7 Sources of UK electricity in 2005 (DTI, 2006a)
The current mix of electricity supplies is graphed in Figure. 2.7, which shows a breakdown of electricity sources for 2005. The chart shows that, in a similar vein to energy supply, almost ¾ of UK electricity is generated by fossil fuels: the other main contributor being nuclear power
2.5.3 Projections 0 50 100 150 200 250 300 350 400 450 1990 1995 2000 2005 2010 2015 2020 Year Pumped Storage Imports Renewables Nuclear Gas Oil Coal
Figure 2.8 Electricity generation fuel mix (central favourable to coal) (DTI, 2006a) 0 50 100 150 200 250 300 350 400 450 1990 1995 2000 2005 2010 2015 2020 Year Pumped Storage Imports Renewables Nuclear Gas Oil Coal
Figure 2.9 Electricity generation fuel mix (central favourable to gas) (DTI, 2006a)
Figures 2.8 and 2.9 show the past and projected electricity generation fuel mix for the UK. The Figures illustrate the impact of the expected closure of nuclear and coal fired power stations, the increasing dependence on natural gas and the expected increased contribution from renewable energy sources. 2.6 Fossil Fuels
2.6.1 Coal
Coal has been the main source of energy in the UK since the industrial revolution (DTI, 2003) and even today, as demonstrated in previous Figures, coal generation provides around a third of the UK’s power output. Indeed the country’s reliance upon coal was no more apparent than the winter of 2005/2006 when coal-fired power stations provided over 50% of electricity requirements (DTI, 2006a).
However, according to the government, British coal production has fallen significantly in the last decade. In 1995/1996 over 50 million tonnes (Mt) was produced from 83 deep and 122 surface mines, yet by 2005/2006 production had fallen to around 20 Mt from 13 deep and 31 surface mines (DTI, 2006a). From an environmental perspective, coal is the most carbon intensive of the major forms of electricity generation – an average of 238 tonnes of carbon per gigawatt hour (GWh) of electricity generated, compared with 99 tonnes for gas (DTI, 2006b). According to the government, the future for coal must lie in cleaner coal technologies – which can increase the efficiency of coal-fired power stations and thereby reduce the amount of carbon they produce – or carbon capture and storage (CCS) (DTI, 2003). Indeed, CCS, which involves capturing carbon from a process that produces carbon and transporting it to a site where it is safely stored underground, could reduce carbon emissions by 80 to 90 per cent (DTI, 2006b).
Having said this, coal also has a number of other environmental impacts, which range from the impact of mining activities on the visual environment to the release of methane into the atmosphere, the dispelling of contaminated water and the generation of waste products (DTI, 2006b). There also exists social impacts, which include diseases that coal miners can contract and, when coal mining ceases, the
Furthermore, when coalmines close, the land can become derelict due to the presence of chemical wastes or the presence of physical hazards such as shafts, holes and tunnels (DTI, 2006b). Therefore, although CCS could offset the release of CO2 into the atmosphere, coal production and consumption still remains a most destructive industrial process (Hawkins et al.., 2006).
According to BP (2006) the UK has coal reserves totaling 1.3 million tonnes of coal equivalent (Mtce), 0.2% of the total world reserves. In terms of energy this Figure equates to 1.8GW of power or 1.04×10⁹ kWh (BP, 2006). The government is of a mind to use these remaining reserves, but only where it is economically viable and environmentally acceptable to do so (DTI, 2006a).
2.6.2 Oil and Gas
At the end of 2005 the UK had the equivalent of 4 thousand million barrels or 545Mt of proved oil reserves (BP, 2006). Working, therefore, on the assumption that 1Mt of oil produces approximately 4.5 terawatt hours (TWh) of electricity (BP, 2006) the UK resource is huge.
For natural gas, at the end of 2005 the UK had just over half a trillion cubic metres or 4.77Mtoe of proved reserves (BP, 2006).
According to the DTI (2006d) current estimates place the UK combined oil and gas resource at between 21 and 27 billion barrels of oil equivalent (boe) down from 35 billion boe in 2005. However, oil and gas production from the UK continental shelf (UKCS) peaked in 1999, has declined since and is expected to continue to decline (DTI, 2006a). In 2004, the UK exported 93Mt of oil and 7Mtoe of gas (DTI, 2006a), but at the same time, as reported in the same document, the UK also imported 90Mt of oil and 14Mtoe of gas (DTI, 2006a).
2.7 Nuclear Fission
The government’s position on the future of nuclear power has shifted significantly over the past few years. In its 2003 Energy White Paper the DTI said categorically that new nuclear build was not an option due to the economics at the time and concerns over what to do with the radioactive waste (DTI, 2003). However, with the publication of the Energy Strategy in 2006 the government changed its opinion on nuclear from a negative one to a positive one. According to the review, the economics of nuclear now look more positive than at the time of the 2003 Energy White Paper and work is underway to tackle the legacy of nuclear waste (DTI, 2006a).
However, a paper published in 2007 found that a material that had promised to lock up nuclear waste for hundreds of thousands of years might not be as effective as was previously thought (Edwards, 2007). The paper found that in tests with zircon – a material that naturally locks up radioactive materials such as uranium and thorium in the Earth’s crust (Edwards, 2007) – radioactive alpha particles actually caused five times the damage to the material than was predicted in computer models (Farnan, 2007). Although the author believes it is possible to create synthetic ceramics that don’t lose their crystalline structure as quickly as zircon (Edwards, 2007) at the present time no silver bullet exists to the problem of radioactive waste, and although modern nuclear plants produce significantly less waste than early generations of nuclear reactors if the current level of nuclear capacity were replaced with new build, existing waste stocks would still increase by about 10% by volume (DTI, 2006a).
Nuclear also raises the question of sustainable development, defined loosely as ‘development that meets the needs of the present without compromising the ability of future generations to meet their own needs’ (WCED, 1987), and more importantly, whether the UK government can really claim to be pursuing such an ideology (ODPM, 2005) whilst still supporting new nuclear build.
2.8 Renewable Energy
Renewable energy sources are sources of energy that are continuously replenished by natural processes (Boyle, 2003), or energy flows, which are replenished at the same rate as they are used (Sorensen, 1999).
2.8.1 Renewable Heat
Solar thermal energy can be captured in a number of different ways including active solar heating (ASH), solar thermal engines, passive solar heating and ‘daylighting’ (Everett, 2004). It has been estimated that 50% of UK domestic buildings could be suitable for solar hot water heaters, which would result in the offsetting of 9.6 terawatt hours per year (TWh y-1) of oil and gas and 2.4TWh y-1 of electricity (DTI, 1999). In addition to this the government estimates that passive solar heating could contribute up to 10TWh y-1 of primary energy by 2010 (DTI, 1999), and daylighting between 5TWh y-1 and 9TWh y-1 by 2020 (Everett, 2004).
Bioenergy is roughly defined as energy derived from materials such as wood, straw or animal wastes, which were living matter relatively recently (Larkin et al.., 2004). These materials – collectively known as biomass – include anything derived from plant or animal matter, including agricultural, forestry or wood wastes/residues and energy crops (DTI, 2003). Bioenergy sources can be split into two areas: Energy crops, which are crops grown for the purpose of energy generation, such as short rotation coppice willow and miscanthus (DTI, 2003), and different types of waste including wood residues, crop wastes, animal wastes, human or municipal solid waste (MSW), commercial and industrial wastes and landfill gas (Larkin et al.., 2004).
UK potential for bioenergy is difficult to gauge but one study suggested an economic potential of 40TWh by 2025, based on 7.5TWh from landfill gas; 19TWh from straw, chicken litter and forestry wastes; and 13.5TWh from MSW combustion (ETSU, 1999). In addition to this the contribution from energy crops could be in the order of 33TWh – some 10% of 2003 UK electricity demand (Larkin et al.., 2004).
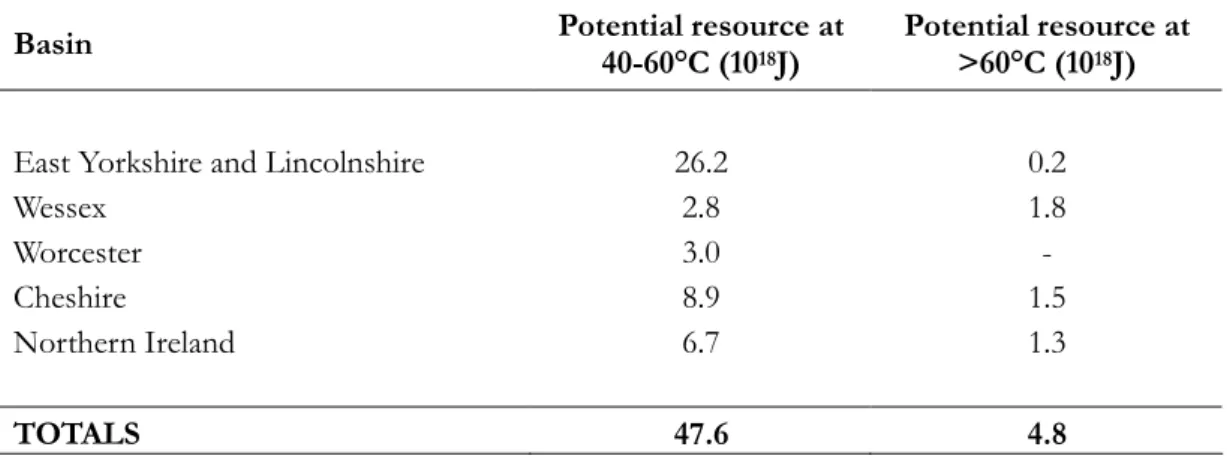
Table 2.1 Potential UK geothermal energy resources at different temperatures (Boyle, 2004)
Basin Potential resource at
40-60°C (1018J)
Potential resource at >60°C (1018J)
East Yorkshire and Lincolnshire 26.2 0.2
Wessex 2.8 1.8
Worcester 3.0 -
Cheshire 8.9 1.5
Northern Ireland 6.7 1.3
TOTALS 47.6 4.8
Table 2.1 shows the potential geothermal energy resources in the UK at different temperatures. As well as these aquifers the UK is also in the possession of a significant Hot Dry Rocks (HDR) resource and it has been estimated that the HDR resource base in the southwest of England alone might be equal to current UK coal reserves (Boyle, 2004).
2.8.2 Renewable Electricity
In its 2003 Energy White Paper the UK government set a target of 10% of electricity supply from renewable energy by 2010, with a longer-term target to derive 20% of electricity from renewable sources by 2020 (DTI, 2003). Additionally, according to the government’s recent review of energy policy – ‘The Energy Challenge’, the next twenty years will require substantial new investment (in the order of 25GW)
stations and to meet the expected growth in electricity demand (DTI, 2006a). The following technologies fall within the definition of renewable electricity and could feasibly be exploited to meet the two requirements listed above.
The total annual solar energy received by the Earth is more than 15,000 times as great as the planet’s current yearly use of fossil and nuclear fuels (Hordeski, 2003) and although the UK is not the sunniest country in the world, the annual solar energy incident on UK buildings is still an impressive 1614TWh y-1 (Muneer et al.., 2003). Indeed, if modern photovoltaic (PV) technology were applied to all available roofs in the UK it would generate more electricity than the nation currently consumes in a year (Leggett, 2002) and if PV modules of 10% average annual conversion efficiency were located on about 1.4% of the country’s land area they could produce some an annual output of approximately 350TWh, equivalent the nation’s current electricity consumption (Boyle, 2004).
However there is a huge difference between the total available resource and the viable technical or economic potential. For example one study estimated that the ‘technical potential’ for building integrated PV in the UK by 2025 would be in the order of 37TWh y-1, yet the same study also suggested that the ‘economic potential’ would be no greater than 0.5TWh y-1 (Chapman and Goss, 2002).
Furthermore, the resource availability in the UK is fairly low for the October–February period, when electricity demand is highest (Muneer et al.., 2003). According to reports from both government and NGO sources, whereas current UK electricity consumption is approximately 350TWh y-1, the potential for solar electrical generation is only 200TWh y-1 (DTI, 1995; Solar electric, 1996).
In conclusion there is no doubt that PV has potential to provide energy for the UK but it looks likely to be an expensive option in UK conditions for some time to come (Gross, 2004) and even though global PV capacity is doubling every two years and installations in the UK are increasing all the time (DTI, 2005b), less than a quarter of existing PV installations are economic, and only pay off where there is no mains electricity (Hamer, 2006). However, PV in buildings could play an important role if materials that displace conventional roofing and cladding materials become widely acceptable to the building industry (Gross, 2004).
As with solar power, the total wind energy resource is estimated at a massive 53,000TWh y-1 (Grubb and Meyer, 1993), but of course the achievable potential is much lower. The UK is well endowed with wind resources and has the most intense wind energy resource in Europe due to its western location that is subjected to the main Atlantic weather fronts (Petersen and Troen, 1990). The technical potential for onshore wind in the UK is estimated at 57GW or 114TWh y-1 (EWEA, 2002), and the estimated offshore potential is 48GW of installed capacity by 2030 (Border Wind, 1998). Although, in comparison with some other renewables, the current level of deployment of offshore wind is small, installed capacity is predicted to grow at around 800 megawatts (MW) per year (Gross, 2004).
At the end of 2002 the UK had an installed capacity of 552MW up from 486MW at the beginning of the year (AWEA, 2003), which shows that the technology is rapidly growing in this country. This is encouraging, as the government predicts that onshore and offshore wind may be the largest contributors to the renewable energy generation mix by 2010 (DTI, 2003).
Hydroelectric power generation is a significant source of world energy. According to an review of the current status of hydropower, the total installed capacity worldwide is approximately 740GW and the energy produced annually from that capacity is approximately 2770TWh, which is about 19% of the world’s supply of electricity (Bartle and Hallows, 2005). In the UK, the total installed capacity is around 1.5GW, of which 1298MW is in Scotland, 158MW in Wales, 18MW in England and 4MW in Northern Ireland (Bartle and Hallowes, 2005). The energy produced from that in an average year is approximately 5TWh: about 1.5% of the total UK supply (Bartle and Hallowes, 2005).
The gross theoretical annual potential for primary hydropower worldwide is estimated at more than 40,000TWh (Bartle and Hallowes, 2005). However the amount considered technically feasible is between 14,000 and 15,000TWh (Ramage, 2004), of which about 8,000TWh is probably economically feasible
(Bartle and Hallowes, 2005). About 120GW is under construction and a further 300GW is planned to go ahead within the next five years (Bartle and Hallowes, 2005).
Hydropower only contributes approximately 2% of total electricity consumption in the UK (ISHA, 2007) and, according to a paper by Bartle and Hallowes (2005); the nature of the UK’s topography means hydropower cannot be a major contributor to the national requirement for primary energy. However the study also noted that it is worth making use of the indigenous resource and went on to conclude that the number of sites that are economically feasible would increase as a result of the additional payments now being made for nonpolluting and renewable sources of energy (Bartle and Hallowes, 2005).
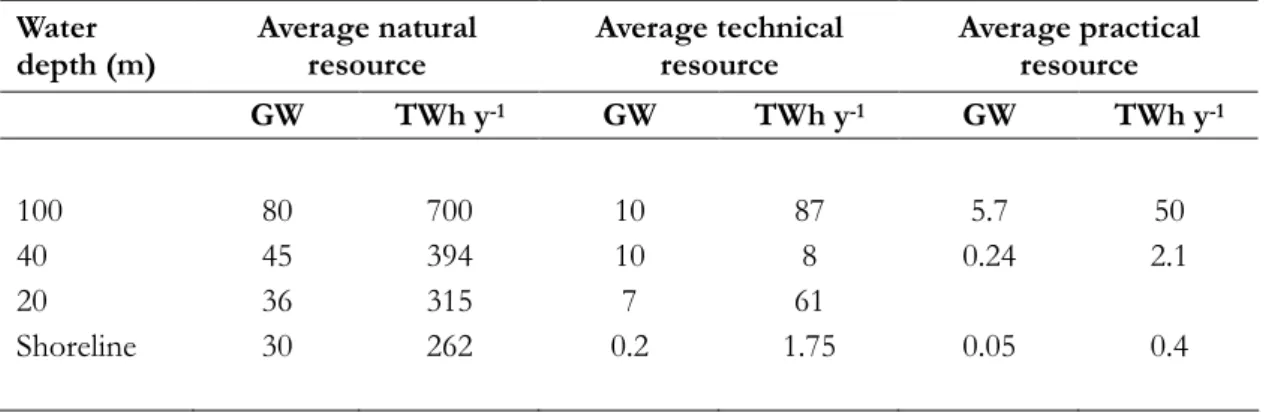
Worldwide potential for wave power is estimated to be in the region of 2TW or 17,500TWh y-1 (Thorpe, 1999). As regards the UK, the total annual average wave power resource ranges from 30GW at the shoreline to 80GW in deep water, with the technical resource estimated at between 7GW and 10GW per year (Thorpe, 1992).
Table 2.2 Estimated wave power resource at different depths (Thorpe, 1992, 2001) Water depth (m) Average natural resource Average technical resource Average practical resource GW TWh y-1 GW TWh y-1 GW TWh y-1 100 80 700 10 87 5.7 50 40 45 394 10 8 0.24 2.1 20 36 315 7 61 Shoreline 30 262 0.2 1.75 0.05 0.4
Table 2.2 shows the nature of the national wave energy resource at different depths.
Although the UK clearly has great potential for wave power and has always been at the forefront of wave energy technology design, the political climate has not always favoured the technology (Duckers, 2004). However, wave technology is here now as the deployment of the PELAMIS model off the coast of Portugal shows (Marsh, 2004) and may well be a viable option for the UK by 2010 – 2015 (DTI, 2003).
The large tidal range along the west coasts of England and Wales provides some of the most favourable conditions in the world for the utilisation of tidal power. If all reasonably exploitable estuaries were utilised, annual generation of electricity from tidal power plants would be some 50TWh, equivalent to about 15% of current UK electricity consumption (WEC, 2004).
Although the locations where tidal power could be developed economically are relatively few, the UK has its fair share of potential sites, ranging from 30MW to 8000MW (Baker, 1991).
Probably the best location for a tidal scheme in the UK is the Severn Estuary, which could theoretically provide an annual energy output of approximately 17TWh y-1 with an installed capacity of 8640MW (Clare, 1990).
As well as the Severn Estuary, the UK has a number of other potential sites for small tidal schemes, including the Lougher Estuary and Conway Estuary in Wales, the Wyre in Lancashire, and the Duddon in Cumbria (Baker, 1991). Overall, the total UK potential for small tidal schemes (that is, schemes of up to 300MW capacity) is estimated at 2% of electricity requirements (Elliott, 2004).
However, according to the World Energy Council (2004):
“A governmental programme on tidal energy (1978–1994) concluded that given the combination of high capital costs, lengthy construction periods and relatively low load factor (21–24%), none of [the above] schemes was regarded as financially attractive. [Therefore], a future UK tidal energy programme could include construction of a small-scale scheme primarily to demonstrate the technology and its environmental effects, before progressing to very large schemes on the scale of the Severn (WEC, 2004 p 400).”
In conclusion, wave and tidal stream energy are infant technologies at present. For estimates of costs and technical feasibility to improve a great deal more commercial scale experimentation and testing will be needed (Gross, 2004).
As well as the more conventional technologies listed above scientists are constantly developing new and more innovative carbon free energy sources, which the UK could benefit from in the future. A recent article in Scientific American identified a number of these technologies including well-known examples such as nuclear fusion and nanotech solar cells to more futuristic ideas such as high altitude wind, space-based solar and artificial photosynthesis (Gibbs, 2006). As exciting as these technologies are, and as influential as they may become in the future, most of them are still some way from being commercial realities and are not likely to be available within the next twenty years, the key time for new build in the UK (DTI, 2006a).
2.9 Micro-generation
Micro-generation is defined as the production of heat and/or electricity on a small-scale from a low carbon source (DTI, 2005b) and includes any technology connected to the distribution network (if electric) with a capacity of below 50-100kW (EST, 2005a). The government suggests that micro-generation has a key role to play in the future of Britain’s energy supply (DTI, 2006a) and has identified three main electricity micro-generating technologies: solar photovoltaics, wind turbines and small-scale hydro (DTI, 2005b). In addition, micro-generation technologies, especially those with appreciable resource, have the potential to reduce built environment related CO2 emissions coupled with reductions in consumers’ electricity costs. In many cases payback on capital investment is within the lifetime of the device (Bahaj et al.., 2007).
2.9.1 PV
It has been estimated that PV could contribute 6-8% of overall electricity supply by 2050 and also lead to a 3 million tonnes of carbon (Mt C) reduction in carbon emissions (DTI, 2005b) with a possible 4% contribution from the domestic sector, if cost issues can be overcome (EST, 2005a).
A typical household system of 2 kilowatts peak (kWp) would generate approximately 1500KWh y-1 and could provide an average of between 40-50% of total annual electricity needs (DTI, 2005b). However cost remains a big barrier to adoption, with a payback time on the above system (based on 2005 electricity prices) estimated at some 120 years (DTI, 2005b).
2.9.2 Micro-wind
The Energy Saving Trust (EST) has estimated that small wind could supply up to 4% of UK electricity requirement and reduce domestic carbon emissions by 6% by 2050 (EST, 2005a). However, although mean wind speeds at 50m above open ground have been measured at 6.5-7.5ms-1 over a large area of the country (Petersen and Troen, 1990), micro-wind turbines will not enjoy as favourable locations as large scale devices due to their siting often at low altitude and in dense urban terrain (Bahaj et al.., 2007). Having said that, micro-wind technology could have the potential to make a significant impact upon domestic electricity generation when located at the windiest sites in the UK (Bahaj et al.., 2007), and although cost still remains a problem with a payback time of about 29 years for a typical 6kW system (DTI, 2005b), micro-wind turbines may soon become a commercial reality in the UK as a result of both
advancements in technology and new financial incentives provided by the government (Bahaj et al.., 2007).
2.9.3 Small-scale hydro
According to Ramage (2004) there is no formal worldwide definition for small-scale hydro but in the UK it is set at 5MW. This infers that some small-scale installations will not qualify as micro-generation (below 100kW) and therefore small-scale estimates do not necessarily indicate the potential for micro-hydro. Worldwide potential for small-scale hydro is estimated at 200-300TWh y-1 (IEA, 2003), and in Europe small hydro provides over 8GW of capacity (Paish, 2002). There is an estimated 18GW of further small hydro potential and the European Commission have announced a target to increase small hydro capacity by 4200MW (50%) by the year 2010 (Paish, 2002).
In the UK a comprehensive study of small-scale hydroelectric potential in the UK at sites ranging from 25kW to 5MW estimated that there was an untapped potential of some 320MW – enough to provide 1300GWh y-1 of electricity (ETSU, 1989). However, more recent estimates have set the Figure at a ‘practically feasible’ 40MW – 110MW (ETSU, 1999). Most of the remaining potential is located in Scotland and Wales, although England has many 10’s of thousands of small low-head sites, previously watermills, which amount to over 50MW of further potential (Paish, 2002).
2.9.4 Other
Other micro-generation technologies include active solar water heating, ground source heat pumps (GSHP), bio-energy, small combined heat and power (CHP) and hydrogen energy and fuel cells (EST, 2005a).
Of these, Stirling engine CHP is likely to be the most key contributor to future energy supply with the potential to provide 40% of domestic heating requirements and 6% of UK electricity demand by 2050, with fuel cell CHP capable of adding a further possible 9% of electricity demand (EST, 2005a). The UK has also set a target of 10GW-installed capacity from CHP by 2010 (DTI, 2005b). Active solar heating (ASH) is also expected to be increasingly important with an estimated 50,000 new installations each year by 2010, 300,000 by 2015 and 800,000 by 2050 (AEAT, 2005).
In a similar vein it is estimated that the number of GSHP installations will continue to increase to 10,000 new units per year in 2010, 35,000 by 2015 and 55,000 by 2020 (DTI, 2005b).
As for bio-energy, the potential market size is estimated to be in the region of 19.6TWh y-1 from installations in a possible 1.1 million homes (DTI, 2005b).
This research supports the suggestion that 30-40% of the UK's electricity demands could be met through micro-generation technologies, by 2050, with CHP (both fuel-cell CHP and Stirling engine CHP) leading the way, followed by micro-wind and solar PV (Bahaj et al.., 2007).
2.10 Micro-grids and distributed energy
One way of using micro-generation to provide secure reliable energy is outlined in a paper by Abu-Sharkh et al.. (2006) who found that ‘micro-grids’ – de-centralised electricity generation combined with on-site production of heat – could provide substantial environmental benefits, namely from higher energy efficiency and from facilitating the integration of renewable sources such as photovoltaic arrays or wind turbines. The report also found no fundamental technological reason why micro-grids could not feasibly contribute an appreciable part of the UK energy demand, and concluded that these arrangements could meet the need to replace current generation by nuclear and coal fired power stations, greatly reducing the demand on the transmission and distribution network (Abu-Sharkh et al.., 2006).
The idea of distributed energy – energy generated near where it is used – is also recognised by the government as a key strategy that can potentially lower emissions, increase the diversity of energy supply and, in some cases, lower costs (DTI, 2006a). Indeed the government sees distributed energy alongside with energy efficiency as the most likely option to cap emissions from the household sector (DTI, 2006a).
2.11 Conclusion
A range of renewable energy options is available in the UK, and there is a large potential resource. In the coming 20 years it appears likely that wind and biomass technologies will play the most significant role (Gross, 2004).
It is clear that the UK government must move towards low carbon energy supplies, from indigenous sources, with energy being created as close to where it is required as is physically possible.
In the words of solar power promoter Jeremy Leggett (2002):
“The potential for renewables is vast and uncontroversial, yet underappreciated (Leggett, 2002 p 16)”.
This certainly appears to be the case, and as far as local energy sources go, renewables and in particular, micro-generation technologies could be the basis of future energy policy in this country. Boyle (2004) has provided a far more comprehensive review of renewable energy than is given here and his book is a must-read for all those interested or involved in the future of energy in this country. The sheer wealth of renewable resources available to the UK is second to none and given the right amount of investment and support, in conjunction with a shift towards energy efficient lifestyles, renewable energy could quite easily provide 100% of the UK’s energy requirements in years to come.
3 Regional energy strategies and targets
Instead of simply dictating how the national target of 10% of electricity from renewable sources will be achieved and setting blanket targets for each region of the country, the government instead aims to promote national objectives through local and regional decision-making (DTI, 2003). This approach – outlined at the time in its 2003 Energy White Paper – intended to build on existing energy and renewables strategies and move towards the implementation of a strategic approach to energy in each region (DTI, 2003).
3.1 Energy strategies
According to the DTI (2003), these strategies are intended to:
“Set out a strategic vision of the interaction between national energy policy and specific local and regional concerns;include regional targets (such as for renewables and energy efficiency) negotiated between the region and national Government; set out an action plan showing how regional bodies and local authorities intend to help to deliver objectives on energy through their various roles and functions; and act as a contribution by the region to the development of national policy (DTI, 2003 p 116).”
This approach is presumably designed to allow different counties and regions the flexibility to set achievable targets and to meet these targets by the most suitable and practicable methods. Although this appears to be the fairest and most effective way of ensuring participation from all areas of the country it comes with a certain degree of risk.
A report commissioned by the DTI and the Department of Transport and Local Government and the Regions (DTLR) found that the 10% Renewables Obligation target was more or less reached under the high targets proposed in the regional assessments, but not under the low targets and also found that the English regions’ proposed targets, when aggregated, fell well short of 10% of their electricity supply
(OXERA Environmental, 2002). The report also found that some 50% of the total of the regions’ assessments consisted of on- and offshore wind, with landfill gas and biomass making up the majority of the remaining half (OXERA Environmental, 2002), which suggests heavy reliance upon a few technologies to reach desired targets. However some regions, for example the South West and the East of England, showed more potential than others and anticipated an individual contribution greater than 10% (OXERA Environmental, 2002).
3.2 Dorset
The Bournemouth, Dorset and Poole Renewable Energy Strategy and Action Plan, prepared by the Centre For Sustainable Energy (CSE) for Dorset County Council and the Dorset Energy Group, was completed in December 2005 and sets out the county’s targets for renewable energy for 2010 (CSE, 2005). The following information on the proposed methods and targets is derived directly from this report.
The key behind allowing each region and/or county to set their own targets is that it allows local resources to be exploited and also allows sensitive and potentially controversial technologies to be limited or avoided completely. This is as important in Dorset as any other county due to parts of the county’s coastline being designated a UNESCO world heritage site and the majority of the area being recognised as an area of outstanding natural beauty (AONB) (CSE, 2005). Therefore even though the majority of technologies discussed earlier could probably be installed in Dorset, the final selection will reflect what is acceptable (ODPM, 2004a; ODPM, 2004b) rather than what is theoretically possible.
3.2.1 Existing capacity
There is an existing capacity of approximately 9MW of renewable electricity already operating in Dorset and several installations of renewable heat (although precise Figures are not known) (CSE, 2005). 3.2.2 Potential
Precise Figures for thermal energy potential are not estimated but the renewable sources of heat relevant to Dorset, according to CSE (2005), are as follows:
• “Using heat from renewable combined heat and power (CHP) installations – i.e. heat produced by biomass, Centralised Anaerobic Digestion, (CAD), and energy from waste advanced thermal treatment CHP plants
• Passive Solar Design (PSD) – careful building design to make optimum use of solar gains to reduce the need for additional space heating
• Active Solar Heating (ASH) – especially solar water heating
• Ground source heat pumps – making use of solar energy stored in the thermal mass of the ground
• Wood fuelled heat only systems – these would burn logs, pellets, or wood chip. The fuel could come from forestry residues, untreated recycled wood waste, or energy crops (CSE, 2005 21-22).
NB. As micro-hydro power is a source of electricity, not heat, the rest of this section focuses on the potential for renewable electricity in the county as opposed to renewable heat.
The potential installed capacity for renewable electricity in the county by 2010 is outlined below in table 3.1.
Table 3.1 Potential for renewable electricity in Dorset (Capener, 2004)
Technology Potential installed capacity (MW
electrical) by 2010
On-shore wind 40-60
Biomass Combined Heat and Power (CHP) – fired using
energy crops and forest residues 5
Energy from landfill gas 10
Energy from waste using advanced thermal treatment 6 (renewable fraction)
Centralised Anaerobic Digestion (CAD) 2
Solar photovoltaic (PV) 0.3
Micro-hydro 0.1
3.2.3 Targets
Table 3.2 Renewable electricity targets for Dorset (Capener, 2004) For Adopted Target
Draft Target Ranges (MW) Adopted Target Ranges (MW) Electricity Generated (GWh) Equivalent homes supplied Basis of Adoption Status of Relevant Policy/Strategy Development 64-84 64-84 295-347 73,750-86,750 Approved by Joint structure plan Committee County Renewable energy strategy completed
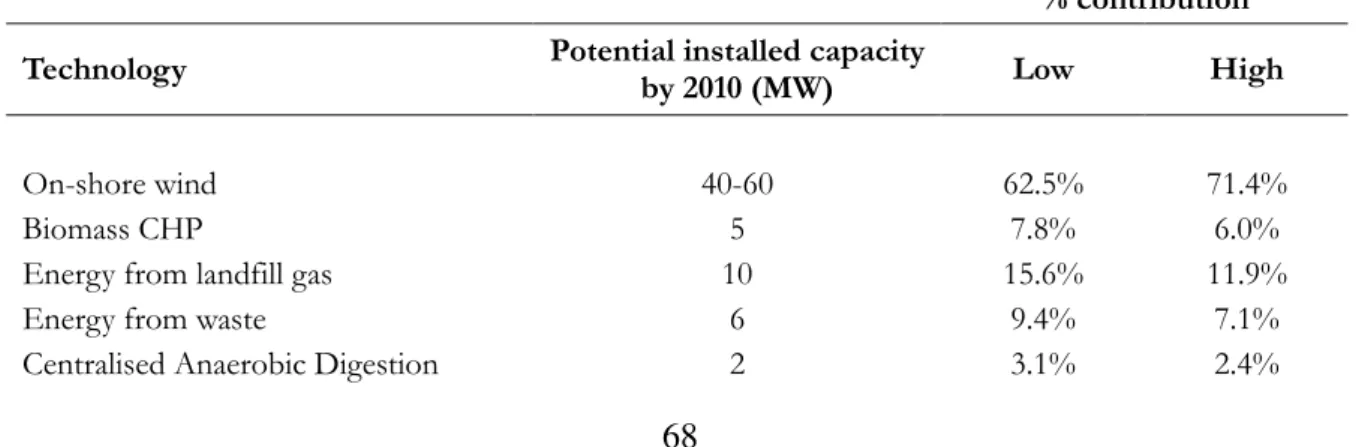
Although the Energy Strategy clearly states that the Figures in table 3.1 should not be seen in anyway as an assertion of how the target will actually be achieved (CSE, 2005), it can be used as an indication of the relative contribution of each technology to the country’s renewable electricity target.
Table 3.3 Percentage contributions from different technologies (Capener, 2004)
% contribution
Technology Potential installed capacity
by 2010 (MW) Low High
On-shore wind 40-60 62.5% 71.4%
Biomass CHP 5 7.8% 6.0%
Energy from landfill gas 10 15.6% 11.9%
Energy from waste 6 9.4% 7.1%
Solar PV 0.3 0.5% 0.4%
Micro-hydro 0.1 0.2% 0.1%
Total 63.4-83.4 99.1% 99.3%
Table 3.3 shows the percentage contribution to both the low (64MW) target and the high (84MW) target. The table demonstrates the heavy weighting towards on-shore wind and biomass; the frankly minuscule contribution from micro-hydro; and the lack of a ‘buffer zone’, with the technologies barely reaching the required 100% of the target.
3.3 Local opinion
This raises several questions about the reality of how Dorset is going to meet its targets when the main contributor – on-shore wind power – is such a controversial technology. Wind turbines have never been particularly popular in Dorset (Brown, 2007), with many residents of the not in my back yard (NIMBY) opinion. This has resulted in the emergence of pressure groups such as Dorset Against Rural Turbines (DART), which have been set up to try and influence planners into preventing the installation of the turbines in the county. Some of their arguments include claims that wind power is more expensive than other sources of energy, that the turbines are noisy and cause psychological damage, that they kill birds and bats, and significantly that there are better alternatives (DART, 2007).
Whether the arguments are valid or not is not necessarily of any consequence whatsoever, the real issue is that all these objections are hindering the installation and development of wind power in Dorset and are making the 40-60MW of installed capacity by 2010 for on-shore wind seem like a tall order.
3.4 Conclusion
Given the difficulties associated with promoting wind power in the county, the expansion of the other, less controversial, technologies should be a key part of the Energy Strategy as these technologies are much more likely to be given planning permission and to receive the support of the public.
Micro-hydro is one of these technologies, and installations are rarely objected to so long as consultation with all affected bodies takes place.
However according to the REvision estimate, micro-hydro cannot even contribute 1% of the county’s renewable electricity target, and therefore is only treated as a peripheral technology, always the last to be considered and invariably ending up being forgotten about at the bottom of the list.
4 Micro-hydro power systems 4.1 Basics
The main elements of a typical micro-hydro system, according to CAT (1999), are as follows:
• “a catchment area with a high enough rainfall
• a watercourse with a suitable drop in height (head)
• a water intake, usually with a weir or dam
• a pipe (penstock) or channel (leat)
• a turbine
• a generator
• electrical connections and controls
QuickTime™ and a TIFF (LZW) decompressor are needed to see this picture.
Figure 4.1 Layout of a typical micro-hydro system (ITDG, 2006)
In addition to this schemes will also often contain other elements such as a fish pass (HydroGeneration Ltd, 2003) and larger schemes may have other components as demonstrated above in Figure. 4.1.
This study however, consists entirely of low head schemes, which are generally more simplistic in design, as demonstrated below in Figure. 4.2.
QuickTime™ and a TIFF (LZW) decompressor are needed to see this picture.
Figure 4.2 Typical low head scheme layout (CSE, 2005) 4.2 Waterwheels
If a modern hydroelectric turbine is not suitable for a site then another possibility is the installation of a waterwheel. Many sites already have existing wheels, which, although often in need of restoration, can still be used to generate power. In some cases the wheel is not used to generate electricity but is used instead for mechanical power – as is the case at Town Mill in Lyme Regis (Watts, 2005a).
There are generally three main types of waterwheel: undershot, breast-shot, and overshot (Ramage, 2004) although others do exist (Lindsey, 1996). They are particularly useful where there is low head, but efficiencies are dramatically reduced with undershot wheels achieving approximately 30% efficiency, breast-shot 60% and overshot 70% at best (Gwillim, 2006).
4.3 Power capture
Two quantities are then required for generating power: a Flow Rate of water Q, and a Head H (BHA, 2005).
5 Methods and materials
QuickTime™ and a TIFF (Uncompressed) decompressor
are needed to see this picture.
QuickTime™ and a TIFF (Uncompressed) decompressor
are needed to see this picture.
QuickTime™ and a
TIFF (Uncompressed) decompressor
are needed to see this picture.
Figure 5.2 Location of sample sites
= Primary data = Secondary data
5.1 Primary data collection
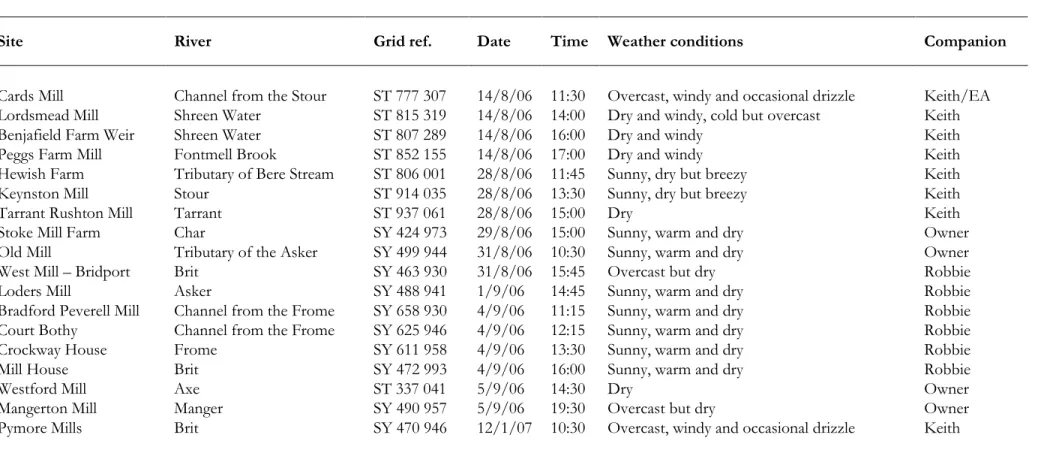
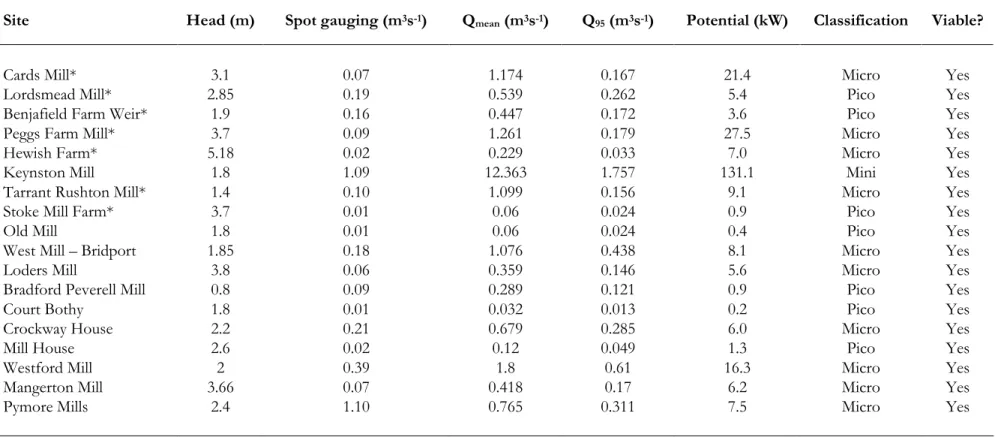
Firstly, sites were identified by being marked as ’mill’ or ‘weir’ on a 1:25,000 map (Figure. 5.2) and then visited accordingly to ascertain potential. At each site the name of the watercourse was recorded, the grid reference noted and the weather conditions observed (table 6.1). The head and flow were then measured (table 6.2). Heads were measured using a tape measure, usually in the wheel pit or down the overflow. Flows were measured by spot gaugings at a number of sites during the summer of 2006 and at one site in the winter of 2006.
5.1.1 Spot gauging procedure
1. Choose a suitable sampling location. This is generally as close to a uniform channel as possible, which is easily accessible, and representative of the flow available at the site.
2. Measure the width of the channel using a tape measure. Peg the tape measure across the channel and secure it in place. Record the width.
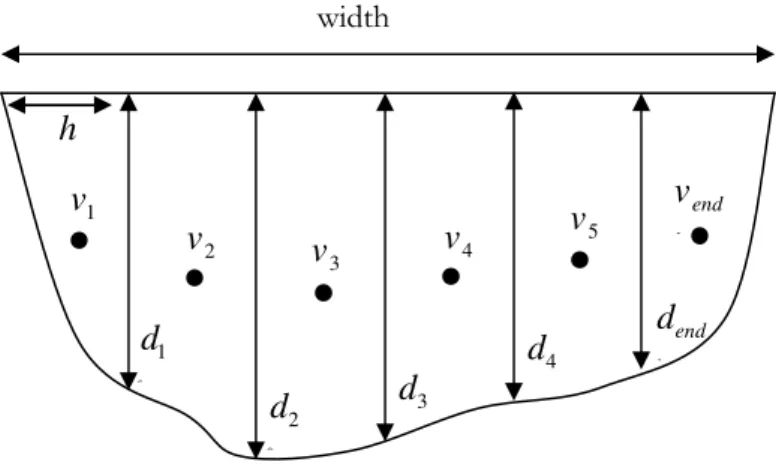
3. At appropriate intervals, measure the depth of the channel using a metre rule. The number of intervals (n) required depends upon the width of the channel, but generally intervals should not be greater than 1/20 of the width (BSI, 2000). Guidance from BSI (2000) is as follows:
“Channel width > 0m and < 0.5m n = 3 to 4 Channel width > 0.5m and < 1m n = 4 to 5 Channel width > 1m and < 3m n = 5 to 8 Channel width > 3m and < 5m n = 8 to 10 Channel width > 5m and < 10m n = 10 to 20 Channel width > 10m n = 4 to 5 (BSI, 2000 p 5)”
4. Calculate the cross sectional area of each ‘segment’ using the formula for the area of a trapezium as shown below:
A
=
0.5(
d
1+
d
2)
×
h
5. At the mid-point of each segment measure the depth and obtain the velocity (v) of the flow using the rotating element current meter submerged at 0.6 (60%) of the depth.
Figure 5.3 Method for determining flow rate (Adapted from Morris, 2006)
6. Multiply the velocity (v) by the cross-sectional area (A) to obtain the discharge (Q) through each segment or trapezium.
width
v
1v
2v
3v
4v
5v
end dd
1 1d
2 2d
3d
4 dd
endh
7. Add all the segments together to obtain the total flow rate or
Q
total (m3s-1)Qtotal =0.5×
[
(
d1×v1)
+(
(d1+d2)×v2)
+K+(
dend×vend)
]
×hNB. The above is a simplified version of the gauging procedure. For a full description please refer to BSI (2000).
5.1.2 Flow Duration Curves
Once the spot gauging is completed the next step is to create a Flow Duration Curve (FDC). FDCs are simply another way of organising discharge data and show, for a particular point on a river, the proportion of time during which the discharge equals or exceeds certain values (ESHA, 1998). The FDC can be obtained from a hydrograph by organising the flow data by magnitude instead of chronologically (ESHA, 1998).
The FDCs for the primary sites were obtained using a version of the ‘stream correlation’ method (Langley and Cutis, 2004). Essentially, the spot gauging was matched to data from a nearby gauging station at the same time and on the same date in order to determine what proportion of the major river at the gauging station a particular channel, tributary or section of the river the site constituted. Then, using gauging station data averaged over the maximum available number of years (CEH, 2006), an estimated FDC for the site was created.
Once an FDC is available for the site, the potential design flow can be estimated as Qmean – Q95 where Qmean is the mean flow and Q95 is the reserve flow, required by the EA to be left in the watercourse for ecological survival (Wheaton-Green, 2006a).
5.1.3 Estimating potential
Once the flow has been ascertained and the head measured, the available power can be estimated. Power is the energy converted per second, i.e. the rate of work being done, measured in watts (W). Hydroelectric turbines convert water pressure into mechanical shaft power, which for the purposes of this study can then be used to drive an electricity generator (BHA, 2005). The power available is proportional to the product of head and flow rate or discharge (BHA, 2005). The general formula for any hydro system’s power output is:
P = ηηηηρρρρ g Q H Where, according to BHA (2005):
• “P is the mechanical power produced at the turbine shaft (W)
• ηηηη is the hydraulic efficiency of the turbine
• ρρρρ is the density of water (1000kgm-3)
• g is the acceleration due to gravity (9.81ms-2)
• Q is the volume flow rate passing through the turbine (m3s-1)
• H is the effective pressure head of water across the turbine (m) (BHA, 2005 p 3).” 5.1.4 Efficiencies
Efficiencies obviously vary depending on the system and as with so many things related to small-scale hydro, different sources give different Figures. Some suggest 50% total efficiency for small-scale systems (ITDG, 2006; Langley and Curtis, 2004), whereas others estimate between 60% and 80% (Paish, 2002), or even 70-90% (BHA, 2005).
One version of estimating power output from a small hydro system, which includes several different efficiencies from Kirk (1999), is detailed below:
“P = power output of set (kW)
ηg = generator efficiency
ηgr = gear efficiency
ηt = turbine efficiency
g = acceleration due to gravity (ms-2) v = volume of water per unit mass (m3kg-1) Q = discharge (m3s-1)
Hn = net head (m)
The various efficiencies are quoted as:
ηg = 0.95, ηt = 0.85, ηgr = 0.99, g = 9.81, v = 0.001 and therefore the power output can be simplified to: P = 7.92QH (kW) (Kirk, 1999 p 209).”
This study assumes an optimistic efficiency of 70% based partly on the mid point of Paish (2002) and also the practical example of Cards Mill where overall efficiency was estimated at 69.4% based on an intake efficiency of 97%, a penstock efficiency of 95%, a turbine efficiency of 80%, a transmission efficiency of 98% and a generator efficiency of 96% (Taylor, 2006).
5.2 Secondary Data
The secondary data comes from feasibility studies compiled by Keith Wheaton-Green Associates (Wheaton-Green, 2006b), with the exception of Town Mill in Lyme Regis, whose feasibility study was carried out by HydroGeneration Ltd. Apart from Cards Mill, the flow data from these studies was estimated from hydrological data based on catchment area and runoff Figures for the watercourses in question, using the ‘HydrA’ computer software package (HydroGeneration Ltd, 2005; Wheaton-Green, 2006a). In the case of Cards Mill one years worth of rectangular notch measurements were correlated to a spot gauging and the FDC was obtained from those adjusted notch measurements (Taylor, 2006).
6 Results
6.1 Tables of results 6.1.1 Site visits
Table 6.1 Site visits summary
Site River Grid ref. Date Time Weather conditions Companion
Cards Mill Channel from the Stour ST 777 307 14/8/06 11:30 Overcast, windy and occasional drizzle Keith/EA
Lordsmead Mill Shreen Water ST 815 319 14/8/06 14:00 Dry and windy, cold but overcast Keith
Benjafield Farm Weir Shreen Water ST 807 289 14/8/06 16:00 Dry and windy Keith
Peggs Farm Mill Fontmell Brook ST 852 155 14/8/06 17:00 Dry and windy Keith
Hewish Farm Tributary of Bere Stream ST 806 001 28/8/06 11:45 Sunny, dry but breezy Keith
Keynston Mill Stour ST 914 035 28/8/06 13:30 Sunny, dry but breezy Keith
Tarrant Rushton Mill Tarrant ST 937 061 28/8/06 15:00 Dry Keith
Stoke Mill Farm Char SY 424 973 29/8/06 15:00 Sunny, warm and dry Owner
Old Mill Tributary of the Asker SY 499 944 31/8/06 10:30 Sunny, warm and dry Owner
West Mill – Bridport Brit SY 463 930 31/8/06 15:45 Overcast but dry Robbie
Loders Mill Asker SY 488 941 1/9/06 14:45 Sunny, warm and dry Robbie
Bradford Peverell Mill Channel from the Frome SY 658 930 4/9/06 11:15 Sunny, warm and dry Robbie
Court Bothy Channel from the Frome SY 625 946 4/9/06 12:15 Sunny, warm and dry Robbie
Crockway House Frome SY 611 958 4/9/06 13:30 Sunny, warm and dry Robbie
Mill House Brit SY 472 993 4/9/06 16:00 Sunny, warm and dry Robbie
Westford Mill Axe ST 337 041 5/9/06 14:30 Dry Owner
Mangerton Mill Manger SY 490 957 5/9/06 19:30 Overcast but dry Owner
Pymore Mills Brit SY 470 946 12/1/07 10:30 Overcast, windy and occasional drizzle Keith
Table 6.2 Site visits results summary
Site Head (m) Spot gauging (m3s-1) Qmean (m3s-1) Q95 (m3s-1) Potential (kW) Classification Viable?
Cards Mill* 3.1 0.07 1.174 0.167 21.4 Micro Yes
Lordsmead Mill* 2.85 0.19 0.539 0.262 5.4 Pico Yes
Benjafield Farm Weir* 1.9 0.16 0.447 0.172 3.6 Pico Yes
Peggs Farm Mill* 3.7 0.09 1.261 0.179 27.5 Micro Yes
Hewish Farm* 5.18 0.02 0.229 0.033 7.0 Micro Yes
Keynston Mill 1.8 1.09 12.363 1.757 131.1 Mini Yes
Tarrant Rushton Mill* 1.4 0.10 1.099 0.156 9.1 Micro Yes
Stoke Mill Farm* 3.7 0.01 0.06 0.024 0.9 Pico Yes
Old Mill 1.8 0.01 0.06 0.024 0.4 Pico Yes
West Mill – Bridport 1.85 0.18 1.076 0.438 8.1 Micro Yes
Loders Mill 3.8 0.06 0.359 0.146 5.6 Micro Yes
Bradford Peverell Mill 0.8 0.09 0.289 0.121 0.9 Pico Yes
Court Bothy 1.8 0.01 0.032 0.013 0.2 Pico Yes
Crockway House 2.2 0.21 0.679 0.285 6.0 Micro Yes
Mill House 2.6 0.02 0.12 0.049 1.3 Pico Yes
Westford Mill 2 0.39 1.8 0.61 16.3 Micro Yes
Mangerton Mill 3.66 0.07 0.418 0.17 6.2 Micro Yes
Pymore Mills 2.4 1.10 0.765 0.311 7.5 Micro Yes
6.1.2 Primary data included in this study
Table 6.3 Primary data summary
Site River Head (m) Spot gauging (m3s-1) Qmean (m3s-1) Q95 (m3s-1) Power (kW) Classification
Keynston Mill Stour 1.8 1.09 12.363 1.757 131.1 Mini
West Mill – Bridport Brit 1.85 0.18 1.076 0.438 8.1 Micro
Loders Mill Asker 3.8 0.06 0.359 0.146 5.6 Micro
Old Mill Tributary of the Asker 1.8 0.01 0.06 0.024 0.4 Pico
Bradford Peverell Mill Channel from the Frome 0.8 0.09 0.289 0.121 0.9 Pico
Court Bothy Channel from the Frome 1.8 0.01 0.032 0.013 0.2 Pico
Crockway House Frome 2.2 0.21 0.679 0.285 6.0 Micro
Mill House* Brit 2.6 0.02 0.12 0.049 1.3 Pico
Westford Mill Axe 2 0.39 1.8 0.61 16.3 Micro
Mangerton Mill Manger 3.66 0.07 0.418 0.17 6.2 Micro
Pymore Mills Brit 2.4 1.10 0.765 0.311 7.5 Micro
Total 183.6
*The potential power quoted as available at this site is something of an underestimate due to the fact that the gauging was taken in the tailrace as opposed to the main watercourse and is therefore representative only of the flow going through the mill at the time, not the total flow available. It should also be noted that head at this site was measured using a relatively unreliable trigonometric method and is therefore only a very rough estimate.
6.1.3 Secondary data
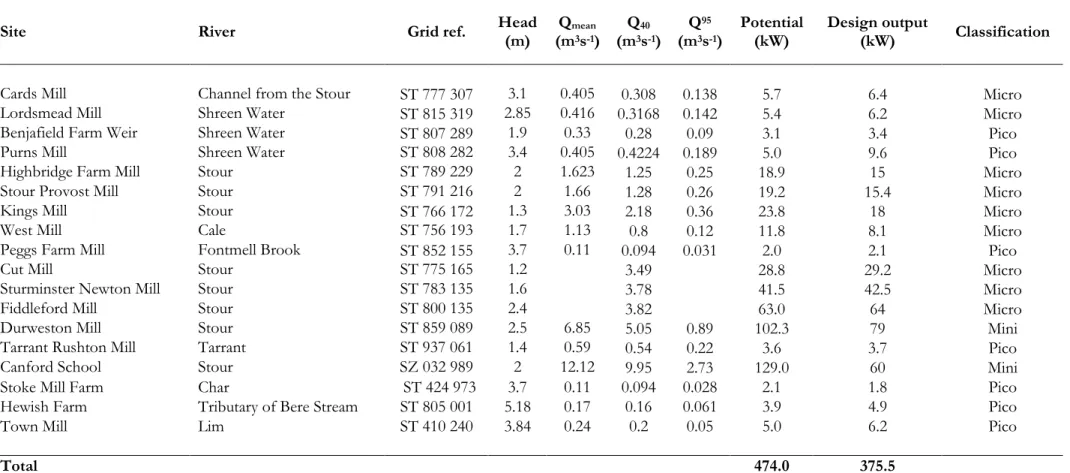
Table 6.4 Secondary data summary (Compiled from HydroGeneration Ltd, 2005 and Wheaton-Green, 2006b)
Site River Grid ref. Head
(m) Qmean (m3s-1) Q40 (m3s-1) Q95 (m3s-1) Potential (kW) Design output (kW) Classification
Cards Mill Channel from the Stour ST 777 307 3.1 0.405 0.308 0.138 5.7 6.4 Micro
Lordsmead Mill Shreen Water ST 815 319 2.85 0.416 0.3168 0.142 5.4 6.2 Micro
Benjafield Farm Weir Shreen Water ST 807 289 1.9 0.33 0.28 0.09 3.1 3.4 Pico
Purns Mill Shreen Water ST 808 282 3.4 0.405 0.4224 0.189 5.0 9.6 Pico
Highbridge Farm Mill Stour ST 789 229 2 1.623 1.25 0.25 18.9 15 Micro
Stour Provost Mill Stour ST 791 216 2 1.66 1.28 0.26 19.2 15.4 Micro
Kings Mill Stour ST 766 172 1.3 3.03 2.18 0.36 23.8 18 Micro
West Mill Cale ST 756 193 1.7 1.13 0.8 0.12 11.8 8.1 Micro
Peggs Farm Mill Fontmell Brook ST 852 155 3.7 0.11 0.094 0.031 2.0 2.1 Pico
Cut Mill Stour ST 775 165 1.2 3.49 28.8 29.2 Micro
Sturminster Newton Mill Stour ST 783 135 1.6 3.78 41.5 42.5 Micro
Fiddleford Mill Stour ST 800 135 2.4 3.82 63.0 64 Micro
Durweston Mill Stour ST 859 089 2.5 6.85 5.05 0.89 102.3 79 Mini
Tarrant Rushton Mill Tarrant ST 937 061 1.4 0.59 0.54 0.22 3.6 3.7 Pico
Canford School Stour SZ 032 989 2 12.12 9.95 2.73 129.0 60 Mini
Stoke Mill Farm Char ST 424 973 3.7 0.11 0.094 0.028 2.1 1.8 Pico
Hewish Farm Tributary of Bere Stream ST 805 001 5.18 0.17 0.16 0.061 3.9 4.9 Pico
Town Mill Lim ST 410 240 3.84 0.24 0.2 0.05 5.0 6.2 Pico
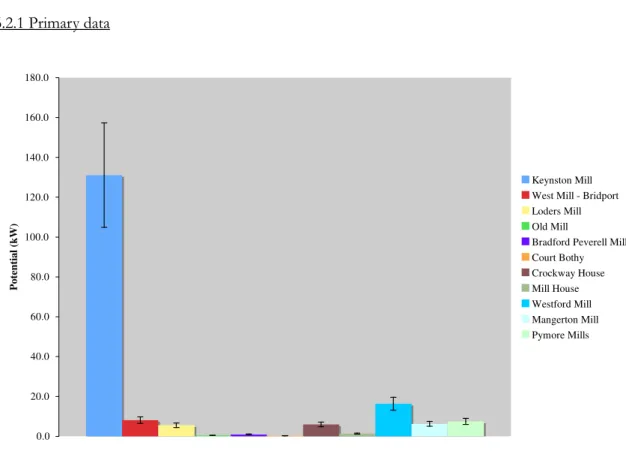
80 6.2 Results summary 6.2.1 Primary data 0.0 20.0 40.0 60.0 80.0 100.0 120.0 140.0 160.0 180.0 P o te n ti a l (k W ) Keynston Mill West Mill - Bridport Loders Mill Old Mill
Bradford Peverell Mill Court Bothy Crockway House Mill House Westford Mill Mangerton Mill Pymore Mills
Figure 6.1 Potential from the primary sites
Table 6.3 and Figure. 6.1 show the results from the primary data. Table 6.3 shows that the total potential from these sites is 183.6kW, with outputs varying from below 1kW at Court Bothy and Old Mill to over 100kW at Keynston Mill.
6.2.2 Secondary data
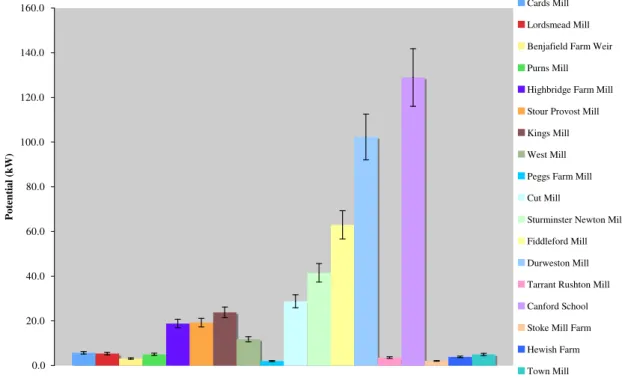
The total contribution from the secondary sites is much greater at 474kW but again there is a great deal of variation ranging from a lowly 2kW at Stoke Mill Farm to an impressive 129kW at Canford School (table 6.4). Figure. 6.2 illustrates the various potentials from the secondary sources compiled using data from HydroGeneration Ltd (2005) and Wheaton-Green (2006b).
0.0 20.0 40.0 60.0 80.0 100.0 120.0 140.0 160.0 P o te n ti a l (k W ) Cards Mill Lordsmead Mill Benjafield Farm Weir Purns Mill Highbridge Farm Mill Stour Provost Mill Kings Mill West Mill Peggs Farm Mill Cut Mill
Sturminster Newton Mill Fiddleford Mill Durweston Mill Tarrant Rushton Mill Canford School Stoke Mill Farm Hewish Farm Town Mill
Figure 6.2 Potential from the secondary sites 7 Analysis y = 59.115x + 1.6532 R2 = 0.4316 0.0 20.0 40.0 60.0 80.0 100.0 120.0 140.0 0 0.2 0.4 0.6 0.8 1 1.2 1.4 Spot gauging (m3 s-1 )
Figure 7.1 Potential against spot gaugings
The results also show that, unsurprisingly, there is a positive correlation between spot gaugings and potential, however the relationship is relatively weak (Figure. 7.1).
82 y = 10.568x + 0.9938 R2 = 0.9789 0.0 20.0 40.0 60.0 80.0 100.0 120.0 140.0 0 2 4 6 8 10 12 14 Qmean (m 3 s
-Figure 7.2 Potential against Qmean
A much better relationship exists between Qmean and potential, which exhibits a very strong positive correlation (Figure. 7.2). Considering head and flow are the only two variables in the equation for calculating potential, this suggests that the flow is the main determinant of power. This arises purely from the fact that the heads at the studied sites are all fairly low and only vary by a few metres whereas flows vary quite considerably between different sites.
The other thing worth mentioning is that the gauged rivers tend to result in the greatest potentials, followed by the un-gauged rivers and then the channels (Figure. 7.3 and Figure. 7.4). This is again expected, as the largest rivers tend to be those that are monitored closest and hence automatically gauged.
Furthermore, 22 of the 29 sites are either micro-and-gauged or Pico and either un-gauged or channel.
0.0 20.0 40.0 60.0 80.0 100.0 120.0 140.0 Gau ged Gau ged Gau ged Gau ged Gau ged Gau ged Gau ged Gau ged U n-gaug ed U n-gaug ed U n-gaug ed U n-gaug ed U n-gaug ed Cha nnel Cha nnel Cha nnel P o te n ti a l (k W )
Figure 7.3 Potentials from different types of watercourse
0.0 5.0 10.0 15.0 20.0 25.0 30.0 35.0 40.0 45.0 M ea n p o te n ti a l (k W ) Gauged Un-gauged Channel
84 7.1 Hypothesis testing
The total potential in the county is equal to 657.6kW. This Figure is some 500% greater than the 108kW estimated by the Salford study (ETSU, 1989), and therefore H0 is rejected and H1 is accepted, confirming that the potential for micro-hydro power in Dorset is significantly greater than previously estimated. The significance of this result is demonstrated below in Figure. 7.5, which shows the results from both studies and the level confidence in these results.
0 0.1 0.2 0.3 0.4 0.5 0.6 0.7 0.8 0.9 P o te n ti a l (M W ) Salford This study
Figure 7.5 Potential estimated by the University of Salford and this study
8 Interpretation
The major reason for the significant difference between the two studies is the increase in the number of sites included in this study in comparison to that carried out by Salford. This arises from two main factors. The first is that the number of viable sites in Dorset has increased dramatically since the 1989 study due to vast improvements in technology allowing for the exploitation of sites with low heads and low potential.
Whereas any site with a head of less than 2m or a potential of less than 25kW was discounted in the Salford study (ETSU, 1989), heads as low as 1m and potentials as low as 200W are now viable (Fuentes, 2004).