The Heavily Indebted Poor Countries and
the Multilateral Debt Relief Initiative
A Test Case for the Validity of the Debt Overhang Hypothesis
Martin Knoll
School of Business & Economics
Discussion Paper
Economics
2013/11
1
The Heavily Indebted Poor Countries and the Multilateral Debt Relief Initiative:
A Test Case for the Validity of the Debt Overhang Hypothesis
*Martin Knoll
†Abstract
The Heavily Indebted Poor Countries Initiative (HIPCI) and the Multilateral Debt Relief Initiative (MDRI) were both implemented based on an assumption derived from the debt overhang hypothesis – that is, that the removal of excessive debt burdens would help to boost investment and economic growth. Using a quasi-experimental research design to compare the performance of investment and growth between LICs that have benefited from HIPCI and MDRI and those that have not, this study assesses whether the two programs have yielded the expected effects. The results indicate that while debt relief programmes have led to higher private-sector investment in beneficiary countries, they have not had any effect on public sector investment and growth. While the reasons for this outcome are not entirely clear, assumptions concerning the benefits that accrue to LICs as a result of debt relief appear to be in doubt.
* Acknowledgement:
I am particularly grateful to Irwin Collier, Petra Zloczysti, and Christian Kusch. The views expressed and any remaining errors are entirely my own.
†
Freie Universität Berlin, John F. Kennedy Institute, Lansstrasse 7–9, 14195 Berlin, Germany. E-mail: [email protected]
2 1. Introduction
The Heavily Indebted Poor Countries Initiative (HIPCI) and the Multilateral Debt Relief Initiative (MDRI) are arguably the most comprehensive debt relief operations undertaken in bi- and multilateral development cooperation thus far. Since the initiation of HIPCI in 1996, its enhancement in 1999 and the launch of MDRI in 2006, a total of 32 Low Income Countries (LICs) have benefited from irrevocable debt cancellation, reducing their average debt burden from 160 percent of GDP in 1992 to around 30 percent in 2010.3 Thus, the two consecutive initiatives have enabled LICs burdened with unsustainable levels of external public and publically guaranteed debt (PPGD) to return to viable fiscal conditions and less critical balance-of-payments positions.
The approach taken under the HIPCI and MDRI is unprecedented in several respects: First, it represents a strategy for a permanent exit from the serial rescheduling of official bilateral debt under the auspices of the Paris Club (Gautam, 2003), going well beyond temporary relief in debt service payments.4 Second, it follows the principle of burden sharing, and for the first time covers debt owed to bilateral, multilateral and commercial creditors.5 Third, although debtor countries have to negotiate their specific terms individually, it sets commonly applied, sustainability-oriented eligibility criteria and a predefined programme for macro-economic stabilization, fiscal consolidation, and poverty reduction that is mandatory for irrevocable debt cancellation.
While these ostensibly laudable programmes have been embraced enthusiastically by the largest part of the community of development practitioners, NGOs, and academia, they hinge crucially on the validity of the debt overhang hypothesis. This hypothesis states that highly indebted poor countries suffer from low levels of investment and economic growth partly because they are confronted with an inherited debt stock that disincentivises investment and productivity enhancing adjustment efforts, as future returns would accrue primarily to creditors.6 Conversely, the removal of a debt overhang would be an appropriate means for boosting investment and economic growth.
While commonly accepted, these assumptions have been challenged by various academics who instead suggest that unsustainable debt is primarily an outcome rather than a cause. According to Easterly (2002) and Arslanalp and Henry (2004, 2006), inherently unfavourable socioeconomic characteristics prevailing in LICs’ debtor societies, including patrimonial governance structures, interest group polarization and political instability, result in a strong preference for high near-future public expenditure financed through debt expansion. From the perspective of these authors, debt relief is
3
As by December 2011, for a list of countries see Appendix II.
4
According to Gautman (2003), objective formulation became more ambiguous over time. Whereas in 1995 the World Bank only considered debt reduction as part of a broader strategy, in 1999, when the original HIPCI was enhanced, it was declared to aim at providing a clear and permanent exit from unsustainable debt burdens.
5
It showed that the objective of including commercial claimants has not fully been met as HIPCI does not have a legally binding character. Various commercial creditors have refused to participate or engaged in litigation. At least 20 HIPCs have been threatened or subject to litigation by commercial creditors (Gueye et al., 2007).
6
The term “debt overhang” achieved prominence in a paper by Krugman (1988). His theoretical work aimed to show that under certain conditions, an inherited high debt stock creates significant disincentives for the debtor to make efforts to redeem obligations in full. Accordingly, creditors can minimize their losses by pursuing a combination of defensive lending and conditional debt relief.
3
ineffective in stimulating investment and growth, as beneficiary LICs can be expected to return to the previous unsustainable fiscal and macro-economic policy stance after receiving debt treatment.
The HIPCI and MDRI can be used to shed more light on this fundamental dispute in development economics. Since 1996, 32 countries of a total of 80 LICs have under HIPCI and MDRI undergone and completed unprecedented debt relief and debt restructuring programs.7 This provides an ideal treatment and control group setting, in which the validity of the debt overhang hypothesis can be tested indirectly. Using difference-in-differences analysis, which is suitable for non-randomised treatment selection, this paper assesses the extent to which debt relief under the HIPCI and MDRI has indeed been associated with a measurable increase in productivity, investment and growth.
The empirical results are somewhat sobering: While the HIPCI and MDRI appear to have been partially successful in stimulating total and particularly private investment, a measurable positive effect on public investment cannot be seen. Since public investment is at least as important for enhancing economic growth as private investment, an important channel for stimulating per capita income appears dysfunctional. Furthermore, the HIPCI and MDRI have not led to a measurable increase in productivity in beneficiary countries. As the results presented here confirm the findings of past studies that identify productivity growth as a principal source of per capita income growth (e.g. Easterly and Levine, 2001; Pattillo et al., 2003), the systematic weaker growth performance of HIPCs in comparison to non-HIPCs is not very surprising. All in all, these findings call into question the assumptions of the debt overhang hypothesis, which sees a causal chain between debt, investment and growth.
The paper proceeds as follows: Section 2 reviews the theoretical and current empirical literature on debt relief in developing countries, placing a particular emphasis on the debt overhang debate. After providing an overview of the context and procedures for implementing the HIPC and MDRI in Section 3, Sections 4 presents the modelling strategy and results, and also provides an interpretation of the findings. Section 5 concludes.
2. The Theoretical Underpinning for Debt Relief – A Brief Literature Review
The Latin American debt crisis, which brought the global financial system close to the brink of collapse, sparked a series of theoretical and empirical studies on international sovereign borrowing in which the debt overhang hypothesis emerged as a conceptual centrepiece (Krugman, 1988; Sachs, 1989) subsequently used as an argumentative underpinning for debt relief initiatives such as the HIPCI and MDRI.8
In his seminal contribution, Krugman (1988) uses a two-period utility model under uncertainty to suggest that once a country has accumulated an external debt larger than the expected present value
7
As by December 2011, see Appendix II.
8
4
(PV) of potential future transfers to its creditors, the debtor country is disincentivized to implement productivity enhancing fiscal and macro-economic adjustment that would augment national income and, in turn, the government's debt servicing capabilities. Disincentives are said to result from economic returns accruing entirely or large part to a country’s creditors, leaving the debtor with an insufficiently small reform dividend.
Sachs (1989) makes a similar point. He develops an intertemporal utility model distinct from Krugman’s in that a country’s adjustment efforts are captured solely through the debtor country’s aggregate investment choice. Sachs shows that an excessive external debt stock and the resulting service burden distort the investment choice, thereby inducing an inefficiently low level of future output. This occurs as in the presence of a debt overhang, debt service ceases to be a function of formally outstanding obligations. Instead, future transfers to a country’s creditors are constrained by its ability to pay, i.e. by the size of its future gross national product. Consequently, any effort to augment future output via current capital accumulation, i.e. investment, is subject to debt-induced distortionary taxation. To overcome this dilemma, Sachs proposes the reduction of external debt to manageable levels such that the character of debt service is transformed from a marginal tax to a lump-sum burden. Consequently, the adverse distortive effects of debt on investment would be removed with debt service ceasing to impair aggregate investment.
While the theoretical argument for debt relief was motivated by a sovereign debt crisis, in Sachs’ analytical framework the investment decision is modelled as a national aggregate and is therefore applied to total, i.e. private and public, investment. This implies the existence of a mechanism whereby the public socio-economic cost of an external debt overhang is internalized in private-sector investment decisions (Borensztein, 1990; Diwan and Rodrik, 1992). Thus, it is assumed that if the public sector accumulates external debt levels perceived as unsustainable by domestic and foreign private investors, the latter lower their return expectations as they anticipate the burdens of future public debt service, whether this burden is explicit – in the form of higher taxation – or implicit – through the costs of macroeconomic instability (Patillo et al., 2003).
Interestingly, empirical work aiming to verify the debt overhang hypothesis has, probably for practical reasons, in most cases elided Krugman’s more complex notion of productivity enhancing structural adjustment effort. Instead, it syncopated the analysis to factor accumulation via the debt-investment-nexus. Warner (1992), estimating investment functions and examining out-of-sample forecasts for 13 developing countries considered to have accumulated an external debt overhang prior to 1982, finds no evidence for a debt-induced contraction of investment. He instead suggests that the observed decline in investment in the wake of the debt crisis in 1982 can be attributed to the same adverse economic shocks that caused the global recession. Chauvin and Kraay (2005) indirectly test the debt-investment and debt-growth link by estimating the growth and the debt-investment enhancing effects of sovereign debt relief using a sample of 62 LICs from 1989 to 2003. They do not find evidence that
5
debt relief positively affects aggregate investment and economic growth. This partly confirms earlier findings by Cohen (1997), who argues that the level of external debt does little to explain economic growth.
The effort to define a debt overhang threshold for developing countries beyond which the marginal impact of debt on investment and growth turns negative has also yielded inconclusive results. Elbadawi et al. (1997) infer an overhang threshold at approx. 100 percent of GDP. Pattillo et al. (2002) identify a much lower threshold (a present-value debt stock amounting to approx. 20 percent of GDP). Imbs and Ranciere (2005) suggest that a threshold exists at a present-value debt stock of around 40 percent of GDP.
A recent strand in the literature has moved from the mono-causal capital accumulation paradigm towards a duo-causal approach that incorporates Krugman’s notion of productivity enhancing policy. Pattillo et al. (2003) find evidence that the negative effect of debt on growth primarily operates through total factor productivity (TFP), while the negative effect of debt on physical capital accumulation is only of subordinate importance. The contribution by Pattillo et al. (2003) draws heavily on empirical findings by Easterly and Levine (2001), who argue that TFP rather than factor accumulation is the main source of economic growth.
The debt overhang hypothesis is, however, clearly grounded on the assumption that developing countries will be willing and able to implement productivity enhancing reforms and investment if the debt overhang is removed. Easterly (2002) challenges this assumption, suggesting that debt relief fails to provide a viable exit strategy from excessive borrowing, as it neglects the underlying cause for debt accumulation. Analyzing a sample of 41 highly indebted LICs for the period from 1979 to 1997, he finds evidence that over-indebtedness appears to be caused by inherently high discount rates against the future. According to Easterly (2002), such high discount rates are the consequence of patrimonial governance structures, interest group polarization and political instability. Due to a highly uncertain future, the elites exercising allocational control over the country’s resources display a strong preference for debt-financed current and near-term consumption, thereby imposing high discounts on the far distant returns from long-term economic activities. Easterly finds that LICs that have undergone non-concessional or concessional debt rescheduling, have – presumably due to those underlying elites’ intertemporal preferences – re-accumulated similarly large debt stocks, or, if new external borrowing had been restricted, drawn down public assets. However, a principal caveat concerning Easterly’s findings is that they have been derived from data mainly covering a period in which the external public debt of highly indebted LICs was rescheduled at concessional terms and not forgiven (1979-1994), thereby in many cases further increasing the PV of outstanding debt (cf. Section 3).
In an effort to reconcile Easterly’s claim with previous findings regarding the effect of debt on investment and growth, Presbitero (2008) and Cordella et al. (2010) assess the effects of external
6
indebtedness and quality of governance on aggregate investment and economic growth. Cordella et al. (2010), in a study covering 79 developing countries for the time period from 1970 to 2002, find the debt-investment and debt-growth nexus to be statistically irrelevant for highly indebted countries with bad institutions and policies. At the same time, they detect a negative marginal effect of public external indebtedness on growth and investment beyond a debt PV-to-GDP threshold of 25 percent for countries with good governance. This is consistent with previous findings by Prespitero (2008), according to which the link between indebtedness and economic growth depends on institutional quality, such that debt relief is likely to be more effective in developing countries with sound governance standards. Arslanalp and Henry (2004 and 2006), by contrast, claim the debt overhang hypothesis to be inapplicable to most sub-Saharan Heavily Indebted Poor Countries (HIPCs). Due to these countries’ poor macro-economic performance, generally weak institutional frameworks, and resulting low productivity, long-term profitable economic activity is significantly hampered.
Thus, it remains unclear whether the large-scale cancellation of debt for countries judged as suffering from a debt overhang is indeed effective in inducing a higher rate of economic growth through enhanced investment activity and/or an increase in total factor productivity. In an effort to clarify this issue, the present paper assesses the extent to which LICs whose debt stock has been reduced to sustainable levels under HIPCI and MDRI have been able to attain higher investment and growth rates in comparison to LICs that have not benefited from debt cancellation.
3. Overview of Recent Debt Rescheduling Operations
Although innovative in several regards, HIPCI and MDRI only represent a preliminary end-point in a series of increasingly concessional debt restructuring initiatives conducted under the auspices of the Club of Paris and the IMF.9
a. The Paris Club
During the 1970s and most of the 1980s, the period in which many LICs accumulated unsustainable external public debt positions, the modus operandi consisted in non-concessional flow rescheduling of long-term official bilateral debt under the auspices of the Paris Club (Boote and Thugge, 1997). Typically, only the interest and principal for debt due during a rather short consolidation period were subject to deferral or restructuring (Daseking and Powell, 1999). To protect the preferred creditor status of the IMF and World Bank, multilateral debt remained excluded from treatment (Kuhn et al., 1994). LICs undergoing Paris Club rescheduling were requested to implement structural adjustment
9
The Paris Club is an informal group consisting of 19 permanent OECD member countries with large exposures to other states. Those are Australia, Austria, Belgium, Canada, Denmark, Finland, France, Germany, Ireland, Italy, Japan, the Netherlands, Norway, the Russian Federation, Spain, Sweden, Switzerland, the United Kingdom, and the USA. The IMF plays an important advisory role. The UNCTAD, the World Bank and the RDBs have observer’s status. The Secretariat of the club is hosted by the French Treasury. For a more detailed delineation of the Paris Club’s history and method of operation the reader is referred to Cosio-Pascal (2008).
7
programs with the IMF (Cosio-Pascal, 2008; Boote et al., 1998).10 Accordingly, restructuring was primarily aimed at providing a time window for the implementation of macro-economic adjustments that would permit a re-assumption of normal relations with the debtor country’s creditors (Callaghy, 2004; Mistry, 1994). Hence, at that time, the notion of rescheduling was inherently one of adjusting the way out of debt distress.
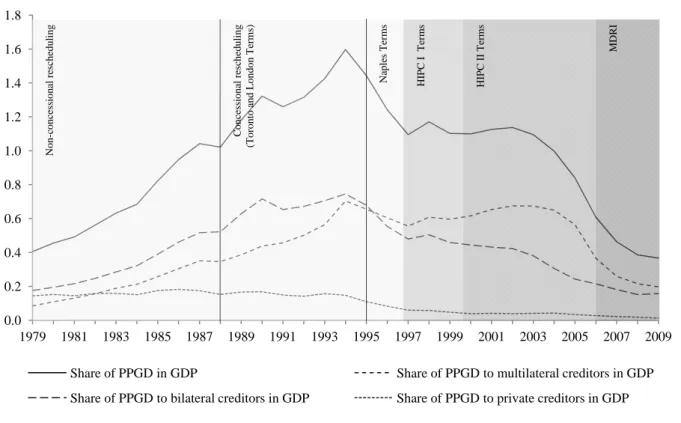
However, as external public debt levels continued to rise dramatically in many LICs during the 1980s (Figure 1), the conventional approach of limited non-concessional case-by-case service rescheduling for bilateral debt appeared increasingly inappropriate (Mistry, 1992). In response, Paris Club debt treatment operations between 1988 and 1995 became increasingly concessional but remained limited to flow rescheduling, i.e. the restructuring of eligible debt service. At the G7 summit held in 1988 in Toronto, it was agreed that LICs would be granted a reduction of 22 to 33 percent of the PV of debt service falling due in the consolidation periods under future Paris Club rescheduling operations (Toronto Terms). The degree of concessionality was further increased to up to 50 percent at the G7 summit of 1991 in London (London Terms).11
Nevertheless, the scope of these concessional rescheduling operations remained highly limited for various reasons. First, the increasing volume of outstanding multilateral debt continued to be excluded from rescheduling and cancellation (Mistry, 1994; Dijkstra, 2008; Boote et al., 1994). Second, the volume of long-term bilateral debt treated under Paris Club agreements remained very modest in relation to overall outstanding external debt, as PV reductions were only applied to the service of debt issued before a certain cutoff date and falling due in the consolidation period. Third, as part of their defensive lending strategies, official bi- and multilateral creditors continued to provide new financing, further aggravating the existing debt problem. Due to these limiting factors the debt consolidated under Toronto Terms and London Terms amounted to only USD 6 billion and USD 9 billion, respectively, while the overall nominal external stock of long-term PPGD owed by beneficiary countries stood at USD 106 billion by the end of 1996.12
In a first attempt to provide a permanent exit to perpetual rescheduling, the G7 at its Naples summit in 1994 further enhanced the degree of concessionality under Paris Club arrangements.13 Under the Naples Terms, highly indebted LICs would receive a PV reduction of 67 percent on eligible debt. Furthermore, the consolidation period was significantly extended, and now covered between two and three years (generally coinciding with the implementation of an IMF structural adjustment program).14
10
The IMF’s macro-economic adjustment programmes were from the mid-1980s provided under concessional lending facilities – from 1986 to 1987 through the Structural Adjustment Facilities (SAF); from 1987 to 1999 through the Enhanced Structural Adjustment Facilities (ESAF); and from 1999, through the Poverty Reduction and Growth Facility (PRGF).
11
Toronto and London Terms included a menu of options for providing debt and debt-service reduction to LICs.
12
In this context consolidation does not imply full cancellation but only restructuring at concessional terms.
13
The G7 proposal was endorsed by Paris Club members in December 1994. Naples Terms were applied between January 1995 and November 1996.
14
Eligibility criteria for the 67 percent PV reduction under Naples Terms were i) an income of 500 USD per capita and below and ii) a debt stock (PV) to exports ratio of 350 percent or more. LICs failing to meet these criteria only received a 50 percent PV reduction (Boote et al., 1995).
8
More importantly, for the first time, concessional Paris Club modalities went beyond flow treatment: Upon satisfactory completion of IMF programs, an exit rescheduling option allowed for a stock of debt treatment, namely a 67 percent PV reduction in external long-term public debt owed to Paris Club members (Boote et al., 1998).15
Figure 1: PPGD by creditor as a share of HIPC GDP
Data source: World Bank, World Development Indicators, 2012.
b. Heavily Indebted Poor Countries and Multilateral Debt Relief Initiatives
While this enhancement of concessionality contributed to slowing down and eventual halting the continuous growth of highly indebted LICs’ PPGD (see Figure 1), it became evident that without the inclusion of multilateral debt in future debt relief operations, a substantive and sustainable reduction in highly indebted poor LICs’ external PPGD stocks would not be achievable. Under continuously growing pressure, in 1995 the World Bank and the IMF switched from fundamental opposition to relief deals to the role of fair brokers for a comprehensive and once-and-for-all debt reduction program that would encompass multilateral, bilateral and private debt (Callaghy, 2004).16
In autumn of 1996, the executive boards of the IMF and the World Bank endorsed the staff proposals for a comprehensive reform program: the HIPC Initiative. Its core objective was to reduce HIPCs
15
London Terms already contained a goodwill clause allowing for debt stock treatment upon satisfactory completion of IMF-supported programs that, however, had not been applied (Boote and Thugge, 1997; Boote et al., 1998). Naples Terms debt-stock treatment was provided to Benin, Bolivia, Burkina Faso, Guyana, Mali and Uganda (Boote et al., 1998).
16
It is interesting to note that while the IMF and the World Bank in most of their official documents claim at least the role of accoucheur of HIPC, the two institutions until 1995 repeatedly disavowed the fact that LICs undergoing serial Paris Club rescheduling were facing embarrassingly severe solvency crises. Instead they repeatedly claimed that those countries where primarily facing short-lived liquidity constraints. An excellent account of the evolving political-economy processes leading to the HIPC Initiative is provided by Callaghy (2004).
0.0 0.2 0.4 0.6 0.8 1.0 1.2 1.4 1.6 1.8 1979 1981 1983 1985 1987 1989 1991 1993 1995 1997 1999 2001 2003 2005 2007 2009
Share of PPGD in GDP Share of PPGD to multilateral creditors in GDP Share of PPGD to bilateral creditors in GDP Share of PPGD to private creditors in GDP
Con ces si on al res ch edu lin g (To ront o and Lon don Terms ) Na ple s T erm s HIPC I Term s HIPC II Ter m s MDRI No n-c o nce ss ion al re sc he du li n g
9
overall external debt stock – including multilateral debt – to sustainable levels (World Bank and IMF, 1996). As the initial HIPCI got off to a slow start and appeared to be insufficient in scale to attain its goals, the terms and eligibility thresholds were reviewed and substantively lowered in September 1999.17 Under a revised HIPCI framework, known as Enhanced HIPCI (E-HIPCI), the original core objective was extended to additionally target economic development and poverty reduction (World Bank and IMF, 1999, Gautam, 2003). To ensure that the fiscal space gained from debt service and debt stock cancellation would be used for additional poverty reduction spending, beneficiary governments were required under E-HIPCI to develop and implement comprehensive Poverty Reduction Strategies, which had to be approved by the Bank and the Fund (World Bank and IMF, 1999).18
Eligibility under HIPCI and E-HIPCI was subject to two pre-conditions: Potential beneficiaries had to be eligible for funding under the World Bank’s concessional lending arm, the International Development Association (IDA); and they were required to successfully complete Naples Terms restructuring. The ultimate decision on a country’s participation under HIPCI and E-HIPCI was taken based on a tripartite debt sustainability analysis, jointly conducted by the staff of the IMF, the World Bank and country authorities. If the results suggested that the external debt stock after Naples Terms treatment would continue to range above predefined sustainability thresholds, the respective country became eligible for HIPCI and later E-HIPCI treatment.19 The purpose of the debt sustainability analysis in this context was twofold: First, it served as a tool for determining external PV debt stock in order to assess HIPCI/E-HIPCI eligibility. Second, it was used to project the development of the country’s external debt position under several plausible medium-term macroeconomic scenarios in order to determine the volume of relief required to bring the debt below sustainability thresholds.20 The burden of relief operations is shared among multilateral, official bilateral and commercial
17
According to Gautam (2003), from 1996 to 1999, only seven countries reached the decision point and became eligible for debt relief. While the dissatisfactory slow start of the HIPCI might have played a role, the pressure of debtor governments, the G7, civil societies and NGOs upon the World Bank and IMF to lower the thresholds seems to have been pivotal for the enhancement of the initiative (Callaghy, 2004).
18
Poverty Reduction Strategies (PRSs) should contain an assessment of poverty and its key determinates, set targets for poverty reduction, prioritize government activity to achieve development objectives, establish a monitoring framework that maps poverty trends and can be used to evaluate the impact of government interventions, and describe the participatory process in preparation of the strategy (World Bank, 2002). As the participatory development of comprehensive PRSs threatened to delay implementation, an interim-PRSs was also deemed sufficient to qualify for irrevocable debt cancellation under E-HIPCI. Interim PRSs were considered a binding commitment, containing a statement of intent and a roadmap for developing and implementing a full PRSs (Gautam, 2003).
19
The principal sustainability threshold was the ratio of the PV of the debt stock in PV terms to gross exports of 150 percent (200-250 percent under HIPCI). For very open economies with gross exports amounting to above 30 percent of GDP (40 percent under HIPCI), an alternative fiscal criterion, the PV debt stock to central government revenue ratio (250 percent under E-HIPCI and 280 percent under HIPCI) was applied (Gueye et al. 2007; Gautam, 2003). As a necessary condition for the application of the alternative criterion, the ratio of budget revenue/GDP had to be above 15 percent (20 percent under HIPCI) (Gueye et al. 2007).
20
Although not used as an explicit threshold, the E-HIPIC aimed at reducing the PV-debt to GDP ratio to a level comparable to that of non-HIPC LICs and LMIs, which were on average ranging around 40 percent of GDP. As the projections of future debt levels critically depend upon assumptions regarding key macroeconomic variables such as GDP growth, exchange rate trends, revenue mobilization, etc., conducting debt sustainability analysis was a highly political undertaking. As documented by Gautam (2003), these projections, particularly the growth rate and export share projections, were often overly optimistic such that at the completion point, sustainability thresholds could not be met.
10
creditors in proportion to their share in the PV of outstanding debt at the time of the country’s qualification for HIPCI or E-HIPCI (Gueye et al., 2007).21
Countries qualifying for the HIPCI – i.e. who had reached, in official jargon, the“Decision Point” – were required during an interim period to implement another IMF macroeconomic stabilization program. During this interim period, as under previous Paris Club arrangements, beneficiary countries received substantive debt service reduction. In the case of pre-cut-off bilateral debt, these reductions in almost all cases amount to 100 percent, whereas the terms for flow treatment of multilateral debt were generally less generous.22 After completing the IMF’s program and demonstrating the successful implementation of the Poverty Reduction Strategy, the country would reach the so-called “Completion Point,” upon which remaining relief was provided in the form of bilateral debt stock cancellation and – depending on the terms applied by the individual multilateral organisation – continued service relief or in some cases stock treatment for multilateral debt.23
Through the increasingly concessional and comprehensive Paris Club terms HIPCs’ PPGD owed to bilateral creditors as a share of GDP was slashed from around 70 percent of GDP in 1994 to 30 percent by 2005. Yet by 2005, the share of multilateral PPGD still stood at 60 percent of GDP (cf. Figure 1). As particularly OECD and Paris Club members were demanding greater contributions by multilateral institutions, in July 2005 the G8 proposed another relief initiative, which this time was to focus solely on the comprehensive reduction of multilateral debt. In January 2006, the IMF and African Development Fund (AfDF) began implementation of the Multilateral Debt Relief Initiative (MDRI).24 IDA and the Inter-American Development Bank (IDB) joined in July 2006 and January 2007, respectively. Under MDRI, the debt to AfDF, IMF and IDB which had been issued prior to 2005 and all IDA debt issued prior to 2004 would be cancelled for HIPCs reaching the Completion Point.25 The overall volume of MDRI is estimated at USD 57 billion in nominal terms (Gueye et al., 2007).26 By the end of 2011, 32 countries had reached the HIPCI Decision Point and were benefiting from relief under MDRI.
21
As described by Gueye et al. (2007), the reduction of commercial debt under HIPC was mainly achieved through the Commercial Debt Reduction Facility, which provides grants co-funded by IDA, France, Germany, the Inter-American Development Bank, the Netherlands, Sweden, Switzerland, and the USA to buy back commercial debt. As the HIPCI and E-HIPCI have no legally binding character, HIPCs had hardly any leverage to achieve substantive relief on commercial debt. At least 20 HIPCs have been addressees of litigation measures pertaining to commercial debt amounting to approx. USD 2 billion (Gueye et. al., 2007).
22
This refers to non-concessional (i.e. non-ODA) debt. Original Paris Club cutoff dates were maintained under HIPCI and E-HIPCI unless treatment of pre-cutoff-date non-concessional debt proved insufficient to meet HIPCs sustainability thresholds (Gueye et al., 2007). A list of the cutoff dates by country applied under HIPCI and E-HICI is provided in Appendix I. Under E-HIPCI terms, the entire concessional debt stock (i.e. ODA loans) contracted prior to and after the cutoff date was subject to cancellation (Vilanova and Martin, 2001).
23
A detailed description of the individual debt relief arrangements applied by multilateral organisations is provided in Gueye et al. (2007).
24
The African Development Fund is the concessional lending arm of the African Development Bank.
25
Furthermore, the following conditions had to be met: i) satisfactory performance on the IMF’s macroeconomic programmes, ii) satisfactory implementation of the country’s PRS, and iii) no adverse development in Public Financial Management. (Hurley, 2007).
26
A flow chart for the HIPCI and MDRI relief framework is provided in Appendix III. Appendix IV provides an overview on the volume, modalities and degrees of concessionality of relief operations since 1988.
11 4. Testing the Debt Overhang Hypothesis
The total amount of debt cancelled under HIPCI, E-HIPCI and MDRI is estimated at 109.8 billion USD (in end-2010 PV terms).27 Through the substantive reduction of HIPCs’ debt, the average ratio of nominal PPGD to GDP declined on average from its all-time high of 160 percent in 1994 to approx. 30 percent in 2010; a level comparable to that of non-HIPC control group countries (Table 1).
Table 1: Public and Publically Guaranteed Debt as a Share of GDP
Year HIPCs Non-HIPCs
1994 Average 159.48 63.86
Obs. 28 30
2010 Average 27.17 28.41
Obs. 29 30
Data source: World Bank, World Development Indicators, 2012.
This provides the basis for the following considerations: As highlighted in Section 2, efforts to empirically determine a viable and robust threshold beyond which the marginal impact of debt on investment and growth turns negative remain inconclusive (Warner, 1992; Cohen, 1997; Elbadawi et al., 1997; Pattillo et al., 2002; Pattillo et al., 2003; Chauvin and Kraay, 2005; Imbs and Ranciere, 2005). However, irrespective of where the true threshold level may fall, it can be assumed that if the adverse mechanics of debt overhang were in effect prior to HIPCI and MDRI, they now have most definitely been removed, thanks to the scope of relief provided under HIPCI and MDRI. Thus, the removal of overhang-driven adverse effects should have induced a measurable increase in national investment, productivity and economic growth.
a. Methodology
To trace the possible effects of debt relief, in the following empirical analysis the evolution of proxy indicators for investment and growth of real per capita income are compared between HIPCs – a sub-group of IDA countries and a control sub-group, i.e. IDA countries not participating in the HIPCI and MDRI. The debt relief considered here for a selected sub-group of IDA countries can be modelled as a quasi-experimental setting with the non-random assignment of countries to either the treatment group, i.e. IDA countries receiving debt relief, or to the control group, i.e. IDA countries that have not received debt relief (Ashenfelter, 1978; Ashenfelter and Card, 1985; Meyer, 1995; Buckley and Shang, 2003). Therefore, a feasible methodology for quantifying HIPCs response behaviour would be to estimate the average treatment effect on the treated (ATET).
A first simple strategy is to draw on the baseline specification of a difference-in-differences estimator that is derived from the equation for repeated cross-sectional observations in the form of
(1) Yi t, Titi
T ti i
i t, , for i1,....,N and t 0,1,27
IDA and IMF (2011) preliminary estimates for HIPCI and E-HICI: 76.0 billion USD (end-2001 PV terms, excluding relief under Naples terms) and MDRI: 33.8 billion USD (end-2010 PV terms).
12
where Yi,t denotes the outcome variable, T is the treatment dummy (0,1), and t indicates the pre- and
post-treatment periods for which observational data of the outcome variable are available. The error term icaptures all omitted determinates of Yi. The coefficient represents the ATET and is
consistently estimated through
(2) ˆ 1T 0T
1C 0C
DD Y Y Y Y ,
or applying OLS on the differenced equation in the form of (3) Yi,1Yi,0 Tii,
where captures the joint time trend in the control and treatment group. The estimator is efficient and un-biased if
(4) cov
i,Ti
0; cov
i,ti
0; cov
i,t Ti i
0.28However, particularly the last of these three assumptions, which implies a parallel time trend among treated and controls, is critical.29 It can be relaxed through the incorporation of time invariant and time variant covariates that are expected to cause different trends in outcomes among treated and controls alike, such that
(5) Yi t, Ti ti
T ti i
xitzitφti t,where tand φtare the effects of the time invariant (pre-treatment) and time variant covariates on the
outcome for each of the two time points (Meyer, 1995; Buckley and Shang, 2003). Differencing yields (6) Yi,1Yi,0
T ti i
xi ziφ i, with(7) xi xi xi xi
andziφ zi1 1φ zi0 0φ zi
φ1 φ0
.As changes in time variant covariates may result from treatment, i.e. could possibly be endogenous, they should be applied carefully.
While the specification presented here uses repeated cross sections, most empirical studies have applied difference-in-differences estimations on panel data. However, as Bertrand et al. (2004) show, difference-in-differences estimations based on long panel data significantly underestimate standard errors of the treatment effect coefficient, due to serial correlation of the outcome variable. This in turn leads to an over-rejection of the null hypothesis (i.e. that the average treatment effect is not different from zero). To avoid this common problem, the approach used here applies one possible solution proposed by Bertrand et al. (2004) – to collapse the panel data to a repeated cross-section by averaging pre- and post-treatment period observations. This brings down the rejection rate to the expected level
28
Under these assumptions the simple Diff-in-Diff estimator is unbiased as
1 0 1 0 ˆ DD T T C C E E Y E Y E Y E Y . 29
If the parallel trend assumption is violated, such that , than will be biased as
1 0 1 0 ˆ DD T T C C T C E E Y E Y E Y E Y . cov i,t Ti i E i,t Ti i 13
and, according to the authors, works well even for a small number of treatment and control cross-sections.30
As outlined in Section 3, substantive debt cancellation did not taken place prior to the introduction of Naples Terms, which were first applied in an agreement with Guinea in January 1995 (Boote et. al., 1998). Accordingly, pre-treatment observations for each country are calculated from averages of the respective outcome variable for the period from 1991 to 1994, i.e. the time before Naples terms were adopted. Post-treatment observations are obtained by averaging the respective outcome variables for the period from 2008 to 2011.31 Averages, in this context, are expected to provide more reliable point estimates for pre- and post-treatment observations as short term fluctuations are levelled out.
The overall sample comprises countries that theoretically would have been eligible for debt relief under HIPCI/E-HIPCI and MDRI, i.e. all countries which were entitled to borrow at IDA terms as of end 1994. All IDA countries that underwent Naples flow and stock treatment, subsequently qualified for HIPCI or the enhanced framework and successfully reached completion point by end 2010, thereby benefiting from MDRI, were assigned to the treatment group.32 The control group, by contrast, includes all IDA countries that have not benefited from structured Paris Club and multilateral concessional debt treatment since 1995.33 The number of countries in the treatment and control groups is fairly balanced (29 treatments units and 30 controls; see Appendix II).
b. Debt Overhang and Investment
As outlined in Section 2, according to Sachs (1988) and the related strand of literature, over-indebtedness is expected to induce an inefficiently low level of investment as future output is subject to marginal taxation in the form of debt service. In order to assess the potential effects of the HIPCI and MDRI on investment, the performance of appropriate proxies for national investment is analysed. The natural place to look at is fixed capital formation, as it provides information on the accumulation of non-current and illiquid assets by the public and the private sector. Figure 2 shows the three year moving average of total and public gross fixed capital formation as a share of GDP for HIPCs and non-HIPCs between 1983 and 2009.
30
In a Monte-Carlo simulation undertaken by the authors for a sample consisting of 50 cross-sections and a length of T=21, the rejection rate for estimating the ATET of a placebo intervention declines from around 50 percent to 5 percent for the five percent confidence level.
31
Afghanistan, Burkina Faso, Central African Republic, Rep. of Congo, Dem. Rep. of Congo, Guinea-Bissau, Haiti and Liberia that are included in the treatment group only reached the completion point between 2008 and 2010, i.e. during the post-treatment period. However, for all of these countries the debt burden had already been substantively reduced during the interim period due to the suspension of interest and principal payments (flow relief) on bilateral debt and partially front loaded relief for multilateral debt (IDA and IMF, 2011). Furthermore, it had become clear that none of the participating countries would be disqualified and denied completion of HICPI and support MDRI, although several HIPCs had temporarily fallen off track with the IMF’s interim macro-economic stabilization programmes (Fontana, 2005). This allows assuming that the here considered potential disincentives stemming from a potential debt overhang would have been removed by 2008 for all treatment group countries.
32
HIPCs, which did not complete the HIPCI itinerary until end-2010, were removed from the sample. This applies to Chad, Comoros, Côte d’Ivoire, and Guinea (IDA and IMF, 2011). Cf. Appendix II.
33
For reasons of comparability, small island economies and countries with a population of less than one million have been excluded.
14
Figure 2: GFCF for HIPCs and non-HIPCs as a percentage of GDP (three-year moving averages)
Data source: World Bank, World Development Indicators, 2012.
While throughout the 1980s and the first half of the 1990s the average share of total gross fixed capital formation (GFCF) for HIPCs and non-HIPCs was fairly stable, HIPCs’ GFCF-to-GDP ratio stayed consistently below that of non-HIPCs. In subsequent years, however, HIPCs’ share of GFCF in GDP started to catch up, resulting in an almost complete equalization by 2007/08. As this development coincided with the implementation of Naples Terms relief and the subsequent HIPCI and MDRI, the data provide some preliminary indication that debt relief exerts a positive stimulating effect on total investment.
Interestingly, as Figure 2 shows, this observation appears not to apply to public investment. Except for minor fluctuations, the level of public GFCF has been stagnating at between 5 and 8 percent of GDP for HIPCs and non-HIPCs alike. This implies that the observed increase in total investment as a percentage of GDP between 1995 and 2010 has primarily been driven by a rise in private investment ratios. Hence, if debt relief under the Naples Terms, HIPCI and MDRI has had a statistically and economically significant stimulating effect on investment, this apparently occurred through an increase in private investment. To investigate whether these preliminary indications are economically and statistically robust, the difference-in-differences framework as specified above is applied to separately estimate the ATET for total, public and private investment.
The difference-in-differences baseline specification (Eq. 3) is associated with the risk of confounding the ATET with other unobserved effects specific to the treatment or control group, as
trend-5 10 15 20 25 30 1982 1987 1992 1997 2002 2007 5 10 15 1982 1987 1992 1997 2002 2007
Average HIPCs Average Non-HIPCs Total GFCF
15
determining covariates may have been omitted. To avoid the risk of unobserved confounders, structural variables identified in the previous empirical research as determinant of total, public, and private investment – following the specification as in Eqs. 6 and 7 – have been included as pre-treatment controls in the respective specifications.34
Drawing on the findings by Cordella et al. (2010), the specification used here for total investment is modelled as function of
i) pre-treatment GNI per capita (measured in constant 2000 US dollars),
ii) the level of political and economic stability and governance (in this case approximated by the State Fragility Index developed by Marshall and Cole, 2011),35
iii) and the degree of trade openness measured by the volume of trade as a share of GDP. As total investment is an aggregate of public and private investment, determinates identified as specific to public investment (Sturm, 2001; Clements et al. 2003) have also been included:
iv) urbanisation, approximated by the share of the total population living in urban areas, is expected to induce a reduction in the demand for public investment, which mostly concerns infrastructure,36
v) development aid, measured as official development assistance per capita,37 exerts a positive effect on investment spending as it creates additional fiscal space that allows for extra-recurrent expenditure,
vi) high public debt and the resulting interest service appear to crowd out public investment, vii) a growing population is expected to stimulate the demand for public infrastructure,
requiring additional public investment.
Furthermore, a dummy for sub-Saharan African countrieshas been included in all three specifications as most HIPCs (24 out of 32) are located south of the Sahara. This is to avoid the treatment effect coefficient potentially being driven by regionally specific investment behaviour.
The dependent variable is the difference between the four year pre- and post-treatment averages of the share of total, public, and private GFCF in GDP, thereby representing the average percentage increase in the control and treatment group countries during the implementation of HIPCI and MDRI. The
34
Only covariates that can be assumed to be strictly exogenous with respect to treatment are included as time variant variables (cf. see Section 4b). As the summary statistics presented in Appendix V suggest, the averages of pre-treatment covariates – except for urbanisation – differ substantively between HIPCs and non-HIPCs such that controlling for these appears to be a necessary measure of prudence.
35
The Worldwide Governance Indicators developed with a similarly large time and country coverage are available to measure the quality of governance more directly. However, due to the documented methodological limitations (see Kurtz and Schrank, 2007; Langbein and Knack, 2010; Thomas, 2010; Knoll and Zloczysti, 2012), I refrain from using them in a repeated cross-section estimation.
36
This hypothesis, however, appears rather doubtful, as in many developing countries public investment lags behind the rapidly growing demand for infrastructure in urban areas, particularly in the fields of water and sanitation, electricity, transportation, public transport, sewage and waste management.
37
Official development assistance as reported by OECD/DAC Creditor Reporting System excluding assistance related to debt treatment received from DAC countries, i.e. OECD/DAC purpose codes 60020 (debt forgiveness), 60030 (relief of multilateral debt), 60040 (rescheduling and refinancing), 60061 (debt for development swap), 60062 (other debt swap), and 60062, 60063 (debt buy-back).
16
specification used to estimate the effects of debt relief under HIPCI and MDRI on private investment includes those covariates of the total investment specification that are not specific to public investment (cf. Warner, 1992; Sturm, 2001; Clements, 2003; Cordella et al., 2010), i.e. the sub-Saharan Africa dummy, the State Fragility Index, the level of initial GDP per capita and the degree of trade openness.38
Table 2: Effects of debt relief on total and private investment
Variable Total Investment Private Investment Public Investment Treatment Dummy 0.070 (2.00) ** 0.061 (1.92) * 0.006 (0.36) SSA Dummy -0.013 (-0.40) 0.001 (0.03) -0.002 (-0.16) State Fragility Index
(pre-treatment) -0.006 (-2.24) ** -0.004 (-1.55) -0.001 (-0.40) GNI per capita
(pre treatment) -0.001 (-0.03) 0.023 (1.27) -0.022 (-2.20) ** Trade openness (pre-treatment) 0.001 (1.36) ** 0.001 (1.24) 0.001 (2.42) ** Population growth (time variant) 0.004 (0.39) n.a. 0.003 (0.47) Urbanization (time variant) -0.001 (-1.64) * n.a. -0.001 (-0.80) Aid (pre-treatment) 0.001 (1.67) * n.a. 0.001 (1.12) N 87 89 77 Baseline 44 44 38 - o/w control 21 22 16 - o/w treated 23 22 22 Follow-up 43 45 39 - o/w control 22 24 18 - o/w treated 21 21 21 R2 0.33 0.22 0.22 F-test 5.11 0.00 3.27 0.01 3.82 0.00 * p<0.1, ** p<0.05, *** p<0.01
Robust standard errors (Huber/White robust variance estimates) are used.
As the results presented in Table 2 suggest the average treatment effect on total investment amounts to a statistically and economically significant above time trend increase of approx. 7 percentage points in GDP.39 This would indicate that the debt relief provided under Naples Terms, HIPCI and MDRI is indeed associated with a substantive and statistically significant increase in total GFCF. In the
38
A complete list of sources used is provided in Appendix V.
39
17
specification to estimate the ATET on total GFCF, the state fragility, trade openness, urbanization and development assistance covariates are statistically and economically significant.
The results also confirm the aforedescribed data indicating that the above-average increase in total GFCF is entirely driven by private investment, while a positive and meaningful treatment effect on public GFCF is not observable. The results are robust with respect to the selection of covariates and also hold in the most simple difference-in-differences specification where pre-treatment control variables are excluded (Eq. 3).
These findings clearly contradict the mechanics of debt relief as postulated by Sachs (1989), as well as the empirical findings of Clements et al. (2003), who suggest that the negative effects of high external sovereign debt are more pronounced for public than for private investment. A possible reason for the lack of a measurable above time-trend increase in public investment could be that, as outlined in Section 3, with the introduction of the E-HIPCI in 1999 and although under MDRI, a strong emphasis was put on the implementation of the short- and medium-term Poverty Reduction Strategies (World Bank, 2002). The ambitious goal of poverty reduction, while laudable, might have come at the cost of higher government consumption and lower investment expenditure, as the long-term effects of socio-economic investment were considered second-order priorities in governments’ target functions. However, this hypothesis needs further investigation to be substantiated.
The observed positive effect on private investment suggests that the reduction of public debt has indeed led, as suggested by Borensztein (1990) and Diwan and Rodrik (1992), to a decline in the socio-economic cost associated with unsustainable public debt, either by fostering a more favourable macro-economic environment or by augmented return expectations. This raises the question as to whether the positive treatment effect of debt relief on private investment has been strong enough to have meaningful effects on growth.
c. Debt Overhang and Growth
To determine the ATET of HIPCI- and MDRI-based debt cancellation on GNI per capita, a reduced-form growth model as utilized in Barro (1997) and subsequently in Clements et al. (2003), Pattillo et al. (2003), Presbitero (2008), and Cordella et al. (2010) is applied to the difference-in-differences framework. The dependent variable is the difference between the four year pre- and post-treatment averages of real GNI per capita (in logarithms), thereby approximating the average percentage increase in control and treatment group countries during the implementation of HIPCI and MDRI. The specification is in the form of Eq. 6 and includes the standard pre-treatment as well as time variant controls (the former are those that are possibly endogenous, the latter are those that are entirely exogenous with respect to treatment). The applied pre-treatment controls are those identified in previous research to determine development countries’ growth paths, i.e. the initial level of real GDP per capita to account for the convergence assumption (Barro, 1997; challenged by Easterly, 2001), the
18
level of trade openness (measured as ratio of exports to GDP, cf. Sachs and Warner, 1995), the terms of trade to approximate a country’s relative beneficiary position in international trade (Cordella et al., 2010), and the initial level of inflation (in natural logarithms). As the availability of terms of trade data is limited, thereby reducing the number of total observations in the regression, the growth equation is estimated with (Table 3, estimation results IV-VI) and without (Table 3, estimation results I-III) the terms of trade covariate. As can be seen, the economic and statistical significance of the variables of interest is not affected by the inclusion or exclusion of the terms of trade variable.
Again, the State Fragility Index developed by Marshall and Cole (2011) has been included as time invariant pre-treatment variable to control for the anticipated positive effect of political, economic and social stability on growth, as HIPCs appear to be systematically less stable than non-HIPCs. As for the regression specifications in Section 4a, an SSA dummy is applied to avoid potential confounding of treatment and region specific effects. Furthermore, in line with the assumption of capital formation being an important determinate of economic growth, the estimation specification controls for pre-treatment total (Table 3, results I and IV), public (Table 3, results II and V) and private gross fixed capital formation (Table 3, results III and VI), respectively. As indicators on human capital (mostly approximated using secondary school enrolment rates), in all cases remained statistically and economically insignificant (cp. Barro, 1997 and Clements et. al., 2003), they are omitted in the current specification.
Following the more recent literature on determinates of growth (Easterly and Levine, 2001; Pattillo et al., 2003) which identifies TFP as the principal explanatory force for cross-country and over-time variation in per capita growth rates, with capital accumulation of only subordinate importance, the average pre-treatment level of TFP has been included.40 As population growth can be considered exogenous of debt relief, it is included as time variant variable. Population growth may negatively affect the level of GNI per capita as it, if associated with a growing labour force, results in a decline in the capital-to-labour-ratio, thereby reducing productivity per capita (Barro, 1997).
The results suggest the following: While the pre-treatment level of national investment (particularly public investment), the regional dummy, the fragility and governance proxy and particularly the level of total factor productivity appear to be decisive factors in determining per capita GNI growth during the observation period, the treatment dummy is negative but statistically insignificant in all six specifications. This would suggest that debt relief under HIPCI and MDRI has apparently not had a substantive positive effect on growth, despite the indications that the two debt relief initiatives had substantive positive effects on private investment.
40
The data are drawn from UNIDO’s World Productivity Database, which contains information on the level and the growth of productivity for 112 countries from 1960 to 2000. The database has the comparative advantage that it for the first time provides time- and cross-section-consistent data for a large sample of developing countries. The level of TFP is calculated as an index and relative to U.S. total factor productivity. A more detailed description is provided in Appendix V.
19
Table 3: Impact of debt relief on real GNI per capita growth
Variable I II III IV V VI
Treatment Dummy -0.153 -0.090 -0.062 -0.206 -0.141 -0.113
(-0.96) (-0.52) (-0.35) (-1.22) (-0.76) (-0.60) SSA Dummy -0.053 -0.063 -0.047 -0.090 -0.124 -0.119
(-0.56) (-0.52) (-0.46) (-0.85) (-1.15) (-1.04) State Fragility Index
(pre-treatment) -0.023 -0.024 -0.029 * -0.022 -0.025 -0.027 (-1.56) (-1.61) (-1.83) (-1.22) (-1.36) (-1.37) Trade Openness (pre-treatment) 0.042 0.044 0.037 0.062 0.068 0.068 (0.61) (0.63) (0.51) (0.83) (0.92) (0.91)
Terms of Trade index
(pre-treatment) n.a. n.a. n.a. -0.124 -0.156 -0.167 (-0.77) (-0.96) (-0.99) Inflation
(pre-treatment)
0.013 0.012 -0.007 -0.004 -0.008 0.008
(0.32) (0.29) (-0.15) (-0.09) (-0.20) (0.16) GNI per capita
(pre-treatment) 0.002 *** 0.002 *** 0.001 *** 0.002 *** 0.002 *** 0.001 *** (6.33) (6.11) (5.22) (6.03) (5.76) (5.09) Population growth (time variant) 0.051 0.043 0.004 0.033 0.018 -0.016 (1.66) (1.25) (0.12) (1.02) (0.55) (-0.50) GFCF in percent of
GDP (pre-treatment) 0.308 *** - n.a. 0.244 ** - n.a.
(3.03) (2.38)
Public GFCF in percent of GDP (pre-treatment)
- 0.288 *** n.a. n.a. 0.200 * n.a.
(2.63) (1.94) Private GFCF in percent of GDP (pre-treatment) - - 0.111 n.a. - 0.063 (1.47) (0.90) TFP index (pre-treatment) 0.335 ** 0.328 ** 0.343 ** 0.274 * 0.251 * 0.249 * (2.22) (2.19) (2.22) (1.96) (1.87) (1.76) N 70 66 66 66 60 60 Baseline 35 33 33 33 30 30 o/w control 11 10 10 9 8 8 o/w treated 24 23 23 24 22 22 Follow-up 35 33 33 33 30 30 o/w control 11 10 10 9 8 8 o/w treated 24 23 23 24 22 22 R2 0.86 0.86 0.85 0.87 0.87 0.87 F-test 51.82 46.92 45.36 52.25 48.46 54.28 0.00 0.00 0.00 0.00 0.00 0.00 * p<0.1, ** p<0.05, *** p<0.01
Robust standard errors (Huber/White robust variance estimates) are used.
This result raises the question as to why HIPCI and MDRI have not been more successful in stimulating economic growth. There are three possible answers, which might have joint or partial validity: First, it may simply be too early to tell, as more time may be needed before the positive growth effects of debt relief become visible and measurable. If the level of public debt is a determinate
20
of economic growth over the long-term, the post treatment period covered in the empirical analysis may be too brief to reveal possible stimulating effects. As indicated, most HIPCs reached the completion point in the years between 2000 and 2006, such that positive treatment effects may not be reflected in the 2007 to 2010 data.
Second, while HIPCI and MDRI apparently have been successful in stimulating private investment, a positive effect on public investment, measurable vis-à-vis the treatment group, is, as discussed above, not observable. Yet as the results from the growth regression and previous research suggest (Clements et al., 2003), public investment is at least as important in stimulating economic growth as private investment. Therefore, one important mechanism through which debt relief is expected to trigger growth in accordance with the debt overhang hypothesis – namely, through the enhancement of public investment – appears broken, at least for the HIPCI and MDRI.
Third, and probably most importantly, while the two initiatives have had some impact on capital accumulation, it seems that the HIPCI and MDRI are not associated with measureable above time-trend increase in TFP, which, according to the results presented here and confirming earlier findings by Easterly and Levine (2001) and Pattillo et al. (2003), is the second and actually most important channel through which debt relief is expected to boost economic growth.
As Table 4 shows both, HIPCs’ average pre-treatment level of TFP and the average annual growth rates in TFP during the treatment period remain significantly below those for non-HIPCs during the period of HIPCI and MDRI implementation.
Table 4: Total Factor Productivity for HIPCs and non-HIPCs
Period HIPCs (I) Non-HIPCs (II) T-test
Pre-treatment level
(TFP-index; relative to U.S. TFP)
Average 0.170 0.236 H
1: Diff (II-I)>0:
Pr(T > t) = 0.00
S.E. 0.01 0.02
Average annual TFP growth rate 1996-2010 in percent
Average 0.129 0.605 H1: Diff (II-I)>0:
Pr(T > t) = 0.10
S.E. 0.19 0.34
N: 22 14
Furthermore, if it is assumed that the main channel for enhancing productivity is economic policy and adjustment effort, as suggested by Krugman (1988) and Easterly and Levine (2001), then the results may point towards the fact, that the HIPCI and MDRI are not associated with effective productivity enhancing policies.
5. Conclusion
The HIPCI and MDRI represent the largest and most comprehensive effort to permanently eliminate unsustainable levels of public external debt in low income countries thus far. The debt overhang hypothesis as developed by Krugman (1988) and Sachs (1989) has been a principal building block in
21
the intellectual edifice underpinning these debt relief initiatives. This hypothesis claims that if a debt overhang is accumulated or inherited, it discourages productivity enhancing investment and adjustment efforts, thereby leading to an inefficiently low level of future output.
While a growing strand in the literature has found some evidence that the over-accumulation of debt appears to have negative effects on capital accumulation and factor productivity, the implicit converse assumption underlying the HIPCI and MDRI – namely, that debt relief therefore must be associated with increased investment activity, growth in TFP and a subsequently increase in economic output – has previously never been validated, primarily due to a lack of relevant data. As almost all beneficiary countries have by now received irrevocable cancelation of debt under the HIPCI and MDRI, the two initiatives serve as an ideal test case for examining the debt overhang hypothesis, as least as it applies to debt relief measures for low income countries.
Using a quasi-experimental research design to compare the performance of investment and growth between low income countries that have benefited from relief (HIPCs) and those that have not (non-HIPCs), this study assessed whether debt relief under the HIPCI and MDRI has yielded the expected effects.
The empirical results do not confirm the mechanisms posited by the debt overhang hypothesis. While the HIPCI and MDRI appear to have been partially successful in stimulating private investment, a measurable positive effect on public investment is not observable. As public investment is at least as equally decisive in enhancing economic growth as public investment, key assumptions concerning how debt relief is expected to drive growth as per the debt overhang hypothesis would appear to be erroneous. A possible reason for why debt relief fails to stimulate public investment could be the strong emphasis put on short and medium-term poverty reduction within the scope of the HIPCI and MDRI. This emphasis may have led to higher government consumption and lower investment expenditure. Nevertheless, further research is required to investigate this question.
Most importantly, the data show that the HIPCI and MDRI have not had positive effects on TFP; in fact the average TFP growth rate for HIPCs stayed well below that of non-HIPCs. As the more recent literature (Easterly and Levine, 2001; Pattillo et al., 2003) identifies TFP as a principal factor that accounts for cross-country and over-time variation in per capita growth rates, the systematically weak performance of HIPCs is not surprising. If Krugman’s (1988) argument that productivity growth is primarily achieved through macroeconomic adjustment and policy reform is correct, the results presented indicate that the HIPCI and MDRI are ineffective in facilitating the adoption of macroeconomic policies that would support growth.
22 References:
Abrego, Lisandro; Ross, C. Doris (2001): Debt Relief Under the HIPC Initiative: Context and Outlook for Debt Sustainability and Resource Flow. IMF Working Paper 01/144, September, Washington, D.C.
AfDB (2006): Aid, Debt Relief and Development in Africa. African Development Report 2006. Oxford University Press.
Arslanalp, Serkan; Henry, Peter B. (2004): Helping the Poor to Help Themselves: Debt Relief or Aid. NBER Working Paper No. 10230, Cambridge, MA, January.
Arslanalp, Serkan; Henry, Peter B. (2006): Debt Relief. NBER Working Paper No. 12187, Cambride, MA, April.
Ashenfelter, Orley C. (1978): Estimating the Effect of Training Programs on Earnings. Review of Economics and Statistics, 60(1), pp. 47-57.
Ashenfelter, Orley C.; Card, David (1985): Using the Longitudinal Structure of Earnings to Estimate the Effect of Training Programs. Review of Economics and Statistics, 67(4), pp. 648-660.
Barro, Robert J. (1997) Determinants of Economic Growth: A Cross-Country Empirical Study. Cambridge MA, MIT Press.
Bertrand, Marianne; Duflo, Esther; Mullainathan, Sendhil (2004): How Much Should We Trust Differences-in-Differences Estimates? The Quarterly Journal of Economics, February 2004.
Birdsall, Nancy; Williamson, John and Deese, Brian (2002): Delivering on Debt Relief: From IMF Gold to a New Aid Architecture. Center for Global Development and Institute for International Economics. Washington, D.C., April.
Boote, Anthony R.; Brooks, Ray; Cortes, Mariano; Drummond, Paulo; Jarvis, Christopher; Krieger, Reva; Nishizawa, Toshiro; Ross, Doris; Thugge, Kamau (1995): Official Financing for Development Countries, World Economic and Financial Surveys, IMF, Washington, December.
Boote, Anthony R.; Thugge, Kamau (1997): Debt Relief for Low-Income Countries and the HIPC Initiative. IMF Working Paper 97/24. Washington, D.C. March.
Boote, Anthony R.; Ross, Doris C.; Cortes, Mariano; Daseking, Christina; Kramarenk, Vitali; Nishizawa, Toshiro; Rizavi, Saqib; Ross, Kevin (1998): Official Financing for Development Countries, World Economic and Financial Surveys, IMF, Washington, February.
Borensztein, Eduardo (1990): Debt Overhang, Credit Rationing and Investment. Journal of Development Economics, Vol. 32 (1990), pp. 315-335.
Buckley, Jack; Yi Shang (2003): Estimating policy and program effects with observational data: the “differences-in-differences” estimator. Practical Assessment, Research & Evaluation, Vol. 8(24) Callaghy, Thomas M. (2004): Innovation in the Sovereign Debt Regime: From the Paris Club to Enhanced HIPC and beyond. The World Bank Evaluation Department, Washington, D.C.
Card, D., Krueger, A. (1994): Minimum Wages and Employment: A Case Study of the Fast-Food Industry in New Jersey and Pennsylvania. The American Economic Review, Vol. 84(4), pp. 772-793. Chauvin, Nicolas D.; Kraay, Aart (2005): What Has 100 Billion Worth of Debt Relief Done for Low-Income Countries? Mimeo (http://papers.ssrn.com/sol3/papers.cfm?abstract_id=818504).