Measuring robust functional connectivity from resting-state MEG using amplitude
and entropy correlation across frequency-bands and temporal scales
Megan Godfrey∗, Krish D. Singh
CUBRIC, School of Psychology, College of Biomedical and Life Sciences, Cardiff University, Cardiff, UK
Abstract
Recent studies have shown how MEG can reveal spatial patterns of functional connectivity using frequency-specific oscillatory coupling measures and that these may be modified in disease. However, there is a need to understand both how repeatable these patterns are across participants and how these measures relate to the moment-to-moment variability (or ‘irregularity’) of neural activity seen in healthy brain function. In this study, we used Multi-scale Rank-Vector Entropy (MRVE) to calculate the dynamic timecourses of signal variability over a range of temporal scales. The correlation of MRVE timecourses was then used to detect functional connections in resting state MEG recordings that were robust over 183 participants and varied with temporal scale. We compared these MRVE connectivity patterns to those derived using the more conventional method of oscillatory amplitude envelope correlation (AEC) using methods designed to quantify the consistency of these patterns across participants. Using AEC, the most consistent connectivity patterns, across the cohort, were seen in the alpha and beta frequency bands. At fine temporal scales (corresponding to ‘scale frequencies’, fS = 30-150Hz), MRVE correlation detected mostly occipital and parietal connections. These
showed high similarity with the networks identified by AEC in the alpha and beta frequency bands. The most consistent connectivity profiles between participants were given by MRVE correlation at fS = 75Hz and AEC in the beta band.
The physiological relevance of MRVE was also investigated by examining the relationship between connectivity strength and local variability. It was found that local activity at frequencies fS &10Hz becomes more regular when a region
exhibits high levels of resting state connectivity, as measured by fine scale MRVE correlation (fS ∼30-150Hz) and by
alpha and beta band AEC. Analysis of the EOG recordings also revealed that eye movement affected both connectivity measures. Higher levels of eye movement were associated with stronger frontal connectivity, as measured by MRVE correlation. More eye movement was also associated with reduced occipital and parietal connectivity strength for both connectivity measures, although this was not significant after correction for multiple comparisons.
Keywords: Functional connectivity, MEG, Resting state, Variability, Multi-scale Rank-Vector Entropy
1. Introduction
In recent years, MEG has revealed much about the electrophysiological underpinnings of connectivity in the brain. The direct view of neuronal activity provided by MEG and its excellent temporal resolution have allowed the investigation of frequency-specific communication (Brookes et al., 2011; Hillebrand et al., 2012; Hipp et al., 2013) and dynamic changes in connectivity on the millisecond timescale (Baker et al., 2014; O’Neill et al., 2017).
Alterations in MEG connectivity have also been de-tected in patient groups (Van Dellen et al., 2014; Ghanbari et al., 2015; Brookes et al., 2016; Hamandi et al., 2016; Engels et al., 2017; Boon et al., 2017). However, to be clinically useful, connectivity research must progress from group-level analysis to the characterisation of individual
∗Corresponding author
Email addresses: [email protected](Megan Godfrey),
[email protected](Krish D. Singh)
subjects. To make meaningful comparisons between con-nectivity profiles of individuals, robust concon-nectivity mea-sures are needed that give consistent results for subjects with the same pathology.
Several recent studies have found that many commonly used techniques for measuring functional connectivity in MEG lack repeatability between healthy subjects, and even show inconsistency over repeated scans of the same sub-ject (Wens et al., 2014; Colclough et al., 2016; Liuzzi et al., 2017). Colclough et al. (2016) found that the method that gave the most consistent connectivity was oscillatory am-plitude envelope correlation (AEC), using symmetric or-thogonalisation to remove spurious zero-lag correlation be-tween timecourses due to signal leakage (Colclough et al., 2015). The repeatability of connectivity given by any al-ternative methods could therefore be compared to AEC to assess the extent to which it can add to our understanding of cortical communication in health and disease.
Many of the most popular techniques for measuring connectivity are based on measuring the synchronisation
of oscillatory activity within narrow frequency bands. An-other, less studied, aspect of electrical neural activity is the constantly fluctuating activity present in the brain even when it is supposedly ‘at rest’. This variable activity is observed when there is a breakdown of synchrony between neurons, allowing an increase in the information that can be processed within a network (Brookes et al., 2015). The MEG signals generated by such activity consist of a su-perposition of many low power signals from smaller neuron populations. This variable activity appears more irregular, or ‘random’, and so is often dismissed as neural ‘noise’, but it is thought to be vital for healthy brain function (Deco et al., 2011; Garrett et al., 2013; Takahashi, 2013). It has been shown that the variability of neural activity increases as the brain matures (Mcintosh et al., 2008; Lipp´e et al., 2009; McIntosh et al., 2014), and it has been found to be altered in patient groups where activity that is either too regular or too variable is associated with mental disor-der (Takahashi, 2013; Protzner et al., 2010; Mizuno et al., 2010; Fern´andez et al., 2013; Brookes et al., 2015; Monge et al., 2015; Ghanbari et al., 2015; Mateos et al., 2018).
While the physiological role of variability in the brain is not certain, it is possible that it is related to levels of synchronisation between cortical regions, i.e. connectivity. The synchronisation of oscillatory activity, which is highly regular and therefore has low variability, is currently the most promising mechanism for connectivity between brain regions (Schnitzler and Gross, 2005; Fries, 2005; Donner and Siegel, 2011; Brookes et al., 2011; Hillebrand et al., 2012; Tewarie et al., 2019). In contrast, it is thought that local information processing performed within segregated brain regions is associated with signals that contain higher levels of information and therefore have higher variability (Tononi et al., 1994; Friston et al., 1996). Therefore, mea-sures of variability and oscillatory activity may be sen-sitive to complementary aspects of functional connectiv-ity. It was found in a recent MEG study that variabil-ity and oscillatory amplitude have a complex relationship, and that the variance in the variability of neuronal signals could only partially be explained by oscillatory amplitude across frequencies (Brookes et al., 2015). Variability could therefore provide information about functional connectiv-ity beyond that which is available from measures based on the oscillatory components of brain activity.
There is evidence for a relationship between neural variability and functional connectivity in the literature. One fMRI study found a correlation between the variabil-ity of BOLD signals and functional connectivvariabil-ity (Wang et al., 2018) between spatially separated cortical regions. Age-related connectivity changes have also been shown to covary with the variability of EEG and MEG signals (Vakorin et al., 2011; McIntosh et al., 2014) and in an EEG study applying graph theory to functional networks, variability was found to correlate with network node cen-trality (Miˇsi´c et al., 2011).
The variability of neural activity can be quantified us-ing entropy measures, where more disordered and irregular
signals have larger entropy, and more regular signals have lower entropy. There are many possible ways of estimat-ing signal entropy (Garrett et al., 2013). However, one measure that has been shown to be useful in measuring the spatio-temporal variability of MEG signals is Rank-Vector-Entropy (RVE) (Robinson et al., 2013; Brookes et al., 2015). RVE is a derivative of Shannon entropy (Shannon, 1948) that has a built-in ability to provide a dynamic time-course of signal entropy, retaining the temporal resolution of the original signal. It is also computationally efficient, is calculated from broadband activity timecourses, and is independent of signal amplitude (Robinson et al., 2013). The relationship between variability and neural synchro-nisation, and the desirable qualities of RVE, suggest that RVE could be an alternative measure to use in functional connectivity analysis that is not limited to the considera-tion of oscillatory activity.
RVE, and many other entropy measures, measure sig-nal variability at a single temporal scale. However, it has been shown that neural activity contains recurring pat-terns that occur across a range of such scales (Costa et al., 2005). It is not certain what these correspond to phys-iologically, however it is thought that activity at coarser scales is associated with long range, distributed informa-tion processing, while more local processing is captured at finer scales (Vakorin et al., 2011).
To utilise the in-built temporal resolution that is spe-cific to RVE, a multi-scale extension of RVE (MRVE) is proposed (Costa et al., 2005). MRVE timecourses at any temporal scale can be calculated from MEG virtual sensor timecourses at any number of required voxels, allowing for a direct comparison with dynamic oscillatory measures. In this paper, MRVE was used used to reconstruct func-tional connectivity patterns, assess how repeatable these patterns are across a cohort of healthy volunteers and in-vestigate how these patterns vary with temporal scale. We then compared connectivity profiles measured by MRVE correlation with those derived using amplitude envelope correlation (AEC). We also compared the robustness of MRVE correlation, and whether it provides extra infor-mation over standard methods, by comparing connectiv-ity patterns derived at multiple entropy time scales with those derived from AEC in multiple frequency bands. The physiological relevance of variability was then investigated by examining the relationships between MRVE, oscillatory amplitude and regional connectivity strength. Finally, the effects of eye movement on the measured connectivity were investigated through analysis of EOG recordings.
2. Methods
2.1. Data acquisition
Five-minute eyes open resting state MEG recordings were acquired from 183 participants (123 female) as part of the ‘100 Brains’ and UK MEG Partnership normative
scanning projects. Inclusion criteria ensured all partici-pants were aged 18-65 (mean 24.5±5.4 years), had com-pleted or were undertaking a degree, had normal or corrected-to-normal vision, and had no history of neurological or neuropsychiatric disorders. All procedures were given eth-ical approval by the Cardiff University School of Psychol-ogy Ethics Committee, and all participants gave written informed consent before taking part.
Data were acquired using a whole head 275-channel CTF radial gradiometer system at a 1200 Hz sample rate. An additional 29 reference channels were recorded for noise cancellation purposes and the primary sensors were anal-ysed as synthetic third-order gradiometers (Vrba and Robin-son, 2001). Subjects were seated upright in the magneti-cally shielded room with their head supported with a chin rest to minimize movement. Participants were asked to rest and fixate their eyes on a central red fixation point, presented on either a CRT monitor or LCD projector. The fixation point was presented on a background of zero lu-minance to minimise the effect of the screen refresh rates on cortical oscillatory activity. Head localisation was per-formed at the beginning and end of each scan, using three fiducial markers. Horizontal and vertical electro-oculograms (EOG) were recorded to monitor eye blinks and eye move-ments.
Participants also underwent a magnetic resonance imag-ing (MRI) session to acquire a T1-weighted 1mm anatom-ical scan, using an inversion recovery spoiled gradient echo acquisition (3T, General Electric).
2.2. Pre-processing
All data were downsampled to 600Hz and a 1-150Hz bandpass filter applied. Datasets were cut into 2 second epochs, which were each visually inspected and removed if they contained any major artefacts, such as ocular or muscular movement artefacts. Out of a maximum of 150 epochs across the five-minute recording, an average num-ber of 147.0±0.5 trials were retained across all partici-pants. There was no significant difference in the number of trials retained between male and female participants as de-termined by an unpaired t-test (T(88) = 1.84, p= 0.07). The effective number of degrees of freedom was calculated using the Satterthwaite approximation to account for a difference in sample variance between the male and female subgroups.
Co-registration was performed manually between the MEG and MRI coordinate spaces; the fiducial locations were kept fixed relative to each participant’s nasion, left and right ears and so could then be identified and marked on their MRI scan.
To perform analysis in source space, MEG virtual sen-sor timecourses were obtained using a scalar LCMV beam-former (Van Veen et al., 1997) using FieldTrip (Oostenveld et al., 2011). Lead fields were calculated using a local-spheres head model for voxels on a 6mm3 grid (Huang et al., 1999). Covariance matrices were obtained using the broadband pre-processed data filtered between 1-150Hz,
as well as for activity within ten narrower frequency bands (1-4, 3-8, 8-13, 13-30, 40-60, 60-80, 80-100, 100-120, 120-140 and 120-140-160Hz). For all frequency bands, beamformer weights were normalised using the vector norm (Hillebrand et al., 2012). The coordinate space for each participant was transformed to the MNI template (Fonov et al., 2009). The estimated timecourses were then calculated at each voxel for each frequency band, which were then subse-quently used to calculate variability and oscillatory am-plitude timecourses.
2.3. Variability 2.3.1. RVE
The RVE method was first described by (Robinson et al., 2013). At each time point, a window ofW points is taken from the signal, each separated by a lag,ξ, to avoid oversampling, wherefsrepresents the sample rate, andfc
is the low-pass frequency applied to the data.
ξ= fs 2fc
(1) TheseW points are ordered in size, and then converted to the position they originally held in the window. This is the ‘rank-vector’ associated with this time point. The Shannon entropy is calculated at each time point using a state probability distribution derived from the frequency of occurrence of the rank-vectors that occurred previously in the signal (Shannon, 1948). Temporal resolution is in-troduced using a ‘leaky integrator’, which gives RVE a ‘memory’ of states that is limited in time (Robinson et al., 2013).
2.3.2. MRVE
The calculation of MRVE at each scale is identical to the calculation of RVE, except that each instance of the sliding window is formed from a ‘coarse-grained’ version of the raw signal. For a given scale factor, S, at each time point in the signal,t,W consecutive, non-overlapping windows of S points are taken starting at t, where each value is separated by lagξ. Then, the values in the sliding window are found by taking the average of the data points within these windows. This is given by Equation 2, where
xrepresents the signal timecourse sampled with lagξ, and
yt is the window found at time pointt.
yt,j = 1 S jS X i=t+(j−1)S+1 xi f or1≤j ≤W (2)
As the rank-vector calculated is dependent on the scale factor used, a separate entropy timecourse is generated for each value ofS used.
The time scale examined by MRVE is determined by the effective sample frequency of the values in yt. This ‘scale frequency’, fS, is determined by the scale factor,
where a higher value of S corresponds to a coarser sam-pling rate and therefore a lower value offS(Courtiol et al.,
2016). Equation 3 relates the scale factor to fS to aid in
the interpretation of MRVE and its relationship with os-cillatory measures.
fS =
fc
S (3)
2.4. Functional connectivity
90 nodes were selected by taking one voxel timecourse to represent each region of the AAL atlas (Tzourio-Mazoyer et al., 2002). The selection was performed for each par-ticipant and for each frequency band, by identifying the virtual sensor time course, within each AAL region, that had the highest temporal standard deviation. This voxel was chosen as an estimate of the timecourse exhibiting the maximum SNR within the region. To avoid the de-tection of spurious connections due to signal leakage, the zero-lag correlation between all 90 AAL timecourses was removed by symmetric orthogonalisation (Colclough et al., 2015). This resulted in 90 orthogonal timecourses for each participant and frequency range, which were then used to calculate MRVE and oscillatory amplitude timecourses.
MRVE was calculated from the broadband, 1-150Hz virtual sensor timecourses, using a window length ofW = 5 and a decay time constant of τ = 0.07s. Timecourses were calculated for 25 scale factors between S = 1−150, with corresponding scale frequencies ranging from fS =
1−150Hz. Oscillatory amplitude envelopes were found by applying the Hilbert transform to the timecourses ob-tained for each of the aforementioned narrow frequency bands. Functional connectivity was then measured as de-scribed by Koelewijn et al. (2019). The MRVE and Hilbert envelope timecourses were de-spiked to remove artefactual temporal transients using a median filter, and downsam-pled to 1 Hz. The first 50 samples were then trimmed to remove the MRVE ‘warm-up’ period while the histogram populates, and a window of samples at the end was re-moved, the length of which was defined by the length in time of the longest sliding window used in the MRVE cal-culation, corresponding to the largest scale factor.
Functional connectivity matrices were calculated sep-arately for MRVE at each scale, and for oscillatory am-plitude within each narrow frequency band by correlat-ing each of the 90 timecourses from each participant with all others. The correlation values were then normalised by converting them to Z-scores using the Fisher trans-form. These were variance-normalised to correct for the effects of the varying timecourse lengths between partici-pants, due to the removal of data epochs containing arte-facts (Koelewijn et al., 2019). Without such normalisation, datasets which have had more epochs removed are more likely to show higher correlations between the calculated amplitude and entropy envelopes, by chance, due to their shorter length. Significant connections were determined by first ranking connections in order of strength for each
participant, where the strongest connection was given the value 1 and the weakest given value 0. For each connection, the mean rank value was then found across participants. ‘Valid connections’ were taken as those with a mean rank above a threshold of 0.8, indicating that these connections are consistently among the strongest across participants. This threshold is arbitrary, however it has been shown pre-viously to be a suitable threshold for detecting robust rest-ing state network connections usrest-ing AEC (Koelewijn et al., 2019).
2.5. Software
Data analysis was performed in MATLAB, using Field-trip functions and custom built MATLAB scripts (Oost-enveld et al., 2011). Connections were visualised on a tem-plate brain using the SourceMesh MATLAB toolbox, and voxel-wise correlation colourmaps were created in mri3dX.
3. Results
3.1. Consistency of functional connectivity across partici-pants
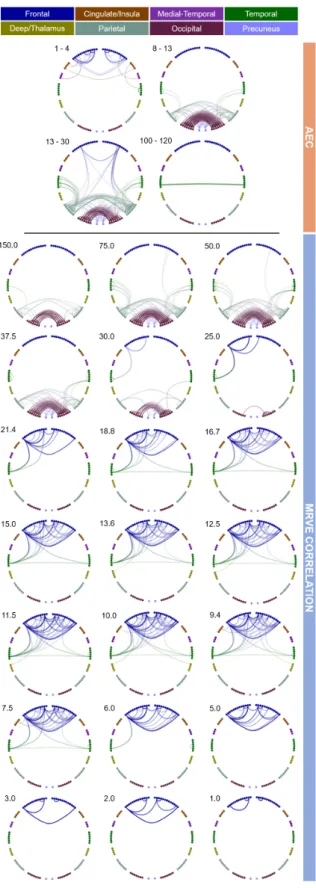
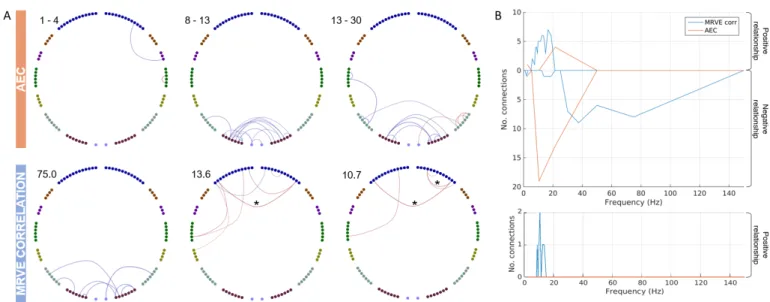
First, MRVE correlation was used to measure func-tional connectivity and we assessed which of these connec-tions were consistently among the strongest across sub-jects. Figure 1 shows the location and number of the valid connections found for scale frequencies,fS = 1-150Hz. At
higher scale frequencies, i.e. at finer temporal scales, most connections are found in occipital and parietal regions. As shown in Figure 2, the maximum number of connections was found atfS = 75Hz. However, there is a second peak
in the number of valid connections found at fS = 10Hz,
where more frontal connections are seen. Cumulatively across all scales, valid connections were detected between 254 different pairs of nodes.
The valid connections found using AEC are also shown in Figure 1. Valid connections were found within four frequency bands. The most valid connections were seen in the beta band, giving the same number as for fS =
75Hz using MRVE correlation. Across all frequency bands, valid connections were detected between 248 different node pairs.
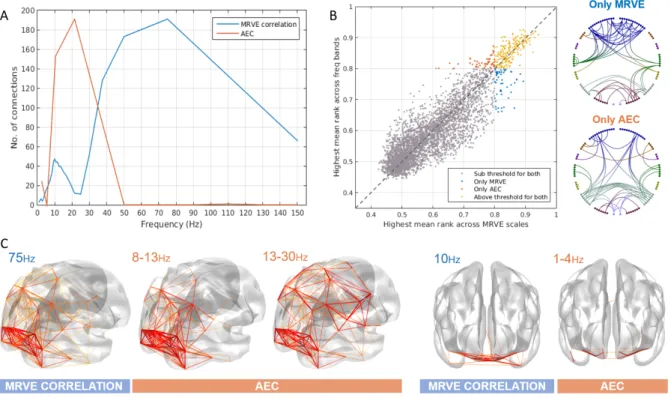
We then investigated whether MRVE correlation could provide additional information about functional connec-tivity beyond that provided by AEC analysis. Firstly, it was seen whether each method could detect unique connec-tions that were not deemed valid by the alternate method. To determine this for each connection, its mean rank, av-eraged across all subjects, was calculated for all scale fre-quencies for MRVE and for all frequency bands using AEC. For each connection, we then found the highest mean rank for any of the MRVE scales and the highest mean rank for any of the AEC frequency bands. Those with a highest mean rank above the threshold of 0.8 for either method were taken as detectable by the corresponding connectiv-ity measure. Figure 2 shows the highest mean rank val-ues for each connection plotted against each other. Those
Figure 1: Valid connections (mean rank >0.8) found using AEC correlation for four frequency bands (above) and MRVE correlation for a range of time scales (below). Each point represents an AAL region and each line represents a connection. The midpoint of the frequency band (for AEC) or scale frequency (for MRVE correlation) is indicated in the top left corner of each plot, in Hz. The key at the top indicates the colour of the connections that originate in each brain region. No valid connections were found using AEC in the 3-8, 40-60, 60-80, 80-100 or 140-160Hz frequency bands.
connections that are ‘unique’ to each method are shown plotted between the AAL nodes. 200 connections are vis-ible for both MRVE correlation and AEC across all scales and frequency ranges, leaving 54 connections (21%) that can only be seen using MRVE correlation, and 49 (19%) that can only be seen using AEC.
3.1.1. Robustness of connectivity measures to sample size The robustness of each connectivity measure to the participant sample size was determined using bootstrap-ping. Sub-samples of a range of sizes were taken from the participant cohort by simple random sampling with re-placement. The number of valid connections was found for each sub-group taken, over 1000 tests per sub-group size,
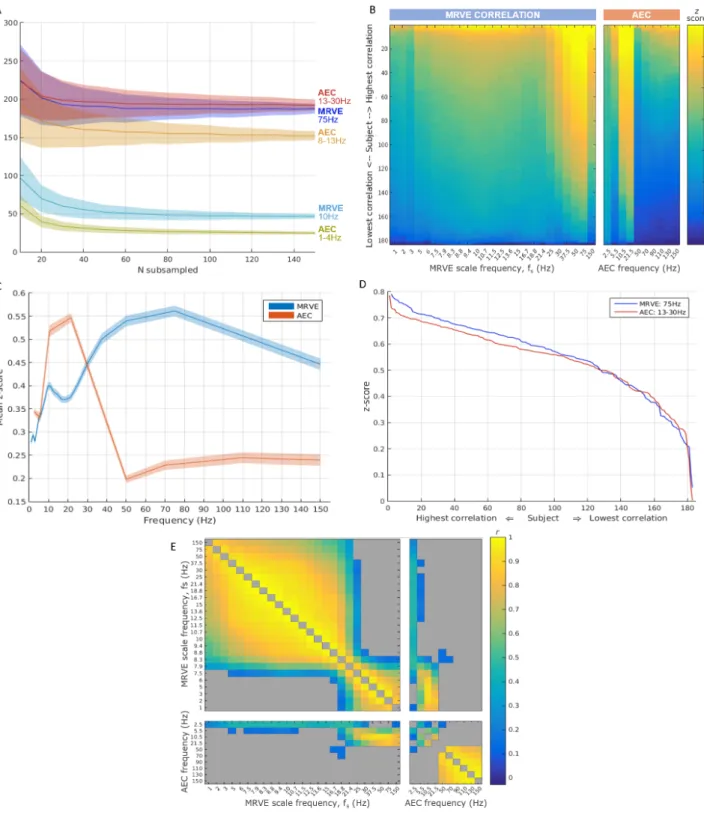
N. It can be seen in Figure 3A that the average number of connections found was less stable when using fewer par-ticipants in the analysis for both MRVE correlation and AEC. The average number approximates to the number of connections detected using the whole cohort (as shown in Figure 2A) when usingN &60. However, for both MRVE correlation and AEC, the variance in the number of valid connections detected was found to be larger when fewer participants were included. For N . 60, a smaller sam-ple was also associated with more connections detected on average.
3.1.2. Consistency of connectivity patterns across partici-pants
The consistency of the connectivity profiles between individuals was then investigated. The average connectiv-ity profile for each frequency band and scale frequency was taken by vectorising the meanzscore connectivity matrix. This profile was then correlated with the equivalent vector ofz scores obtained for each participant individually. For very robust networks that are highly reproducible across subjects, this method will give consistently high pattern-correlationwith the average connectivity profile. However, the distribution of correlation coefficients will be, on aver-age, lower for a network that shows high variability across participants. Eachpattern-correlation coefficient is repre-sented in the colour plot shown in Figure 3B. For each scale factor and frequency band, these have been sorted in de-scending order of participants. Consistent high correlation with the average connectivity patterns, representing high cross-subject repeatability, can be seen for MRVE correla-tion at scale frequencies 50 and 75Hz, and for alpha and beta band AEC.
To further quantify the consistency of each connectiv-ity measure across subjects, the mean correlation with the average connectivity profile was found for each scale fre-quency and frefre-quency band (i.e. the average was taken from each column on the colour plot). These average pattern-correlation values are shown in Figure 3C, with errorbands generated by bootstrapping, using 1000 sub-samples of group sizeN = 90. The highest mean pattern-correlation was found for MRVE correlation, fS=75Hz
(r = 0.5089±0.0004), followed by beta band AEC (r = 5
Figure 2: A) The number of valid connections found for each scale frequency using MRVE correlation and each frequency band using AEC. B) The highest mean rank of each connection across all frequency bands vs. all scale frequencies, where the colour indicates whether the connection is detected by both MRVE correlation and AEC, detected by neither, or detected by only one of the methods. Circle plots show the connections that are only detected as valid by either MRVE correlation or AEC. C) Valid connections plotted on a template brain for MRVE scale frequenciesfS= 75Hz and 10Hz and AEC frequency bands 1-4Hz, 8-13Hz and 13-30Hz.
0.4980±0.0003), suggesting that these two connectivity profiles were the most reproducible across subjects.
Thepattern-correlationvalues (as shown in Figure 3B) were then compared for MRVE correlation at fS = 75Hz
and beta band AEC. The sorted pattern-correlation val-ues for these frequencies are shown in Figure 3D. It ap-pears that MRVE correlation at fS = 75Hz gives
individ-ual profiles that are slightly more similar to the average connectivity profile than beta band AEC. The pattern-correlation values were then compared in a permutation test, where the group assignment was randomised between 75Hz MRVE and beta band AEC over 10,000 permuta-tions. However, it was found that there was no significant difference between thepattern-correlationvalues (p=0.344) for each connectivity measure.
3.1.3. Within-participant consistency between scales and frequency bands
It was then investigated whether thepattern-correlation coefficients calculated for each participant were related be-tween scale frequencies and frequency bands. For example, it would be interesting to determine whether those partic-ipants who exhibited high similarity to the mean connec-tivity profile for one frequency also exhibited high pattern-correlations for other frequencies. For each pair of scale frequencies and frequency bands, the correlation between the pattern-correlation z-scores was found across
partici-pants (with the participant order held constant, in con-trast with Figure 3B). The resulting Pearson correlation coefficients are shown in Figure 3E.
No negative correlations were found between any fre-quency pairings, within or between connectivity measures. This indicates that there are no frequencies for which a highpattern-correlationindicates that a participant is more likely to have a lowerpattern-correlation for another scale frequency or frequency band.
Strong positive correlations were found between the pattern-correlation vectors at a range of high MRVE scale frequencies, and also between low scale frequencies, with a crossover frequency of approximately 20Hz. This indicates that participants exhibiting highpattern-correlationat one high scale frequency are also likely to show high similarity to the mean connectivity profile for other scale frequencies above 20Hz. The same can be seen for scale frequencies below 20Hz. However, the pattern-correlations exhibited by each participant at high scale frequencies have no rela-tionship with their low scale frequencypattern-correlation coefficients.
For AEC, the strongest relationships between pattern-correlationvectors are found across the frequency bands in the gamma range (>40Hz). Positive relationships are also observed between pattern-correlation vectors correspond-ing to the lower frequency bands, the strongest of which is found between alpha and beta bandpattern-correlation.
Figure 3: Analysis of the robustness and inter-participant consistency of the connectivity measures given by AEC and MRVE correlation. A) Robustness to reducing the number of subjects included in the analysis as measured by bootstrapping. Plot shows the mean number of valid connections detected over 1000 sub-samples of sizeN, randomly sampled with replacement. Error bands show the standard deviation. B) Consistency across subjects found by correlating the vectorised z score connectivity matrices of individual subjects with the average connectivity pattern across all subjects. Colour plots show the resultantpattern-correlationcoefficients for each subject, sorted by correlation strength, for each MRVE scale frequency and AEC frequency band. AEC bands are represented by the frequency at the midpoint between the limits of the frequency range. C) These pattern-correlation coefficients over subjects were transformed to z scores and averaged for each scale frequency and frequency band. Error bands show the standard deviation over 1000 sub-samples ofN = 90. D) Sorted pattern-correlationcoefficients, calculated as in B) for MRVE scale frequencyfS= 75Hz and beta band AEC. E) Cross-correlation plot illustrating
the within-participant consistency inpattern-correlation coefficients between scales and frequency bands. For each pair of scale frequencies and frequency bands, the Pearson correlation between the pattern-correlation z-scores was found across participants. Grey indicates a non-significant relationship (α= 0.05, FDR corrected for multiple comparisons).
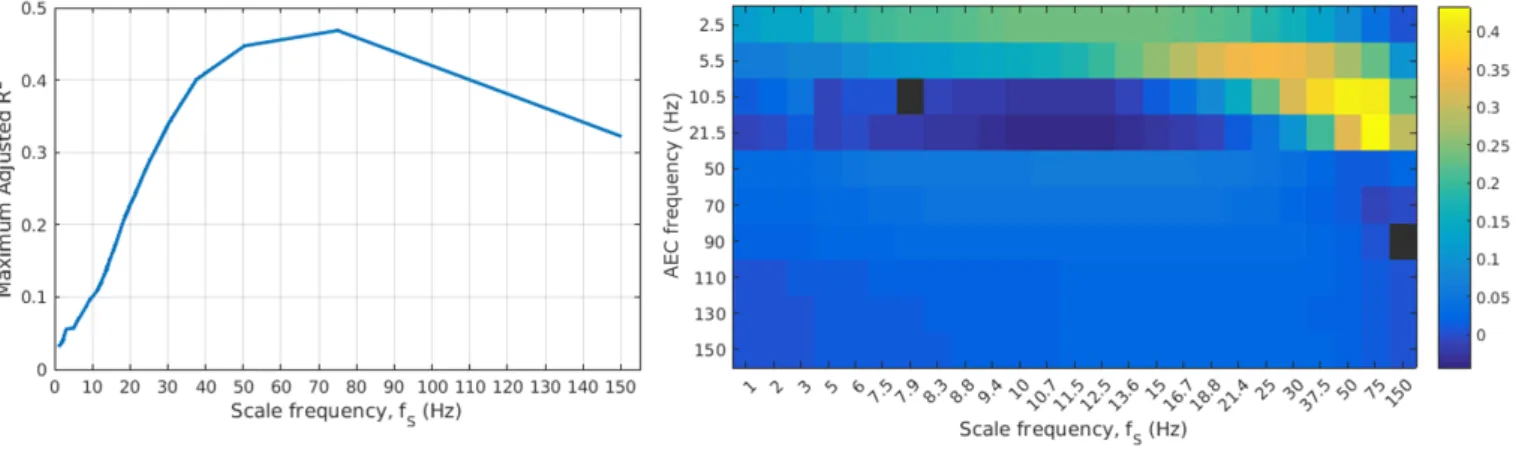
Figure 4: (left) The maximum adjusted R2 obtained across all possible multiple linear regression models for each scale frequency. (right)
Colour plot showing regression coefficients, where each column represents the coefficients obtained using MRVE correlation at the given scale frequency as the response variable. AEC bands are represented by the frequency at the midpoint between the limits of the frequency range. Black indicates that the corresponding AEC frequency was not included as a predictor variable in the optimal regression model (maximising adjusted R2).
As was observed for MRVE correlation, no relationships were found between the high and low frequency ranges.
Some relationships were also observed between the two connectivity measures. A strong positive correlation was observed between pattern-correlation vectors correspond-ing to high scale frequency MRVE correlation and alpha and beta band AEC. A weaker relationship was also found between the lower MRVE scale frequencies and delta band AEC. Interestingly, these relationships correspond to fre-quency pairings where high similarity was observed be-tween the average connectivity profiles, as seen in Figure 1. This suggests that there is high within-subject simi-larity between connectivity profiles calculated by MRVE correlation at fS =75Hz and AEC profiles in the alpha
and beta bands, in participants exhibiting high pattern-correlations for these frequencies.
3.2. Predicting MRVE connectivity from AEC connectivity The amount of variance in the MRVE correlation that could be explained by AEC was then calculated using a multiple regression model. The fraction of the variance in the MRVE connectivity that could be explained by AEC was calculated by vectorising the connectivity matrices and using the model in equation 4, whereirepresents each frequency band,Nfis the number of frequency bands used
in the model andxi represent the regression coefficients.
M RV E correlation∼1 +
Nf
X
i=1
xiAECi (4)
The adjusted R2 value found for each scale factor is shown in Figure 4. The adjusted R2value was used to
de-termine which combination of frequency bands would best explain the MRVE connectivity, as the highest adjusted R2
values are obtained when the model only includes predictor variables which add explained variance beyond that which
would be expected by chance. However, it was found that the highest adjusted R2 values for each scale frequency
were achieved when the AEC connectivity vectors from all frequency bands were incorporated in the model, except for fS = 7.9Hz when the alpha band was excluded, and
forfS = 150Hz when the 80-100Hz band was excluded.
3.3. Temporal correlation between MRVE and oscillatory amplitude envelopes
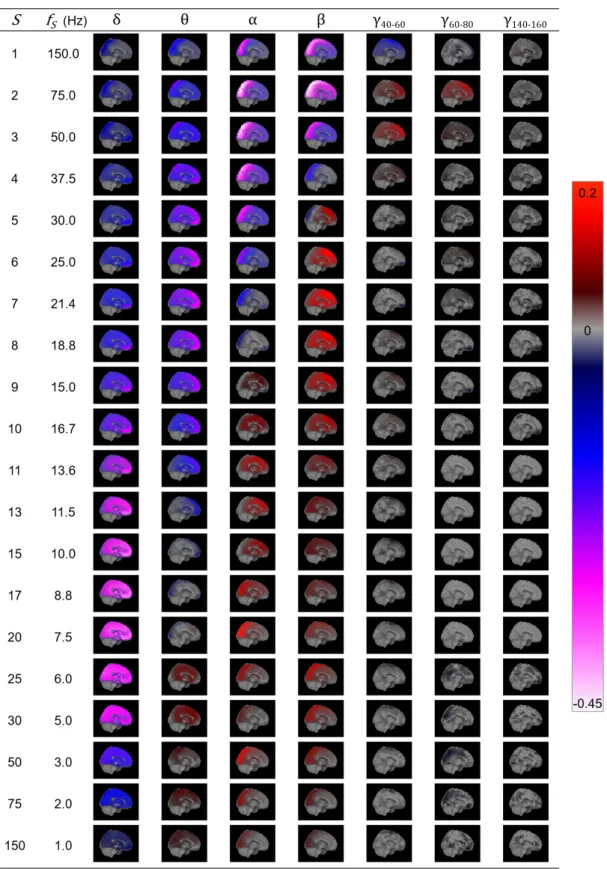
The relationship between entropy and oscillatory am-plitude was then investigated. At each voxel in the brain, the temporal correlation between MRVE timecourses and oscillatory amplitude envelopes was found across scale fre-quencies and frequency bands. Averagez-scores are shown on a template brain in Figure 5.
The relationship is shown to be dependent on the MRVE scale frequency and oscillatory frequency band. However, the direction is generally consistent across the brain for each combination. At high scale frequencies (fS =
50-150Hz), MRVE shows a strong negative correlation with power in the alpha and beta frequency bands, where the strongest relationship is seen between MRVE atfS= 75Hz
and beta band amplitude in the occipital and parietal re-gions. AtfS = 50-75Hz, a weak positive correlation with
gamma band amplitude is also observed, which is strongest in frontal and temporal regions. At mid to lower scale fre-quencies (fS = 1-25Hz), MRVE shows a negative
correla-tion with delta band amplitude but a positive correlacorrela-tion with power in the alpha and beta bands. However, the ar-eas in which the strongest positive correlation is observed varies with scale frequency and differs between the two frequency bands. The strongest positive correlation was observed between MRVE at fS = 21.4Hz and beta band
amplitude in frontal and temporal regions. However, pos-itive correlation was also observed in occipital and pari-etal regions between alpha and beta band amplitude and
Figure 5: The temporal correlation between MRVE timecourses and oscillatory amplitude envelopes for scale frequenciesfS= 1-150Hz and
frequency bands 1-4Hz (δ), 3-8Hz (θ), 8-13Hz (α), 13-30Hz (β), 40-60Hz (γ40−60), 60-80Hz (γ60−80) and 140-160Hz (γ140−160). The temporal
correlation coefficient was found at each voxel for each participant and transformed to a z-score by applying the Fisher transformation. The 95% confidence interval was found for thez-scores calculated across all participants for each voxel. Average Pearson correlation values were found at each voxel wherez= 0 lay outside of this confidence interval and displayed on a template brain as indicated by the colour bar. See supplementary material for whole brain correlation images for all scales and frequency bands.
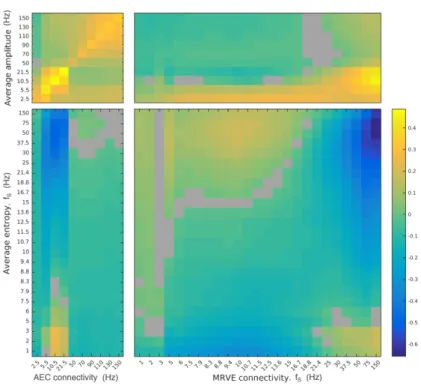
Figure 6: The correlation between average oscillatory amplitude/entropy and the overall connectivity strength at each voxel as measured by AEC and MRVE correlation. AEC bands are represented by the frequency at the midpoint between the limits of the frequency range. Warm colours indicate positive correlation whereas cooler colours show negative correlation and grey indicates a non-significant relationship (α= 0.05, FDR corrected for multiple comparisons).
MRVE for fS = 1-8.8Hz.
3.4. The relationship between MRVE magnitude, oscilla-tory amplitude and connectivity strength
The overall connectivity ‘strength’ was then estimated for each AAL region. This was done for each node by finding the sum of the correlation coefficients indicating the connectivity between that node and all other nodes, for each AEC frequency band and each MRVE correla-tion scale frequency. This gave one connectivity strength value for each AAL region for each participant, for each frequency band and scale frequency used. The average entropy value within each AAL region was then found at each scale frequency for each participant, by taking the av-erage value of the MRVE timecourses from the node voxel used in the connectivity analysis. Figure 6 shows the cor-relation between a vector containing all average entropy values across participants and the corresponding tivity strength values. The correlation between connec-tivity strength and average oscillatory amplitude was also found, taken as the mean value of the hilbert envelope for each frequency band.
At high scale frequencies, it was generally found that average variability negatively correlates with connectivity strength. The strongest relationship with MRVE correla-tion was found between average entropy at fS = 75Hz
and connectivity strength at fS = 150Hz (r = −0.66,
p <<0.001), whereas the strongest relationship with AEC was found between average entropy at fS = 50Hz and
al-pha band connectivity strength (r=−0.51,p <<0.001). However, a weaker positive correlation was found between average entropy at fine time scales and connectivity at coarser scales, where the strongest correlation was found between average entropy at fS = 50Hz and
connectiv-ity strength at fS = 10Hz (r = 0.18, p << 0.001). A
positive correlation is also seen between average entropy at very low scale frequencies (fS = 1-3Hz) and AEC in
the alpha and beta bands, as well as with MRVE corre-lation at the highest scale frequencies. This is strongest between average entropy atfS = 3Hz and alpha band AEC
(r = 0.26, p << 0.001), and between average entropy at
fS = 2Hz and MRVE correlation atfS = 150Hz (r= 0.18,
p <<0.001).
In contrast, there was generally a positive relation-ship between average oscillatory amplitude and connec-tivity strength. As shown in the top left of Figure 6, for AEC connectivity the strongest correlations were found when relating amplitude and connectivity strength within the same frequency band, where the strongest relationship was found for the beta band (r= 0.49,p <<0.001). Aver-age amplitude also generally showed a positive correlation with connectivity strength as measured by MRVE corre-lation at fine time scales, where the strongest recorre-lationship was found between alpha band amplitude and connectivity strength forfS = 150Hz (r= 0.46,p <<0.001).
Figure 7: A) Connections where the EOG standard deviation could explain a significant amount of variance in the connectivity strength across participants (p < 0.05). Red indicates a positive relationship and blue indicates a negative relationship. Asterisks mark connections that show a significant relationship after Bonferroni correction. The AEC frequency band or MRVE scale frequency is given in the top left corner of each plot. B) The number of connections showing a significant relationship. The number of connections exhibiting a positive relationship is given above thex-axis. The number showing a negative relationship are given below thex-axis. The plot above shows the number before correction for multiple comparisons. The plot below shows the number after Bonferroni correction.
3.5. Effects of eye movement on functional connectivity measurements
The frontal location of connections observed for low MRVE scale frequencies and for delta band AEC suggests that they could, at least partially, be spurious due to eye movement. We therefore analysed the EOG recorded with each scan to investigate whether this connectivity could be explained by eye movement artefacts. For each partic-ipant, their level of eye movement during the MEG scan was summarised as the standard deviation of the EOG timecourse measuring their horizontal eye movements. How-ever, there was a large difference in amplitude scaling be-tween the EOG for the first and second halves of the par-ticipant cohort, so the standard deviation values were then converted to Z scores separately for each half of the cohort. For each MRVE scale frequency and AEC frequency band, a linear regression model was used to determine whether a significant amount of variance in the connectivity strength measured across participants could be explained by hori-zontal eye movement for each valid connection. For low MRVE scale frequencies, a significant positive relation-ship was found between eye movement and connectivity strength for some frontal connections. For some of these connections, a significant relationship was still found after Bonferroni correction for multiple comparisons. This sug-gests, as hypothesised, that eye movement could be driving the frontal connectivity detected using MRVE correlation at these scale frequencies. However, no such relationship was found between eye movement and delta band AEC connectivity strength.
In contrast, for alpha and beta band AEC and for MRVE correlation at high scale frequencies (fS >30Hz)
a negative relationship was found between connectivity strength and eye movement for a number of occipital and parietal connections. This suggests that higher levels of eye movement are associated with reduced resting state connectivity in these regions. However, at these frequen-cies, no connections were found to exhibit a significant relationship after correction for multiple comparisons.
4. Discussion
The correlation of neural variability as measured by MRVE was used here to detect robust functional connec-tions from MEG recordings, suggesting that this is a viable method for the analysis of resting state connectivity. The existence of robust connections that can only be detected by MRVE correlation also suggests that this method can provide complementary information to that provided by AEC.
By introducing the multi-scale element to the RVE method, it was possible to observe network connections that were present at different temporal scales. The num-ber of valid connections detected and the brain areas they originated from varied with each scale frequency, although it was found that two general patterns of connectivity emerged.
At finer temporal scales (fS = 30-150Hz), the networks
revealed are dominated by occipital and parietal connec-tions, with some fronto-parietal and temporo-parietal con-nections. Connectivity in these regions during the resting state has been well established in the literature, in both fMRI (Lee et al., 2013) and MEG studies, where connec-tions in these areas have been found in the alpha and beta 11
frequency bands using oscillation-based connectivity mea-sures (Brookes et al., 2011; Hillebrand et al., 2012).
The relationship between MRVE at fine time scales and oscillatory amplitude in the alpha and beta frequency bands was a recurring feature throughout the analysis here. It was shown that the connectivity profiles revealed by fine-scale MRVE correlation and AEC in the alpha and beta bands showed high levels of similarity; the AEC within the alpha and beta frequency ranges made large contribu-tions to the explained variance in the MRVE correlation at fS = 75Hz, the scale at which most connections were
detected. It was also found that fine-scale variability time-courses exhibited a strong negative correlation with the al-pha and beta band amplitude envelopes, and that connec-tivity strength negatively correlates with average MRVE at this frequency while positively correlating with alpha and beta band amplitude. These findings imply that high levels of alpha and beta band AEC are associated with more regular activity at scale frequenciesfS = 30-150Hz.
It could be that the decrease in variability represents a reduction in information processing performed locally within areas showing high levels of inter-regional connec-tivity. Entropy is maximised when there is the least in-tegration between brain regions, while increased connec-tivity introduces statistical dependencies from acconnec-tivity in other brain areas and so decreases the ‘randomness’ exhib-ited by a region (Tononi et al., 1994).
These results are also potentially consistent with a com-putational model that recently showed that correlated am-plitude envelope fluctuations in the alpha and beta bands are driven by time-delayed coupling between oscillators in the gamma band (Cabral et al., 2014). It was found that transient synchronisation between these oscillators led to correlated amplitude fluctuations at a reduced collective frequency. Future work could investigate whether the cor-relation between entropy timecourses at high scale frequen-cies is driven by the degree of synchronisation between oscillators at the same natural frequencies.
At coarser temporal scales, a second network pattern emerged consisting of mostly frontal and temporal connec-tions that most closely resembled the AEC network found within the delta band. This similarity was again supported by the regression analysis, where the delta band AEC ex-plained the largest fraction of variance in the MRVE cor-relation for scale frequencies fS = 1-13.6Hz. The
over-all fraction of the variance that can be explained at these coarser time scales is relatively small, suggesting that MRVE correlation provides more novel information at these scales beyond that which can be observed using AEC.
However, the EOG regression analysis revealed that the MRVE correlation observed at these low scale frequencies may have been driven by artefactual signal components generated by eye movements. A fixation point was used to limit eye movements, but it was found that participants still exhibited horizontal eye movement during the record-ings, in agreement with previous resting state research (Fransson et al., 2014). Future work could repeat the
anal-ysis outlined here using data that has been cleaned of eye movement artefacts, for example using ICA, to determine whether these frontal connections are still observed. How-ever, it was also found that eye movement may affect the posterior connectivity detected by alpha and beta band AEC and MRVE correlation at high scale frequencies. Al-though no connections exhibited a significant negative re-lationship after the correction for multiple comparisons, there is evidence for a relationship between eye movement and resting state activity from several fMRI studies. It has been found that disrupted eye movement due to Parkin-son’s disease is associated with widespread resting state functional connectivity alterations (Gorges et al., 2013, 2016). It has also been found that areas within the default mode network show fluctuations in activity that correlate with spontaneous eye movement (Fransson et al., 2014). This could have implications for the study of functional connectivity in patient groups known to exhibit altered eye movements relative to controls, such as schizophrenia (Calkins et al., 2008). It is unclear how the removal of ocular signal components during data cleaning would af-fect the measurement of associated functional connectivity, and therefore the detection of alterations in patients.
Investigating the entropic characteristics of the EOG was beyond the scope of this study. However, MRVE cor-relation strength at coarse time scales was found to ex-hibit weak positive correlations with average entropy at fine scales and with delta band amplitude. A weak neg-ative correlation can also be seen with variability at the coarsest time scales. This suggests that ocular activity may be more regular at coarse time scales but show higher variability at finer scales. While no relationship was found between delta band AEC and eye movement during the EOG regression analysis, this also hints at an association between eye movement levels and delta band amplitude.
It is interesting to note that MRVE correlation, for a given scale frequency, does not provide the same informa-tion about funcinforma-tional connectivity as AEC for an overlap-ping frequency band. For example, while the frequency band that shows the most connections using AEC ranges from 13-30Hz, scale frequencies in this range are associ-ated with a trough in the number of connections when using MRVE correlation. In fact, Figure 4 shows that for each frequency band, AEC explains a low percentage of the variance in the MRVE correlation at scale frequencies in the same range. This suggests that in regions showing high connectivity strength, the amplitude and variability of activity of a particular frequency are not related.
MRVE was shown to have a complex relationship with oscillatory amplitude. In general, a positive correlation was found between oscillatory amplitude and entropy time-courses calculated within the same frequency range, whereas a negative correlation is seen when the MRVE scale fre-quency is approximately higher than the lowpass frefre-quency of the oscillatory frequency band. At the finest time scales, this is seen as a biphasic relationship where MRVE shows negative correlation with low frequency amplitude but
pos-itive correlation with gamma band amplitude. This has been found previously in a study using RVE at a sin-gle time scale, when applied to task data (fS = 150Hz)
(Brookes et al., 2015). Here, the relationship was repli-cated in resting state data and was found to be consistent in direction across the brain. However, by considering mul-tiple time scales using MRVE, it was found that the cor-relation between entropy and amplitude envelopes varies with the entropy scale frequency.
While the direction of each relationship was found to be generally consistent across the brain, the strength of the relationships were often found to vary spatially. For a number of combinations, the correlation was found to be strongest either in occipital and parietal regions, where most functional connections were detected, or in frontal and temporal regions. For example, the negative corre-lation between beta band amplitude and MRVE at fine scales is strongest in more posterior regions. In contrast, the positive correlation observed for fS values within the
beta frequency range is strongest in anterior regions. This could imply that regional connectivity strength moderates the relationship between the variability and oscillatory am-plitude of neural activity within that region. Future work could look at whether the same phenomenon is observed during a task, during which different regions would show higher connectivity strength.
Connectivity strength was generally found to positively correlate with oscillatory amplitude, in agreement with previous research (Tewarie et al., 2019), but was found to negatively correlate with variability. This is consistent with the prevailing theory that oscillatory activity (which is highly regular) facilitates synchronisation between corti-cal regions (Schnitzler and Gross, 2005; Fries, 2005; Cabral et al., 2014). The relationship between connectivity and oscillatory amplitude is often confounded by the fact that an increase in amplitude is associated with an increase in SNR. However, it is unlikely that this would be caus-ing the observed relationship with variability. If the low measured entropy was driven by increases in underlying signal strength, we would expect to detect connections in the gamma band using AEC that match those found by MRVE correlation for scale frequencies in the same range, whereas in reality very few connections are seen using AEC at these high frequencies.
4.1. Limitations
One limitation of this study is that the performance of MRVE correlation was only compared to AEC. AEC was chosen for comparison as it has been shown to give the most consistent results across participants (Colclough et al., 2016). This method was therefore the appropriate benchmark to use in a comparison of the number of robust connections detected by each connectivity measure. How-ever, it could also be interesting to look at how MRVE correlation relates to connectivity measured by techniques that are centred around phase relationships. It has been suggested that the reduction of signal variability facilitates
phase relationships to occur between brain regions (Mc-donough et al., 2014) so it could be investigated whether there is similarity between the connections each method can detect and how this would differ from the relationship between MRVE correlation and AEC.
Another constraint on this analysis was the limit on the resolution of scale frequencies that could be used to generate MRVE timecourses. By increasing the sample rate of the data acquisition, it would be possible to ob-tain MRVE timecourses at finer temporal scales, and at more frequencies within the frequency range investigated here. For example, with a lowpass frequency of 300Hz, MRVE timecourses could be calculated for all frequencies considered here, as well as for fS = 300Hz, 100Hz, 60Hz
etc. While most of the functional connectivity informa-tion given by AEC was found at frequencies below 30Hz, valid connections were detected using MRVE correlation across the whole bandwidth of the MEG signals. Both the frontal and posterior patterns of connectivity detected by MRVE correlation were observed across a wider range of frequencies than their AEC analogues. It is unclear why this is the case. However, this suggests that by increasing the sample rate of the MEG recordings, it may be possible to observe robust connectivity using MRVE correlation at scale frequencies beyond the range available here. In fu-ture work, the sample rate and scale factors could also be selected to target specific frequencies of interest.
Leakage correction has shown to be important for mea-suring reliable AEC (Colclough et al., 2016) and was per-formed here using symmetric multivariate orthogonalisa-tion. This method has been shown to minimise spurious correlation between virtual sensor timecourses (Colclough et al., 2015). However, the performance of any leakage correction method is dependent on the choice of the time-courses to represents each AAL region. In this study, the voxel corresponding to the timecourse with the maximum temporal standard deviation was chosen as an estimate of the voxel exhibiting the largest SNR. This method could lead to voxels selected from adjacent AAL parcels being in close proximity to each other, and therefore the cor-responding current time-courses at these locations could show real correlation (beyond spurious correlation due to source leakage). Any signal orthogonalisation method, in-cluding the one used here, would result in signal cancella-tion in the case of being presented with signals with such zero-lag correlation (Colclough et al., 2015). However, it is worth noting that even if signal components with zero-lag correlation are suppressed, it is still possible to observe cor-relation between the amplitude envelopes and the MRVE of signals with a relative phase difference.
While the issue of voxels selected in close proximity would affect AEC and MRVE correlation measurements equally, another limitation of this leakage correction method is that a bias towards signals with high SNR may led to missing important information about entropy. For AEC, maximising SNR may be desirable as oscillatory amplitude has been shown to correlate with functional connectivity 13
(Tewarie et al., 2019). Whereas the MRVE of a signal is independent of its amplitude. Selecting only signals with high amplitude may increase the chances of selecting those with low entropy, as larger groups of synchronised neurons are capable of generating MEG signals with higher ampli-tude. This could have lead to increased similarity between MRVE correlation networks and those found using AEC. It may be interesting to employ an alternative voxel se-lection method, that selects voxels on a basis other than SNR, to investigate how this alters the measured MRVE correlation. For example, timecourses could be taken from voxels at the centre of each AAL region.
It is well established that neuronal variability varies with age (Mcintosh et al., 2008; Lipp´e et al., 2009; McIn-tosh et al., 2014; Vakorin et al., 2011). Functional network activity has also been found to vary over the lifespan, in-creasing during development (Sch¨afer et al., 2014; Brookes et al., 2018), and then being disrupted in healthy aging (Andrews-hanna et al., 2007; Vakorin et al., 2011; Schlee et al., 2012). It may be beneficial to investigate the effects of age on MRVE correlation connectivity profiles, to deter-mine whether they remain consistent between age groups. However, the age distribution of the cohort used here was skewed towards younger participants, where almost 70% of participants (126/183) were in the 18-25 age range. This limited our ability to assess the effects of age on the results presented here. In addition, resting state functional con-nectivity has previously been shown to differ between the sexes (Weis et al., 2019). However, the participant cohort used here was mostly female (123/183). It is possible that connectivity profiles given by both measures may be less robust when applied to a cohort with more even distribu-tions of age and sex. Although, one MEG study found that resting state power envelope correlation connectomes did not significantly alter with age (Coquelet et al., 2017). Future work could recruit a cohort with more balanced distributions of age and sex to investigate their effects on the reliability of these connectivity measures.
While it is interesting that MRVE correlation has shown promise as a measure of functional connectivity, the true test of its usefulness will be its performance in patient groups. Neural variability measures such as Multi-scale Entropy (MSE) (Costa et al., 2005; Mizuno et al., 2010; Bosl et al., 2011; Ghanbari et al., 2015), and AEC connec-tivity (Andreou et al., 2015; Koelewijn et al., 2015, 2019; Dima et al., 2020) have both been shown to be able to distinguish patient groups from controls. Future work will investigate whether MRVE correlation can provide under-standing about connectivity changes associated with dis-ease, in comparison to conventional measures based on the oscillatory components of brain function.
5. Acknowledgements
This research was supported by CUBRIC and the School of Psychology at Cardiff University, the UK MEG
Partner-ship Grant (MRC/EPSRC, MR/K005464/1) and EPSRC studentship funding to Godfrey.
References
Andreou, C., Nolte, G., Leicht, G., Polomac, N., Hanganu-opatz, I. L., Lambert, M., Engel, A. K., and Mulert, C. (2015). Increased Resting-State Gamma-Band Connectivity in First-Episode Schizophrenia.Schizophrenia Bulletin, 41(4):930–939. Andrews-hanna, J. R., Snyder, A. Z., Vincent, J. L., Lustig, C.,
Head, D., Raichle, M. E., and Buckner, R. L. (2007). Disrup-tion of Large-Scale Brain Systems in Advanced Aging. Neuron, 56(5):924–935.
Baker, A. P., Brookes, M. J., Rezek, I. A., Smith, S. M., Behrens, T., Smith, P. J. P., and Woolrich, M. (2014). Fast transient networks in spontaneous human brain activity.eLife, 3:1–18.
Boon, L. I., Hillebrand, A., Olde Dubbelink, K. T. E., Stam, C. J., and Berendse, H. W. (2017). Changes in resting-state directed connectivity in cortico-subcortical networks correlate with cog-nitive function in Parkinson’s disease. Clinical Neurophysiology, 128:1319–1326.
Bosl, W., Tierney, A., Tager-flusberg, H., and Nelson, C. (2011). EEG complexity as a biomarker for autism spectrum disorder risk.
BMC Medicine, 9(18):1–16.
Brookes, M. J., Groom, M. J., Liuzzi, L., Hill, R. M., Smith, H. J. F., Briley, P. M., Hall, E. L., Hunt, B. A. E., Gascoyne, L. E., Taylor, M. J., Liddle, P. F., Morris, P. G., Woolrich, M. W., and Liddle, E. B. (2018). Altered temporal stability in dynamic neu-ral networks underlies connectivity changes in neurodevelopment.
NeuroImage, 174:563–575.
Brookes, M. J., Hall, E. L., Robson, S. E., Price, D., Palaniyappan, L., Liddle, E. B., Liddle, P. F., Robinson, S. E., and Morris, P. G. (2015). Complexity Measures in Magnetoencephalography: Measuring ”Disorder” in Schizophrenia.Plos One, 10(4). Brookes, M. J., Tewarie, P. K., Hunt, B. A. E., Robson, S. E.,
Gas-coyne, L. E., Liddle, E. B., Liddle, P. F., and Morris, P. G. (2016). A multi-layer network approach to MEG connectivity analysis.
NeuroImage, 132:425–438.
Brookes, M. J., Woolrich, M., Luckhoo, H., Price, D., Hale, J. R., Stephenson, M. C., Barnes, G. R., Smith, S. M., and Morris, P. G. (2011). Investigating the electrophysiological basis of resting state networks using magnetoencephalography. PNAS, 108(40):16783– 16788.
Cabral, J., Luckhoo, H., Woolrich, M., Joensson, M., Mohseni, H., Baker, A., Kringelbach, M. L., and Deco, G. (2014). Explor-ing mechanisms of spontaneous functional connectivity in MEG: How delayed network interactions lead to structured amplitude envelopes of band-pass filtered oscillations. NeuroImage, 90:423– 435.
Calkins, M. E., Iacono, W. G., and Ones, D. S. (2008). Eye Movement Dysfunction in First-Degree Relatives of Patients with Schizophrenia: A Meta-analytic Evaluation of Candidate En-dophenotypes. Brain Cogn., 68(3):436–461.
Colclough, G. L., Brookes, M. J., Smith, S. M., and Woolrich, M. W. (2015). A symmetric multivariate leakage correction for MEG connectomes. NeuroImage, 117.
Colclough, G. L., Woolrich, M. W., Tewarie, P. K., Brookes, M. J., Quinn, A. J., and Smith, S. M. (2016). How reliable are MEG resting-state connectivity metrics? NeuroImage, 138:284–293. Coquelet, N., Mary, A., Peigneux, P., Goldman, S., Wens, V., and
Ti`ege, X. D. (2017). The electrophysiological connectome is main-tained in healthy elders: a power envelope correlation MEG study.
Scientific Reports, 7(13984):1–10.
Costa, M., Goldberger, A. L., and Peng, C. K. (2005). Multiscale entropy analysis of biological signals.Physical Review E - Statis-tical, Nonlinear, and Soft Matter Physics, 71(2):1–18.
Courtiol, J., Perdikis, D., Petkoski, S., M¨uller, V., Huys, R., Sleimen-Malkoun, R., and Jirsa, V. K. (2016). The multiscale entropy: Guidelines for use and interpretation in brain signal analysis.
Deco, G., Jirsa, V. K., and McIntosh, A. R. (2011). Emerging con-cepts for the dynamical organization of resting-state activity in the brain. Nature Reviews Neuroscience, 12(1):43–56.
Dima, D. C., Adams, R., Linden, S. C., Baird, A., Smith, J., Fo-ley, S., Perry, G., RoutFo-ley, B. C., Magazzini, L., Drakesmith, M., Williams, N., Doherty, J., van den Bree, M. B. M., Owen, M. J., Hall, J., Linden, D. E. J., and Singh, K. D. (2020). Electrophysi-ological network alterations in adults with copy number variants associated with high neurodevelopmental risk. Translational Psy-chiatry, 10(324).
Donner, T. H. and Siegel, M. (2011). A framework for local cortical oscillation patterns.Trends in Cognitive Sciences, 15(5):191–199. Engels, M. M. A., Yu, M., Stam, C. J., Gouw, A. A., van der Flier, W. M., Scheltens, P., van Straaten, E. C. W., and Hillebrand, A. (2017). Directional information flow in patients with Alzheimer’s disease. A source-space resting-state MEG study. NeuroImage, 15:673–681.
Fern´andez, A., G´omez, C., Hornero, R., and L´opez-ibor, J. J. (2013). Complexity and schizophrenia. Progress in Neuropsychopharma-cology & Biological Psychiatry, 45:267–276.
Fonov, V. S., Evans, A. C., McKinstry, R. C., Almli, C. R., and Collins, D. L. (2009). Unbiased nonlinear average age-appropriate brain templates from birth to adulthood. NeuroImage, 47:S102. Fransson, P., Flodin, P., ¨Oqvist Seimyr, G., and Pansell, T. (2014).
Slow fluctuations in eye position and resting-state functional mag-netic resonance imaging brain activity during visual fixation. Cog-nitive neuroscience, 40:3828–3835.
Fries, P. (2005). A mechanism for cognitive dynamics: neuronal communication through neuronal coherence. Trends in Cognitive Sciences, 9(10):474–480.
Friston, K. J., Tononi, G., and Edelman, G. M. (1996). Charac-terising the Complexity of Neuronal Interactions. Human brain mapping, 314(1995):302–314.
Garrett, D. D., Samanez-Larkin, G. R., MacDonald, S. W. S., Lin-denberger, U., McIntosh, A. R., and Grady, C. L. (2013). Moment-to-moment brain signal variability: A next frontier in human brain mapping? Neuroscience and Biobehavioral Reviews, 37:610–624. Ghanbari, Y., Bloy, L., Edgar, J. C., Blaskey, L., Verma, R., and
Roberts, T. P. L. (2015). Joint Analysis of Band-Specific Func-tional Connectivity and Signal Complexity in Autism. J Autism Dev Disord., 45(2):444–460.
Gorges, M., M¨uller, H. P., Lul´e, D., LANDSCAPE Consortium, Pinkhardt, E. H., Ludolph, A. C., and Kassubek, J. (2016). The association between alterations of eye movement control and cere-bral intrinsic functional connectivity in Parkinson’s disease.Brain Imaging and Behavior, 10:79–91.
Gorges, M., M¨uller, H.-P., Lul´e, D., Ludolph, A. C., Pinkhardt, E. H., and Kassubek, J. (2013). Functional Connectivity Within the Default Mode Network Is Associated With Saccadic Accuracy in Parkinson’s Disease: A Resting-State fMRI and Videooculo-graphic Study. Brain connectivity, 3(3):265–272.
Hamandi, K., Routley, B. C., Koelewijn, L., and Singh, K. D. (2016). Non-invasive brain mapping in epilepsy : Applications from mag-netoencephalography.Journal of Neuroscience Methods, 260:283– 291.
Hillebrand, A., Barnes, G. R., Bosboom, J. L., Berendse, H. W., and Stam, C. J. (2012). Frequency-dependent functional connectivity within resting-state networks: An atlas-based MEG beamformer solution. Neuroimage, 59(4):3909–3921.
Hipp, J. F., Hawellek, D. J., Corbetta, M., Siegel, M., and Engel, A. K. (2013). Large-scale cortical correlation structure of sponta-neous oscillatory activity. Nat Neurosci, 15(6).
Huang, M. X., Mosher, J. C., and Leahy, R. M. (1999). A sensor-weighted overlapping-sphere head model and exhaustive head model comparison for MEG. Physics in medicine and biology, 44:423–440.
Koelewijn, L., Hamandi, K., Brindley, L. M., Brookes, M. J., Rout-ley, B. C., Muthukumaraswamy, S. D., Williams, N., Thomas, M. A., Kirby, A., te Water Naud´e, J., Gibbon, F., and Singh, K. D. (2015). Resting-state oscillatory dynamics in sensorimotor cortex in benign epilepsy with centro-temporal spikes and typical
brain development. Human Brain Mapping, 36:3935–3949. Koelewijn, L., Lancaster, T. M., Linden, D. E. J., Dima, D. C.,
Bethany, C., Magazzini, L., Barawi, K., Brindley, L., Adams, R., Tansey, K. E., Bompas, A., Tales, A., Bayer, A., and Singh, K. (2019). Oscillatory hyperactivity and hyperconnectivity in young APOE -epsilon4 carriers and hypoconnectivity in Alzheimer’s dis-ease. eLife, 30(8).
Lee, M. H., Smyser, C. D., and Shimony, J. S. (2013). Resting state fMRI: A review of methods and clinical applications. American Journal of Neuroradiology, 34(10):1866–1872.
Lipp´e, S., Kovacevic, N., and Mcintosh, A. R. (2009). Differential maturation of brain signal complexity in the human auditory and visual system.Frontiers in human neuroscience, 3(48):1–9. Liuzzi, L., Gascoyne, L. E., Tewarie, P. K., Barratt, E. L., Boto,
E., and Brookes, M. J. (2017). Optimising experimental design for MEG resting state functional connectivity measurement. Neu-roImage, 155:565–576.
Mateos, D. M., Guevara Erra, R., Wennberg, R., and Perez Ve-lazquez, J. L. (2018). Measures of entropy and complexity in altered states of consciousness. Cognitive Neurodynamics, 12:73– 84.
Mcdonough, I. M., Nashiro, K., Gorgolewski, K., and Planck, M. (2014). Network complexity as a measure of information process-ing across restprocess-ing-state networks: evidence from the Human Con-nectome Project.Frontiers in human neuroscience, 8(June):1–15. Mcintosh, A. R., Kovacevic, N., and Itier, R. J. (2008). Increased Brain Signal Variability Accompanies Lower Behavioral Variabil-ity in Development.PLoS Computational Biology, 4(7).
McIntosh, A. R., Vakorin, V., Kovacevic, N., Wang, H., Diaconescu, A., and Protzner, A. B. (2014). Spatiotemporal dependency of age-related changes in brain signal variability. Cerebral Cortex, 24(7):1806–1817.
Miˇsi´c, B., Vakorin, V. A., Paus, T., and McIntosh, A. R. (2011). Functional embedding predicts the variability of neural activity.
Frontiers in Systems Neuroscience, 5:1–6.
Mizuno, T., Takahashi, T., Cho, R. Y., Kikuchi, M., Murata, T., Takahashi, K., and Wada, Y. (2010). Assessment of EEG dynam-ical complexity in Alzheimer’s disease using multiscale entropy.
Clinical Neurophysiology, 121(9):1438–1446.
Monge, J., G´omez, C., Poza, J., Fern´andez, A., Quintero, J., and Hornero, R. (2015). MEG analysis of neural dynamics in attention-deficit/hyperactivity disorder with fuzzy entropy. Med-ical Engineering and Physics, 37:416–423.
O’Neill, G. C., Tewarie, P., Vidaurre, D., Liuzzi, L., Woolrich, M. W., and Brookes, M. J. (2017). Dynamics of large-scale elec-trophysiological networks: A technical review.NeuroImage. Oostenveld, R., Fries, P., Maris, E., and Schoffelen, J.-M. (2011).
FieldTrip: Open source software for advanced analysis of MEG, EEG, and invasive electrophysiological data. Computational in-telligence and neuroscience, 2011:1–9.
Protzner, A. B., Valiante, T. A., Kovacevic, N., McCormick, C., and McAndrews, M. P. (2010). Hippocampal signal complexity in mesial temporal lobe epilepsy: A noisy brain is a healthy brain.
Archives Italiennes de Biologie, 148(3):289–297.
Robinson, S. E., Mandell, A. J., Coppola, R., Robinson, P., Er-mentrout, G. B., and Herrmann, J. M. (2013). Spatiotemporal imaging of complexity.Frontiers in Computational Neuroscience, 6:101–114.
Sch¨afer, C. B., Morgan, B. R., Ye, A. X., Taylor, M. J., and Does-burg, S. M. (2014). Oscillations, Networks, and Their Develop-ment: MEG Connectivity Changes with Age.Human Brain Map-ping, 35:5249–5261.
Schlee, W., Leirer, V., Kolassa, I.-t., Weisz, N., and Elbert, T. (2012). Age-related changes in neural functional connectivity and its behavioral relevance. BMC Neuroscience, 13(16):1–11. Schnitzler, A. and Gross, J. (2005). Normal and pathological
oscilla-tory communication in the brain. Nature Reviews Neuroscience, 6:285–296.
Shannon, C. E. (1948). A mathematical theory of communication.
Bell System Technical Journal, 27:379–423.
Takahashi, T. (2013). Complexity of spontaneous brain activity in 15
mental disorders.Progress in Neuro-Psychopharmacology and Bi-ological Psychiatry, 45:258–266.
Tewarie, P., Hunt, B. A. E., Neill, G. C. O., Byrne, A., Aquino, K., Bauer, M., Mullinger, K. J., Coombes, S., and Brookes, M. J. (2019). Relationships Between Neuronal Oscillatory Amplitude and Dynamic Functional Connectivity.Cerebral Cortex, 29:2668– 2681.
Tononi, G., Sporns, O., and Edelman, G. M. (1994). A measure for brain complexity: Relating functional segregation and integration in the nervous system. Neurobiology, 91:5033–5037.
Tzourio-Mazoyer, N., Landeau, B., Papathanassiou, D., Crivello, F., Etard, O., Delcroix, N., Mazoyer, B., and Joliot, M. (2002). Auto-mated Anatomical Labeling of Activations in SPM Using a Macro-scopic Anatomical Parcellation of the MNI MRI Single-Subject Brain. NeuroImage, 15:273–289.
Vakorin, V. A., Lippe, S., and McIntosh, A. R. (2011). Variabil-ity of Brain Signals Processed Locally Transforms into Higher Connectivity with Brain Development. Journal of Neuroscience, 31(17):6405–6413.
Van Dellen, E., Douw, L., Hillebrand, A., de Witt Hamer, P. C., Baayen, J. C., Heimans, J. J., Reijneveld, J. C., and Stam, C. J. (2014). Epilepsy surgery outcome and functional network alter-ations in longitudinal MEG: A minimum spanning tree analysis.
NeuroImage, 86:354–363.
Van Veen, B. D., Van Drongelen, W., Yuchtman, M., and Suzuki, A. (1997). Localization of Brain Electrical Activity via Linearly Constrained Minimum Variance Spatial Filtering.IEEE TRANS-ACTIONS ON BIOMEDICAL ENGINEERING, 44(9). Vrba, J. and Robinson, S. E. (2001). Signal Processing in
Magne-toencephalography. Methods, 25(2):249–271.
Wang, D. J., Jann, K., Fan, C., Qiao, Y., Zang, Y. F., Lu, H., and Yang, Y. (2018). Neurophysiological basis of multi-scale entropy of brain complexity and its relationship with functional connectivity.
Frontiers in Neuroscience, 12:1–14.
Weis, S., Hodgetts, S., and Hausmann, M. (2019). Sex differences and menstrual cycle effects in cognitive and sensory resting state networks. Brain and cognition, 131:66–73.
Wens, V., Bourguignon, M., Goldman, S., Marty, B., de Beeck, M. O., Clumeck, C., Mary, A., Peigneux, P., Van Bogaert, P., Brookes, M. J., and De Tiege, X. (2014). Inter- and Intra-Subject Variability of Neuromagnetic Resting State Networks. Brain To-pography, 27:620–634.