Corresponding author: [email protected]
Aspects regarding the realization of the triple point of Ar
Cosmin Dinu1, Dumitru Marius Neagu21The Romanian Bureau of Legal Metrology-National Institute of Metrology (BRML-INM), 11 Vitan Bârzeşti, 042 122, Bucharest, Romania 2
The Romanian Bureau of Legal Metrology-National Institute of Metrology (BRML-INM), 11 Vitan Bârzeşti, 042 122, Bucharest, Romania
Résumé. Cet article présente un ensemble de résultats obtenus à partir de mesures effectuées avec des thermomètres étalons à résistance de platine (TERP) au point triple de l'Ar. Ces thermomètres sont utilisés au Bureau Roumain de Métrologie Légale (Institut National de Métrologie) comme un moyen d'interpolation pour la matérialisation de l'Echelle Internationale de Température 1990 ITS-90. En outre, certains aspects et questions relatives à la réalisation du point triple de l'argon au sein du BRML-INM sont présentés. Certaines améliorations récentes de ce point triple se révèlent très pratiques pour le processus de réalisation. Neuf plateaux ont été étudiés, principalement en fonction de leur durée et de leur stabilité. Deux techniques pour le calcul des valeurs attribuées aux plateaux ont été utilisées et comparées : le milieu des plateaux (MP) et le point d'inflexion de la fonction de régression polynomiale du troisième degré (IP).
1 Introduction
Measurements and their results play an increasingly important role in society [1] being necessary to build and consolidate the confidence in them. The Romanian Bureau of Legal Metrology – National Institute of Metrology (BRML-INM) provides traceability for the measurements performed in the temperature field in Romania. The Romanian Temperature National Measurement Standard materializes, at BRML-INM, the International Temperature Scale of 1990 (ITS-90) [2] and covers the temperature interval from 83.8058 K (the triple point of argon) up to 933.473 K (the freezing point of aluminium).
According to ITS-90, the practical realization of the International Kelvin Temperature - T90 implies the calibration of the interpolation instrument (SPRT) at the defining fixed points.
2 Materialization of the triple point of
argon at BRML-INM
The triple point of Ar is realized in BRML-INM by the constant flux method. An apparatus based on the Bonnier model [3] was manufactured at INM in 2001 [4] and improved in 2014. To start the triple point experiment, liquid nitrogen is introduced in the bath (the Dewar vessel – figure 1). As the boiling temperature of the nitrogen (77 K) is lower than the temperature of the triple point of argon, the liquid nitrogen is used as cooling environment for the triple point of Ar materialization.
Three sensors were installed on the cover of Dewar vessel at 3 different immersion depths. The lower sensor (sensor 1, figure 2) was installed at the level of the argon cell’s lower side (cell’s tail). The temperature monitoring
inside the Dewar vessel is achieved by these sensors
(Pt100 PRTs). In the first part of the triple point of argon realization processthe liquid nitrogen’s level must not go over the cell tail’s level. The liquid level is difficult to determine and to maintain being not visible because the Dewar vessel is closed during the process. In this step using the sensors inserted in the Dewar, the liquid nitrogen’ level is kept constant in this way: when the sensor at the highest immersion depth (sensor 1, see figure 2) indicates the minimum temperature value of -195,5 °C (liquid nitrogen temperature) no more liquid nitrogen must be added into the Dewar vessel, when the PRT indicates a higher temperature value extra liquid nitrogen must be added to compensate the quantity lost caused by vaporization.
In order to realize the triple point of Ar, after the reading of the SPRT under calibration decreases until it reaches the temperature of the liquid nitrogen, the Dewar is filled with liquid nitrogen and closed.
After filling the cryostat (Dewar vessel) with liquid nitrogen and closing the valve, the nitrogen vapor overpressure must be controlled and measured throughout the experiment. Maintaining this quantity at a constant value of 1.1 bar was achieved automatically by a construction which has a pressure regulator as essential component (figure 3). This allows the liquid nitrogen (LN2) temperature control.
This regulator is not installed directly on the triple point of argon systembecause the nitrogen vapor (in the cryostat) temperature is too low for the pressure sensor of this construction. So, the vapors on the output of the system are heated to 40 °C before they enter the regulator by a water bath (no. 1 – figure 3). The regulator consists of a pressure sensor that is connected to a controller that commands an electro-valve ("open / closed").
DOI: 10.1051/
C
Owned by the authors, published by EDP Sciences, 2015 2015
metrology/
17 International Congress of Metrology, 1 0th (20 51 ) 1 0 5 5 1 1 1 1
This is an Open Access article distributed under the terms of the Creative Commons Attribution License 4.0, which permits unrestricted use,
4 4
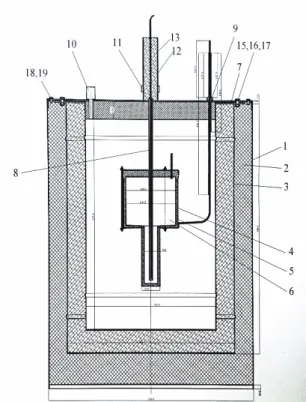
Figure 1. Apparatus / Construction used for the materialization of the triple point if argon at BRML-INM; 1.Metal casing; 2.Thermal insulator; 3.Dewar metallic vessel; 5. Cell shield; 6.Argon cell; 8.Support tube (where the SPRT is inserted) 9.Temperature sensors (3 Pt100 PRTs placed at three different heights); 10.Tube used for the evacuation of the liquid nitrogen vapors; 13.Gas Helium
Figure 2. Fixed point cell used for the materialization of the triple point if argon at BRML-INM; 1.Cell upper chamber; 2.Cell lower chamber (tail); 3.Sensor 2 - middle temperature sensor; 4. Sensor 1 - lower temperature sensor; 5. Liquid nitrogen level during the triple point if argon plateaus
Figure 3. The adjustment of the liquid nitrogen vapours pressure; 1. Water bath used for heating the liquid nitrogen vapours; 2. Pressure sensor; 3. controller; 4. Electro valve
3 Aspects regarding the SPRT
calibration
The construction/apparatus presented in figures 1, 2 and 3 is operated in order to calibrate SPRT at this defining ITS-90 fixed point. This implies the materialization of the fixed point (which has a known assigned value) and the assigning of a plateau value to the SPRT under calibration, together with the uncertainty of measurement. The theoretical plateau temperature is 83,8058 K.
From the measured values recorded for between 10 and 15 (it differs for each plateau) hours only the plateau region has been selected for the present paper. The measured values with the monitoring sensors (see figure 2) and with the SPRT under calibration (inserted in the fixed point cell) “outside” the plateau are recorded and saved for the optimization of the steps necessary to obtain the plateau and are not subject of the present paper.
The plateau numbering is detailed in table 1.
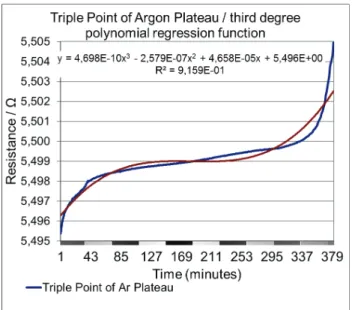
Figure 4 presents the measured resistance values during one triple point of argon plateau (plateau no. 4 see table 1) with SPRT no. 2580. This is an example to show how the values have been interpreted for the realized plateaus presented in table 1 and 2. The SPRT used has a sensivity coefficient 0,1 Ω/˚C.
For the plateau region that has been selected, a third degree polynomial regression function (with the coefficient presented over the two graphs in figure 4) has been created. The regression function is useful because it provides, in this case, a value that can be assigned to the plateau. The measured resistance assigned values (two for each plateau – see table 2) are MP (middle of the plateau) and IP (inflection point of the third degree polynomial regression function).
Figure 4. Triple point of argon plateau/ third degree polynomial regression function for plateau no. 4 (see table 1)
Figure 5 shows on the left axis the duration of each plateau in the most stable region. The duration of the realized plateaus is mostly between 2 and 5 hours. On the left axis the slope calculated for the first 15 minutes of the plateau is presented. Plateaus 3, 5 and 6 have the lowest slopes (less than 0.03 mK/min) and plateau 7 has the highest slope (0.265 mK/min). The plateau duration, slope and the difference between the lowest and highest
measured resistance values (presented in table 2, column 6) are studied to determine the quality and stability of the plateaus.
Figure 5. Plateau duration (left axis) and slope (right axis) In figure 6, the difference between MP and IP (left axis), gives a way to estimate the accuracy of the assigned value, MP and IP being 2 different assigned values obtained with different methods. In most of the cases the MP values are higher than IP values. The lowest absolute value difference is 0.02 mK, calculated for plateau no. 1. Plateau no. 3 and 4 indicate low absolute value differences as well: 0.21 mK and 0.24 mK.
The coefficient of determination R2 (right axis) is calculated to estimate how well the plateaus can be estimated with a third degree polynomial regression function and in order to see if there is a correlation
results in figure 6 are shown in table 2 as well. Plateaus 1, 4 and 9 provide high R2 values (higher than 0.92, close to 1). Plateau 7 provides the lowest R2 value: 0.67. The fact that plateau 1 and 3 provide the lowest absolute value of the difference between MP and IP and high value of R2 indicate that there is a correlation between the two, but it is not very strong.
Figure 6. The temperature difference of each plateau between the assigned values choosing the middle of the plateau –MP- and the assigned values using the inflection point of the third degree polynomial regression function -IP (left axis); Coefficient of determination R2 (of each plateau – right axis) indicates how well the third degree polynomial regression function fits the measured resistance values, see figure 4
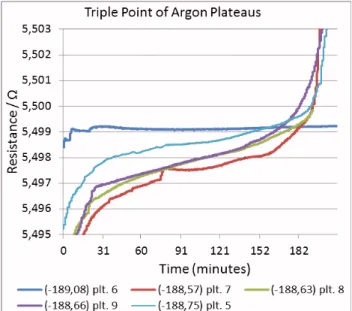
In figure 7, the third degree polynomial regression functions have different shapes (only 5 plateaus from 9 are presented). The functions are used to calculate the IP values (see table 2), which is the measured resistance at the inflection point. Also, they can be used as a approximation of the plateaus. For example it can be noticed that plateau no. 6 has the highest duration and a best stability, fact confirmed by tables 1 and 2. Figure 8 shows the actual measured values for 5 plateaus.
Figure 7. The third degree polynomial regression functions used to fit the measured resistance values during the triple point of argon plateaus with SPRT no. 2580
Figure 8. Five plateaus measured with SPRT no. 2580 (see table 1 for plateau numbers) and the average of the temperature (in the legend) measured by sensor 1 inside the Dewar vessel during the plateau (see figure 13)
Table 1. Basic information about the realized triple point of argon plateaus with the construction presented in figure 1 and
measured with 2 SPRTs. Plt. no.1) SPRT no. Date Min. value / Ω2) Max. value / Ω Δ / mK3) 1 0330 30.09.14 5,505816 5,505950 1,3 2 2580 15.10.14 5,498541 5,498607 0,7 3 2580 23.10.14 5,498989 5,498962 -0,3 4 2580 30.10.14 5,497994 5,498248 2,5 5 2580 08.04.15 5,498467 5,498487 0,2 6 2580 13.05.15 5,499090 5,499093 0,0 7 2580 14.05.15 5,496440 5,496837 4,0 8 2580 19.05.15 5,496395 5,496801 4,1 9 2580 29.05.15 5,496906 5,497183 2,8 1) Plateau number 2)
Lowest measured resistance values during the first 15 minutes of the triple point of argon plateau
3)
Difference between the lowest and highest measured
resistance values during the first 15 minutes of the plateau in temperature values
Table 2. Assigned values and duration of the realized triple point of argon plateaus with the construction presented in figure
1 and measured with 2 SPRTs.
Plt. no.1) MP value / Ω 2) IP value / Ω 3) Δ / mK4) R2 5) Plateau. duration / min 1 5,5061359 5,5061383 0,0 0,93 100 2 5,4993870 5,4992626 1,2 0,90 200 3 5,4992408 5,4992198 0,2 0,90 200 4 5,4990218 5,4989974 0,2 0,92 250 5 5,4985685 5,4986603 -0,9 0,84 100 6 5,4993089 5,4992390 0,7 0,82 330 7 5,4975428 5,4974702 0,7 0,67 120 8 5,4979259 5,4978548 0,7 0,92 150 9 5,4979462 5,4978655 0,8 0,94 100 1) Plateau number 2)
Assigned values choosing the middle of the plateau (MP)
3)
Assigned values using the inflection point of the third degree polynomial regression function (IP)
4)
Difference between MP and IP in temperature values
5)
Coefficient of determination R2
4 The liquid nitrogen temperature
monitoring
The liquid nitrogen temperature is measured with the 3 PRTs placed at different heights (two of them are shown in figure 2: sensor 1 and 2) inside the Dewar vessel during the triple point plateau. This monitoring is useful for the approximation of the LN2 level before and during
the plateau inside the closed Dewar vessel and a high temperature fluctuation of the LN2 indicates that the N2
pressure (see figure 3) is not well stabilized.
The lower sensor is useful in the first part of the plateau realization process (before the actual plateau), when the LN2 must cool only the lower chamber.
Practically, the lower sensor “indicates” how much LN2
shouldbe added in the vessel in order for the argon to condense only in the lower chamber.
At atmospheric pressure, LN2 boils at −195.79 °C, in
figures 9-13 the LN2 temperature is higher (around -189
°C). This is realized by maintaining the nitrogen vapor overpressure at a constant value of 1.1 bar.
Figure 9 and 10 show the results measured with only one PRT (the lower sensor – no. 1), figure 11 and 12 show the results obtained with two PRTs (the middle sensor – no. 2 and the lower sensor – no. 1). Figures 9-12 present the measured resistance during the plateau as well. The results obtained with the upper temperature sensor are not presented in this paper.
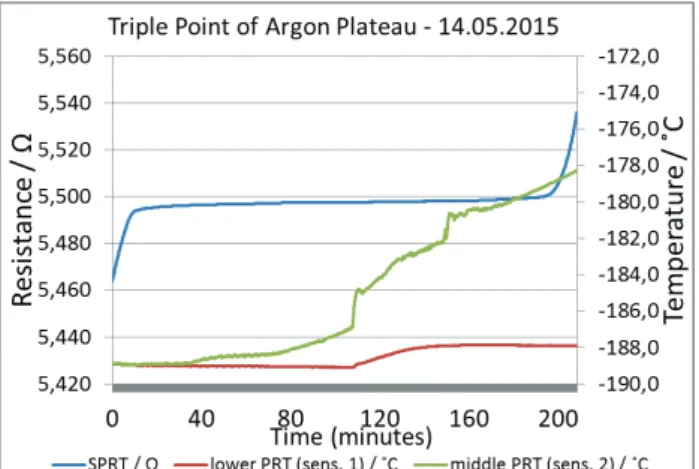
With respect to the LN2 level, Figure 11 shows that
during the plateau the LN2 has “reaches” the middle
sensor (green graph), and the temperature is starting to increase. On the other hand, figure 12 shows that both PRTs (red and green graphs) were under the LN2 level,
and indicate the LN2 temperature.
In figures 9-12 the temperature measured during the plateaus at the cell lower chamber level with the lower sensor (red graph) has a (0.1÷0.6) ˚C fluctuation. This is caused by the N2 vapor pressure instability inside the
Dewar vessel. For example, during plateau no. 5 (figure 9), the temperature has a 0.4 ˚C fluctuation in the first half of the plateau, and stabilized around 188.8 ˚C in the second half. Figure 13 shows the average of the
Dewar vessel during the plateaus (emphasized in figure 8), in correlation with the plateau slope. Figure 11, green graph, shows a considerable temperature increase in the second half of the plateau in the region where the middle sensor is placed, in the middle of the upper chamber (see figure 2). So, this region is not in isotherm state anymore and the plateau becomes shorter.
Figure 9. Resistance values during the plateau with SPRT no. 2580 (plateau no. 5) and the liquid nitrogen temperature
Figure 10. Resistance values during the plateau with SPRT no. 2580 (plateau no. 6) and the liquid nitrogen temperature
Figure 11. Resistance values during the plateau with SPRT no. 2580 (plateau no. 7) and the liquid nitrogen temperature
Figure 12. Resistance values during the plateau with SPRT no. 2580 (plateau no. 8) and the liquid nitrogen temperature
Figure 13. Average of the temperature measured by the lower sensor inside the Dewar vessel during the plateau (left axis) and slope (right axis)
5 Conclusions
Regarding the triple point realization process, the improvements are presented in the first part. The pressure is automatically adjusted and the temperature monitoring inside the Dewar vessel is achieved by 3 sensors (figure 1). The LN2 vapors on the output of the system are heated to 40 °C before they enter the regulator by a water bath (no. 1 – figure 3). The positioning of the lower sensor closer (sensor 1) to the upper chamber of the Ar cell is necessary These improvements prove to be very practical and allow a more efficient triple point realization.
The duration and slope of 9 plateaus was studied to determine the quality and stability of the plateaus. Plateaus 5 and 6 have the lowest slopes 0.03 mK/min and the longest plateau has more than 5 hours (figure 5 – no. 6). The durations of the plateaus are good, but the slopes are sometimes high. Four from the 9 presented plateaus had slopes calculated for the first 15 minutes of the plateau higher than 0.15 mK/min. One cause can be the insufficient N2 vapor pressure control, that we plan to improve in the future, together with the Dewar vessel LN2 filling procedure.
Regarding the liquid nitrogen temperature monitoring, the N2 vapor pressure instability inside the Dewar vessel
causes a (0.1÷0.6) ˚C fluctuation of the LN2 temperature
measured during the plateaus at the level of the cell’s lower chamber with the lower temperature sensor (figures 9-12). Also, there is a correlation between the temperature measured by the lower sensor inside the Dewar vessel during the plateau and slope (see figures 8 and 13). The most unstable plateaus (the ones with the highest slopes, no. 7, 8 and 9) have the highest LN2
temperature (around -188.6 ˚C).
For the second half of the plateau presented in figure 11 (green graph shows a considerable temperature increase), the LN2 does not cover the upper chamber of
the cell, this means that the plateau has to be considered only in the first half. Although the resistance provided by the SPRT remains stable (blue graph), in the second half the appropriate conditions for the Ar cell are no longer provided. The uniformity is realized only for the first 40 minutes.
References
1. Euramet project 1011, Metrology – in short, Third Edition (2008)
2. Preston-Thomas H., The International Temperature Scale of 1990 (ITS-90), Metrologia, 27, 3-10 (1990) 3. G. Bonnier, Point triple de l’argon (83.798 K)
référence de transfert, Bulletin d’information du BNM, 22, pp. 14-18 (1975)
4. Gaiţă S., Iacobescu F., Iliescu C., Dumitriu A., Instalaţia pentru materializarea punctului triplu al argonului, Proceedings of the Conference METSIM 2003, Bucharest, ISBN 2-914324-00-6 (2003)
5. E. Renaot et. al., Regional key comparison of the realisations of the ITS-90 from 83.8058 K to 692.677 K, Final report EUROMET.T-K3, Metrologia, 44